Copyright © 2015 Bert N. Langford (Images may be subject to copyright. Please send feedback)
Welcome to Our Generation USA!
This Page primarily covers the Economy of the United States, including how the United States impacts, and is impacted by, the Global Economy
The Economy of the United States and The World
YouTube Video: An Overview of Macroeconomics by University of California, Berkely, CA
Pictured: The Role of Supply and Demand
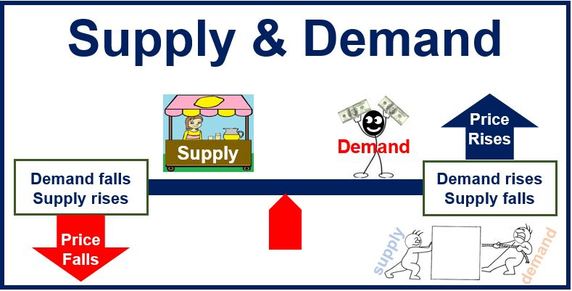
An economy is the production, distribution, or trade, and economic consumption of goods and services by a country. Understood in its broadest sense, 'The economic is defined as a social domain that emphasizes the practices, discourses, and material expressions associated with the production, use and management of resources'.
Economic agents can be individuals, businesses, organizations, or governments. Economic transactions occur when two parties agree to the value or price of the transacted good or service, commonly expressed in a certain currency, but monetary transactions are only a small part of the economic domain.
Economic activity is spurred by production which uses natural resources, labor, and capital. It has changed over time due to
A given economy is the result of a set of processes that involves its culture, values, education, technological evolution, history, social organization, political structure and legal systems, as well as its geography, natural resource endowment, and ecology, as main factors.
These factors give context, content, and set the conditions and parameters in which an economy functions. In other words, the economic domain is a social domain of human practices and transactions. It does not stand alone.
A market-based economy is where goods and services are produced and exchanged according to demand and supply between participants (economic agents) by barter or a medium of exchange with a credit or debit value accepted within the network, such as a unit of currency.
A command-based economy is where political agents directly control what is produced and how it is sold and distributed.
A green economy is low-carbon, resource efficient, and socially inclusive. In a green economy, growth in income and employment are driven by public and private investments that reduce carbon emissions and pollution, enhance energy and resource efficiency, and prevent the loss of biodiversity and ecosystem services.
The Economy of the United States:
The United States is the world's largest national economy in nominal terms and second largest according to purchasing power parity (PPP), representing 22% of nominal global GDP and 17% of gross world product (GWP).
The United States' GDP was estimated to be $17.914 trillion as of Q2 2015. The U.S. dollar is the currency most used in international transactions and is the world's foremost reserve currency. Several countries use it as their official currency, and in many others it is the de facto currency.
The United States has a mixed economy and has maintained a stable overall GDP growth rate, a moderate unemployment rate, and high levels of research and capital investment.
Its seven largest trading partners are Canada, China, Mexico, Japan, Germany, South Korea, and the United Kingdom.
The US has abundant natural resources, a well-developed infrastructure, and high productivity. It has the world's ninth-highest per capita GDP (nominal) and tenth-highest per capita GDP (PPP) as of 2013.
Americans have the highest average household and employee income among OECD nations, and in 2010 had the fourth highest median household income, down from second highest in 2007. It has been the world's largest national economy (not including colonial empires) since at least the 1890s.
The U.S. is the world's largest producer of oil and natural gas.
It is one of the largest trading nations in the world as well as the world's second largest manufacturer, representing a fifth of the global manufacturing output. The US not only has the largest internal market for goods, but also dominates the trade in services. US total trade amounted to $4.93T in 2012. Of the world's 500 largest companies, 128 are headquartered in the US.
The United States has one of the world's largest and most influential financial markets. The New York Stock Exchange is by far the world's largest stock exchange by market capitalization. Foreign investments made in the US total almost $2.4 trillion, while American investments in foreign countries total over $3.3 trillion.
The economy of the U.S. leads in international ranking on venture capital and Global Research and Development funding. Consumer spending comprises 71% of the US economy in 2013.
The United States has the largest consumer market in the world, with a household final consumption expenditure five times larger than Japan's. The labor market has attracted immigrants from all over the world and its net migration rate is among the highest in the world. The U.S. is one of the top-performing economies in studies such as the Ease of Doing Business Index, the Global Competitiveness Report, and others.
The US economy went through an economic downturn following the financial crisis of 2007–08, with output as late as 2013 still below potential according to the Congressional Budget Office.
The economy, however, began to recover in the second half of 2009, and as of November 2015, unemployment had declined from a high of 10% to 5%. In December 2014, public debt was slightly more than 100% of GDP. Domestic financial assets totaled $131 trillion and domestic financial liabilities totaled $106 trillion.
The World Economy:
The world economy or global economy is the economy of the world, considered as the international exchange of goods and services that is expressed in monetary units of account (money).
In some contexts, the two terms are distinguished: the "international" or "global economy" being measured separately and distinguished from national economies while the "world economy" is simply an aggregate of the separate countries' measurements. Beyond the minimum standard concerning value in production, use, and exchange the definitions, representations, models, and valuations of the world economy vary widely. It is inseparable from the geography and ecology of Earth.
It is common to limit questions of the world economy exclusively to human economic activity, and the world economy is typically judged in monetary terms, even in cases in which there is no efficient market to help valuate certain goods or services, or in cases in which a lack of independent research or government cooperation makes establishing figures difficult. Typical examples are illegal drugs and other black market goods, which by any standard are a part of the world economy, but for which there is by definition no legal market of any kind.
However, even in cases in which there is a clear and efficient market to establish a monetary value, economists do not typically use the current or official exchange rate to translate the monetary units of this market into a single unit for the world economy, since exchange rates typically do not closely reflect worldwide value, for example in cases where the volume or price of transactions is closely regulated by the government.
World share of GDP (PPP) (World Bank, 2011).
Rather, market valuations in a local currency are typically translated to a single monetary unit using the idea of purchasing power. This is the method used below, which is used for estimating worldwide economic activity in terms of real US dollars or euros. However, the world economy can be evaluated and expressed in many more ways. It is unclear, for example, how many of the world's 7.13 billion people have most of their economic activity reflected in these valuations.
As of 2015, the following 13 countries or regions have reached an economy of at least US$2 trillion by GDP in nominal or PPP terms:
Economic agents can be individuals, businesses, organizations, or governments. Economic transactions occur when two parties agree to the value or price of the transacted good or service, commonly expressed in a certain currency, but monetary transactions are only a small part of the economic domain.
Economic activity is spurred by production which uses natural resources, labor, and capital. It has changed over time due to
- technology (automation, accelerator of process, reduction of cost functions),
- innovation (new products, services, processes, new markets, expands markets, diversification of markets, niche markets, increases revenue functions) such as that which produces intellectual property,
- and changes in industrial relations (for example, child labor being replaced in some parts of the world with universal access to education).
A given economy is the result of a set of processes that involves its culture, values, education, technological evolution, history, social organization, political structure and legal systems, as well as its geography, natural resource endowment, and ecology, as main factors.
These factors give context, content, and set the conditions and parameters in which an economy functions. In other words, the economic domain is a social domain of human practices and transactions. It does not stand alone.
A market-based economy is where goods and services are produced and exchanged according to demand and supply between participants (economic agents) by barter or a medium of exchange with a credit or debit value accepted within the network, such as a unit of currency.
A command-based economy is where political agents directly control what is produced and how it is sold and distributed.
A green economy is low-carbon, resource efficient, and socially inclusive. In a green economy, growth in income and employment are driven by public and private investments that reduce carbon emissions and pollution, enhance energy and resource efficiency, and prevent the loss of biodiversity and ecosystem services.
The Economy of the United States:
The United States is the world's largest national economy in nominal terms and second largest according to purchasing power parity (PPP), representing 22% of nominal global GDP and 17% of gross world product (GWP).
The United States' GDP was estimated to be $17.914 trillion as of Q2 2015. The U.S. dollar is the currency most used in international transactions and is the world's foremost reserve currency. Several countries use it as their official currency, and in many others it is the de facto currency.
The United States has a mixed economy and has maintained a stable overall GDP growth rate, a moderate unemployment rate, and high levels of research and capital investment.
Its seven largest trading partners are Canada, China, Mexico, Japan, Germany, South Korea, and the United Kingdom.
The US has abundant natural resources, a well-developed infrastructure, and high productivity. It has the world's ninth-highest per capita GDP (nominal) and tenth-highest per capita GDP (PPP) as of 2013.
Americans have the highest average household and employee income among OECD nations, and in 2010 had the fourth highest median household income, down from second highest in 2007. It has been the world's largest national economy (not including colonial empires) since at least the 1890s.
The U.S. is the world's largest producer of oil and natural gas.
It is one of the largest trading nations in the world as well as the world's second largest manufacturer, representing a fifth of the global manufacturing output. The US not only has the largest internal market for goods, but also dominates the trade in services. US total trade amounted to $4.93T in 2012. Of the world's 500 largest companies, 128 are headquartered in the US.
The United States has one of the world's largest and most influential financial markets. The New York Stock Exchange is by far the world's largest stock exchange by market capitalization. Foreign investments made in the US total almost $2.4 trillion, while American investments in foreign countries total over $3.3 trillion.
The economy of the U.S. leads in international ranking on venture capital and Global Research and Development funding. Consumer spending comprises 71% of the US economy in 2013.
The United States has the largest consumer market in the world, with a household final consumption expenditure five times larger than Japan's. The labor market has attracted immigrants from all over the world and its net migration rate is among the highest in the world. The U.S. is one of the top-performing economies in studies such as the Ease of Doing Business Index, the Global Competitiveness Report, and others.
The US economy went through an economic downturn following the financial crisis of 2007–08, with output as late as 2013 still below potential according to the Congressional Budget Office.
The economy, however, began to recover in the second half of 2009, and as of November 2015, unemployment had declined from a high of 10% to 5%. In December 2014, public debt was slightly more than 100% of GDP. Domestic financial assets totaled $131 trillion and domestic financial liabilities totaled $106 trillion.
The World Economy:
The world economy or global economy is the economy of the world, considered as the international exchange of goods and services that is expressed in monetary units of account (money).
In some contexts, the two terms are distinguished: the "international" or "global economy" being measured separately and distinguished from national economies while the "world economy" is simply an aggregate of the separate countries' measurements. Beyond the minimum standard concerning value in production, use, and exchange the definitions, representations, models, and valuations of the world economy vary widely. It is inseparable from the geography and ecology of Earth.
It is common to limit questions of the world economy exclusively to human economic activity, and the world economy is typically judged in monetary terms, even in cases in which there is no efficient market to help valuate certain goods or services, or in cases in which a lack of independent research or government cooperation makes establishing figures difficult. Typical examples are illegal drugs and other black market goods, which by any standard are a part of the world economy, but for which there is by definition no legal market of any kind.
However, even in cases in which there is a clear and efficient market to establish a monetary value, economists do not typically use the current or official exchange rate to translate the monetary units of this market into a single unit for the world economy, since exchange rates typically do not closely reflect worldwide value, for example in cases where the volume or price of transactions is closely regulated by the government.
World share of GDP (PPP) (World Bank, 2011).
Rather, market valuations in a local currency are typically translated to a single monetary unit using the idea of purchasing power. This is the method used below, which is used for estimating worldwide economic activity in terms of real US dollars or euros. However, the world economy can be evaluated and expressed in many more ways. It is unclear, for example, how many of the world's 7.13 billion people have most of their economic activity reflected in these valuations.
As of 2015, the following 13 countries or regions have reached an economy of at least US$2 trillion by GDP in nominal or PPP terms:
- Brazil,
- China,
- France,
- Germany,
- India,
- Indonesia,
- Italy,
- Japan,
- Mexico,
- Russia,
- the United Kingdom,
- the United States,
- and the European Union.
Economics and Monetary Policy of the United States, including the President's Council of Economic Advisors
YouTube Video: Alan Greenspan on Brexit, U.S. Economy, and Inflation (Full Interview)
Pictured: LEFT: Study of Economics, CENTER: Monetary Policy of the United States, RIGHT: Seal of President's Council of Economic Advisors
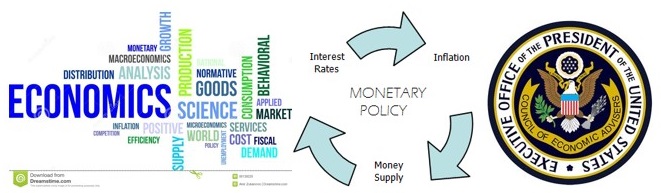
Economics is a social science concerned with the factors that determine the production, distribution, and consumption of goods and services.
Economics focuses on the behavior and interactions of economic agents and how economies work. Consistent with this focus, primary textbooks often distinguish between microeconomics and macroeconomics.
Microeconomics examines the behavior of basic elements in the economy, including individual agents and markets, their interactions, and the outcomes of interactions. Individual agents may include, for example, households, firms, buyers, and sellers.
Macroeconomics analyses the entire economy (meaning aggregated production, consumption, savings, and investment) and issues affecting it, including unemployment of resources (labor, capital, and land), inflation, economic growth, and the public policies that address these issues (monetary, fiscal, and other policies).
Other broad distinctions within economics include those between positive economics, describing "what is", and normative economics, advocating "what ought to be"; between economic theory and applied economics; between rational and behavioral economics; and between mainstream economics and heterodox economics.
Besides the traditional concern in production, distribution, and consumption in an economy, economic analysis may be applied throughout society, as in business, finance, health care, and government.
Economic analyses may also be applied to such diverse subjects as:
Education, for example, requires time, effort, and expenses, plus the foregone income and experience, yet these losses can be weighted against future benefits education may bring to the agent or the economy.
At the turn of the 21st century, the expanding domain of economics in the social sciences has been described as economic imperialism. The ultimate goal of economics is to improve the living conditions of people in their everyday life.
For more about Economics, click here.
___________________________________________________________________________
Monetary policy of the United States:
Monetary policy concerns the actions of a central bank or other regulatory authorities that determine the size and rate of growth of the money supply.
In the United States, the Federal Reserve is in charge of monetary policy, and implements it primarily by performing operations that influence short-term interest rates.
Click on any of the following blue hyperlinks for further amplification about Monetary policy of the United States:
President's Council of Economic Advisers
The Council of Economic Advisers (CEA) is an agency within the Executive Office of the President that advises the President of the United States on economic policy. The CEA provides much of the objective empirical research for the White House and prepares the annual Economic Report of the President.
Click on any of the following blue hyperlinks for further amplification:
Economics focuses on the behavior and interactions of economic agents and how economies work. Consistent with this focus, primary textbooks often distinguish between microeconomics and macroeconomics.
Microeconomics examines the behavior of basic elements in the economy, including individual agents and markets, their interactions, and the outcomes of interactions. Individual agents may include, for example, households, firms, buyers, and sellers.
Macroeconomics analyses the entire economy (meaning aggregated production, consumption, savings, and investment) and issues affecting it, including unemployment of resources (labor, capital, and land), inflation, economic growth, and the public policies that address these issues (monetary, fiscal, and other policies).
Other broad distinctions within economics include those between positive economics, describing "what is", and normative economics, advocating "what ought to be"; between economic theory and applied economics; between rational and behavioral economics; and between mainstream economics and heterodox economics.
Besides the traditional concern in production, distribution, and consumption in an economy, economic analysis may be applied throughout society, as in business, finance, health care, and government.
Economic analyses may also be applied to such diverse subjects as:
- crime,
- education,
- family,
- law,
- politics,
- religion,
- social institutions,
- war,
- science,
- and the environment.
Education, for example, requires time, effort, and expenses, plus the foregone income and experience, yet these losses can be weighted against future benefits education may bring to the agent or the economy.
At the turn of the 21st century, the expanding domain of economics in the social sciences has been described as economic imperialism. The ultimate goal of economics is to improve the living conditions of people in their everyday life.
For more about Economics, click here.
___________________________________________________________________________
Monetary policy of the United States:
Monetary policy concerns the actions of a central bank or other regulatory authorities that determine the size and rate of growth of the money supply.
In the United States, the Federal Reserve is in charge of monetary policy, and implements it primarily by performing operations that influence short-term interest rates.
Click on any of the following blue hyperlinks for further amplification about Monetary policy of the United States:
- Money supply
- Structure of modern US institutions
- Federal Reserve
U.S. Treasury
Private commercial banks
- Federal Reserve
- Money creation
- Significant effects
- Uncertainties
- Opinions of the Federal Reserve
- See also:
President's Council of Economic Advisers
The Council of Economic Advisers (CEA) is an agency within the Executive Office of the President that advises the President of the United States on economic policy. The CEA provides much of the objective empirical research for the White House and prepares the annual Economic Report of the President.
Click on any of the following blue hyperlinks for further amplification:
Economic History of the United States (Since 1950)
YouTube Video: The United States in 1950 (A Simpler Time?)
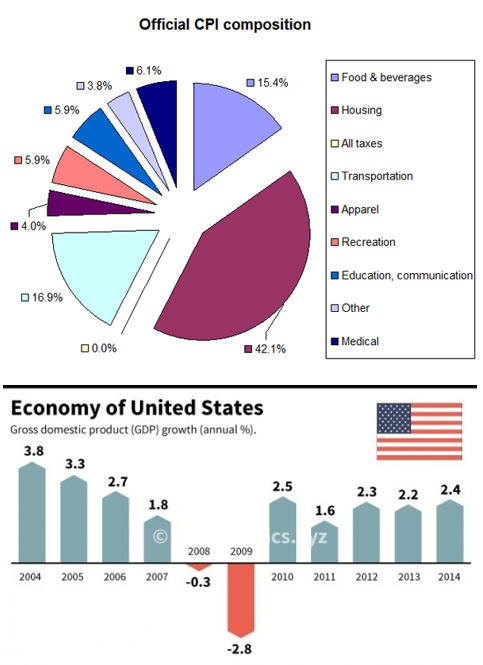
Pictured: TOP: Chart of Consumer Price Index (CPI) Composition.
BOTTOM: The economy of the United States as a measure of growth based on the Gross Domestic Product (GDP)
The Economic History of the United States is about characteristics of and important developments in the U.S. economy. The emphasis is on economic performance and how it was affected by new technologies, the change of size in economic sectors and the effects of legislation and government policy. Specialized teams and business history are covered in American business history.
The period from the end of World War II to the early 1970s was a golden era of economic growth. $200 billion in war bonds matured, and the G.I. Bill financed a well-educated work force.
The middle class swelled, as did GDP and productivity. This growth was distributed fairly evenly across the economic classes, which some attribute to the strength of labor unions in this period—labor union membership peaked historically in the U.S. during the 1950s, in the midst of this massive economic growth.
Much of the growth came from the movement of low income farm workers into better paying jobs in the towns and cities—a process largely completed by 1960. Congress created the Council of Economic Advisors, to promote high employment, high profits and low inflation.
The Eisenhower administration (1953–1961) supported an activist contracyclical approach that helped to establish Keynesianism as a bipartisan economic policy for the nation.
Especially important in formulating the CEA response to the recession—accelerating public works programs, easing credit, and reducing taxes—were Arthur F. Burns and Neil H. Jacoby. "I am now a Keynesian in economics", proclaimed Republican President Richard Nixon in 1969.
Although this period brought economic expansion to the country as a whole, it was not recession proof. The recessions of 1953, 1958, and 1960 saw a drastic decline in GDP.
The "Baby Boom" saw a dramatic increase in fertility in the period 1942–1957; it was caused by delayed marriages and childbearing during depression years, a surge in prosperity, a demand for suburban single-family homes (as opposed to inner city apartments) and new optimism about the future. The boom crested about 1957, then slowly declined
Click on any of the following for major developments impacting the United States since 1950:
- Agriculture
- Aircraft and air transportation industries
- Interstate highway system
- Mainframe computers
- Liberal programs
- Military and space spending
Congressional Budget Office (CBO)
YouTube Video: Introduction to the Congressional Budget Office
Pictured below: An Analysis of the President’s 2018 Budget
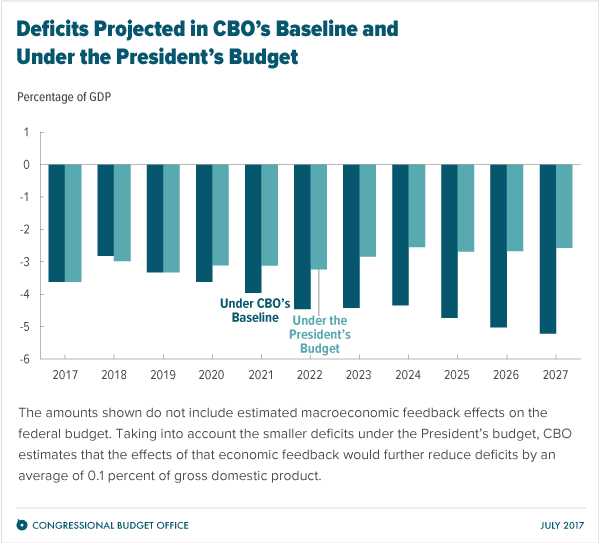
The Congressional Budget Office (CBO) is a federal agency within the legislative branch of the United States government that provides budget and economic information to Congress.
Inspired by California's Legislative Analyst's Office that manages the state budget in a strictly nonpartisan fashion, the CBO was created as a nonpartisan agency by the Congressional Budget and Impoundment Control Act of 1974.
There is a consensus among economists that "the CBO has historically issued credible forecasts of the effects of both Democratic and Republican legislative proposals."
Mission:
The Congressional Budget Office is nonpartisan, and produces "independent analyses of budgetary and economic issues to support the Congressional budget process." Each year, the agency releases reports and cost estimates for proposed legislation, without issuing any policy recommendations.
With respect to estimating spending for Congress, the Congressional Budget Office serves a purpose parallel to that of the Joint Committee on Taxation for estimating revenue for Congress, the Department of the Treasury for estimating revenues for the Executive branch. This includes projections on the effect on national debt and cost estimates for legislation.
Operations:
Section 202(e) of the Budget Act requires the CBO to submit periodic reports about fiscal policy to the House and Senate budget committees to provide baseline projections of the federal budget. This is currently done by preparation of an annual Economic and Budget Outlook plus a mid-year update.
The agency also each year issues An Analysis of the President's Budgetary Proposals for the upcoming fiscal year per a standing request of the Senate Committee on Appropriations.
These three series are designated essential titles distributed to Federal Depository Libraries and are available for purchase from the Government Publishing Office. The CBO often provides testimony in response to requests from various Congressional committees and issues letters responding to queries made by members of Congress.
Departmental Divisions:
The Congressional Budget Office is divided into eight divisions:
Click on the following blue hyperlinks for more about The Congressional Budget Office (CBO):
Inspired by California's Legislative Analyst's Office that manages the state budget in a strictly nonpartisan fashion, the CBO was created as a nonpartisan agency by the Congressional Budget and Impoundment Control Act of 1974.
There is a consensus among economists that "the CBO has historically issued credible forecasts of the effects of both Democratic and Republican legislative proposals."
Mission:
The Congressional Budget Office is nonpartisan, and produces "independent analyses of budgetary and economic issues to support the Congressional budget process." Each year, the agency releases reports and cost estimates for proposed legislation, without issuing any policy recommendations.
With respect to estimating spending for Congress, the Congressional Budget Office serves a purpose parallel to that of the Joint Committee on Taxation for estimating revenue for Congress, the Department of the Treasury for estimating revenues for the Executive branch. This includes projections on the effect on national debt and cost estimates for legislation.
Operations:
Section 202(e) of the Budget Act requires the CBO to submit periodic reports about fiscal policy to the House and Senate budget committees to provide baseline projections of the federal budget. This is currently done by preparation of an annual Economic and Budget Outlook plus a mid-year update.
The agency also each year issues An Analysis of the President's Budgetary Proposals for the upcoming fiscal year per a standing request of the Senate Committee on Appropriations.
These three series are designated essential titles distributed to Federal Depository Libraries and are available for purchase from the Government Publishing Office. The CBO often provides testimony in response to requests from various Congressional committees and issues letters responding to queries made by members of Congress.
Departmental Divisions:
The Congressional Budget Office is divided into eight divisions:
- Budget Analysis
- Financial Analysis
- Health, Retirement, and Long-Term Analysis
- Macroeconomic Analysis
- Management, Business, and Information Services
- Microeconomic Studies
- National Security
- Tax Analysis
Click on the following blue hyperlinks for more about The Congressional Budget Office (CBO):
Causes of Income Inequality in the United States and their impact on America's Shrinking Middle Class
YouTube Video; Is America Dreaming?: Understanding Social Mobility (by the Brookings Institution)
Pictured Below:
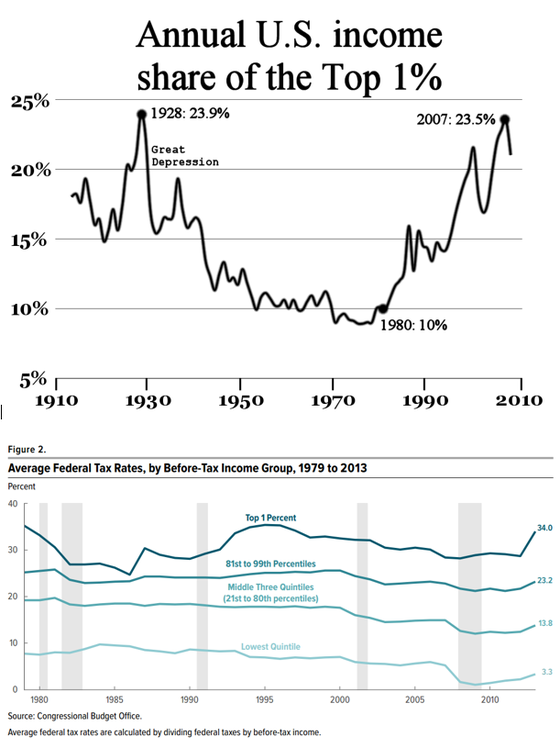
TOP CHART: “Annual U.S. Income share of the Top 1% Income Earners”
BOTTOM CHART: Distribution of US federal taxes from 1979 to 2013, based on CBO Estimates. (Courtesy of US Congressional Budget Office, publication 44604)
YouTube Video; Is America Dreaming?: Understanding Social Mobility (by the Brookings Institution)
Pictured Below:
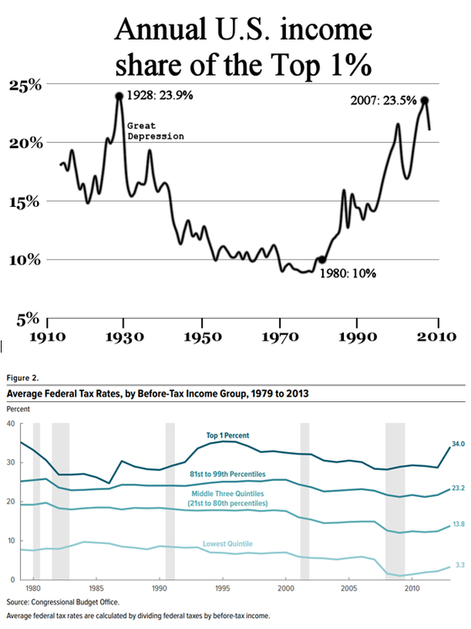
TOP CHART: “Annual U.S. Income share of the Top 1% Income Earners”
BOTTOM CHART: Distribution of US federal taxes from 1979 to 2013, based on CBO Estimates. (Courtesy of US Congressional Budget Office, publication 44604)
As Reported By PEW Research Center (12/9/2015): "No longer the majority and falling behind financially"
"After more than four decades of serving as the nation’s economic majority, the American middle class is now matched in number by those in the economic tiers above and below it. In early 2015, 120.8 million adults were in middle-income households, compared with 121.3 million in lower- and upper-income households combined, a demographic shift that could signal a tipping point, according to a new Pew Research Center analysis of government data..."
Click here for more from the PEW Research Center: "The American Middle Class Is Losing Ground"
Causes of income inequality in the United States describes why changes in the country's income distribution are occurring. This topic is subject to extensive ongoing research, media attention, and political interest, as it involves how the national income of the country is split among its people at various income levels.
Overview:
Income inequality in the United States has grown significantly since the early 1970s, after several decades of stability, and has been the subject of study of many scholars and institutions. The U.S. consistently exhibits higher rates of income inequality than most developed nations, arguably due to the nation's relatively enhanced support of free market capitalism.
According to the CBO and others, "the precise reasons for the [recent] rapid growth in income at the top are not well understood", but "in all likelihood," an "interaction of multiple factors" was involved. "Researchers have offered several potential rationales."[16][19] Some of these rationales conflict, some overlap. They include:
Paul Krugman put several of these factors into context in January 2015: "Competition from emerging-economy exports has surely been a factor depressing wages in wealthier nations, although probably not the dominant force.
More important, soaring incomes at the top were achieved, in large part, by squeezing those below: by cutting wages, slashing benefits, crushing unions, and diverting a rising share of national resources to financial wheeling and dealing...Perhaps more important still, the wealthy exert a vastly disproportionate effect on policy. And elite priorities — obsessive concern with budget deficits, with the supposed need to slash social programs — have done a lot to deepen (wage stagnation and income inequality)"
Click on any of the following blue hyperlinks for more about The Causes of Income Inequality:
"After more than four decades of serving as the nation’s economic majority, the American middle class is now matched in number by those in the economic tiers above and below it. In early 2015, 120.8 million adults were in middle-income households, compared with 121.3 million in lower- and upper-income households combined, a demographic shift that could signal a tipping point, according to a new Pew Research Center analysis of government data..."
Click here for more from the PEW Research Center: "The American Middle Class Is Losing Ground"
Causes of income inequality in the United States describes why changes in the country's income distribution are occurring. This topic is subject to extensive ongoing research, media attention, and political interest, as it involves how the national income of the country is split among its people at various income levels.
Overview:
Income inequality in the United States has grown significantly since the early 1970s, after several decades of stability, and has been the subject of study of many scholars and institutions. The U.S. consistently exhibits higher rates of income inequality than most developed nations, arguably due to the nation's relatively enhanced support of free market capitalism.
According to the CBO and others, "the precise reasons for the [recent] rapid growth in income at the top are not well understood", but "in all likelihood," an "interaction of multiple factors" was involved. "Researchers have offered several potential rationales."[16][19] Some of these rationales conflict, some overlap. They include:
- the globalization hypothesis – low skilled American workers have been losing ground in the face of competition from low-wage workers in Asia and other "emerging" economies;
- skill-biased technological change – the rapid pace of progress in information technology has increased the demand for the highly skilled and educated so that income distribution favored brains rather than brawn;
- the superstar hypothesis – modern technologies of communication often turn competition into a tournament in which the winner is richly rewarded, while the runners-up get far less than in the past;
- immigration of less-educated workers – relatively high levels of immigration of low skilled workers since 1965 may have reduced wages for American-born high school dropouts;
- changing institutions and norms – Unions were a balancing force, helping ensure wages kept up with productivity and that neither executives nor shareholders were unduly rewarded. Further, societal norms placed constraints on executive pay. This changed as union power declined (the share of unionized workers fell significantly during the Great Divergence, from over 30% to around 12%) and CEO pay skyrocketed (rising from around 40 times the average workers pay in the 1970s to over 350 times in the early 2000s).
- policy, politics and race – movement conservatives increased their influence over the Republican Party beginning in the 1970s, moving it politically rightward. Combined with the Party's expanded political power (enabled by a shift of southern white Democrats to the Republican Party following the passage of Civil Rights legislation in the 1960s), this resulted in more regressive tax laws, anti-labor policies, and further limited expansion of the welfare state relative to other developed nations (e.g., the unique absence of universal healthcare).
Paul Krugman put several of these factors into context in January 2015: "Competition from emerging-economy exports has surely been a factor depressing wages in wealthier nations, although probably not the dominant force.
More important, soaring incomes at the top were achieved, in large part, by squeezing those below: by cutting wages, slashing benefits, crushing unions, and diverting a rising share of national resources to financial wheeling and dealing...Perhaps more important still, the wealthy exert a vastly disproportionate effect on policy. And elite priorities — obsessive concern with budget deficits, with the supposed need to slash social programs — have done a lot to deepen (wage stagnation and income inequality)"
Click on any of the following blue hyperlinks for more about The Causes of Income Inequality:
Income Inequality in the United States
YouTube Video: U.S. Income Equality Keeps Getting Worse*
*-CNN article excerpted in text below Picture:
From CNN, 12/22/16 by Heather Long
"Inequality in America is getting uglier."
"The gap between the "haves" and "have nots" is widening, according to the latest data out this week.
The rich are money-making machines. Today, the top mega wealthy -- the top 1% -- earn an average of $1.3 million a year. It's more than three times as much as the 1980s, when the rich "only" made $428,000, on average, according to economists Thomas Piketty, Emmanuel Saez and Gabriel Zucman.
Meanwhile, the bottom 50% of the American population earned an average of $16,000 in pre-tax income in 1980. That hasn't changed in over three decades.
As if that's not depressing enough, living the American Dream is also getting harder to do.
Millennials, born in the 1980s, only have a 50% likelihood -- a coin toss chance -- of earning more money than their parents did, according to new research released this month from the Equality of Opportunity Project.
It wasn't always this way. In the 1940s, almost everyone in America grew up to be better off financially than their parents. While money isn't the only definition of success, more wealth typically leads to bigger houses, grander vacations, fancier cars and more opportunities to advance.
Children's prospects of achieving the 'American Dream' of earning more than their parents have fallen from 90% to 50% over the past half century," the researchers wrote in their report." : Click here for fully article.
___________________________________________________________________________
Income inequality in the United States has increased significantly since the 1970s after several decades of stability, meaning the share of the nation's income received by higher income households has increased.
This trend is evident with income measured both before taxes (market income) as well as after taxes and transfer payments. Income inequality has fluctuated considerably since measurements began around 1915, moving in an arc between peaks in the 1920s and 2000s, with a 30-year period of relatively lower inequality between 1950–1980.
Measured for all households, U.S. income inequality is comparable to other developed countries before taxes and transfers, but is among the highest after taxes and transfers, meaning the U.S. shifts relatively less income from higher income households to lower income households.
Measured for working-age households, market income inequality is comparatively high (rather than moderate) and the level of redistribution is moderate (not low). These comparisons indicate Americans shift from reliance on market income to reliance on income transfers later in life and less than households in other developed countries do.
The U.S. ranks around the 30th percentile in income inequality globally, meaning 70% of countries have a more equal income distribution. U.S. federal tax and transfer policies are progressive and therefore reduce income inequality measured after taxes and transfers. Tax and transfer policies together reduced income inequality slightly more in 2011 than in 1979.
While there is strong evidence that it has increased since the 1970s, there is active debate in the United States regarding the appropriate measurement, causes, effects and solutions to income inequality.
The two major political parties have different approaches to the issue, with Democrats historically emphasizing that economic growth should result in shared prosperity (i.e., a pro-labor argument advocating income redistribution), while Republicans tend to downplay the validity or feasibility of positively influencing the issue (i.e., a pro-capital argument against redistribution).
Overview:
U.S. income inequality has grown significantly since the early 1970s, after several decades of stability, and has been the subject of study of many scholars and institutions. The U.S. consistently exhibits higher rates of income inequality than most developed nations due to the nation's enhanced support of free market capitalism and less progressive spending on social services.
The top 1% of income earners received approximately 20% of the pre-tax income in 2013, versus approximately 10% from 1950 to 1980. The top 1% is not homogeneous, with the very top income households pulling away from others in the top 1%. For example, the top 0.1% of households received approximately 10% of the pre-tax income in 2013, versus approximately 3–4% between 1951–1981.
According to IRS data, adjusted gross income (AGI) of approximately $430,000 was required to be in the top 1% in 2013.
Most of the growth in income inequality has been between the middle class and top earners, with the disparity widening the further one goes up in the income distribution. The bottom 50% earned 20% of the nation's pre-tax income in 1979; this fell steadily to 14% by 2007 and 13% by 2014. Income for the middle 40% group, a proxy for the middle class, fell from 45% in 1979 to 41% in both 2007 and 2014.
To put this change into perspective, if the US had the same income distribution it had in 1979, each family in the bottom 80% of the income distribution would have $11,000 more per year in income on average, or $916 per month. Half of the U.S. population lives in poverty or is low-income, according to U.S. Census data.
The trend of rising income inequality is also apparent after taxes and transfers. A 2011 study by the CBO found that the top earning 1 percent of households increased their income by about 275% after federal taxes and income transfers over a period between 1979 and 2007, compared to a gain of just under 40% for the 60 percent in the middle of America's income distribution.
U.S. federal tax and transfer policies are progressive and therefore substantially reduce income inequality measured after taxes and transfers. They became moderately less progressive between 1979 and 2007, but slightly more progressive measured between 1979 and 2011. Income transfers had a greater impact on reducing inequality than taxes from 1979 to 2011.
Americans are not generally aware of the extent of inequality or recent trends. There is a direct relationship between actual income inequality and the public's views about the need to address the issue in most developed countries, but not in the U.S., where income inequality is worse but the concern is lower.
The U.S. was ranked the 6th worst among 173 countries (4th percentile) on income equality measured by the Gini index.
There is significant and ongoing debate as to the causes, economic effects, and solutions regarding income inequality. While before-tax income inequality is subject to market factors (e.g., globalization, trade policy, labor policy, and international competition), after-tax income inequality can be directly affected by tax and transfer policy. U.S. income inequality is comparable to other developed nations before taxes and transfers, but is among the worst after taxes and transfers. Income inequality may contribute to slower economic growth, reduced income mobility, higher levels of household debt, and greater risk of financial crises and deflation.
Labor (workers) and capital (owners) have always battled over the share of the economic pie each obtains. The influence of the labor movement has waned in the U.S. since the 1960s along with union participation and more pro-capital laws. The share of total worker compensation has declined from 58% of national income (GDP) in 1970 to nearly 53% in 2013, contributing to income inequality. This has led to concerns that the economy has shifted too far in favor of capital, via a form of corporatism, corpocracy or neoliberalism.
Although some have spoken out in favor of moderate inequality as a form of incentive, others have warned against the current high levels of inequality, including Yale Nobel prize for economics winner Robert J. Shiller, (who called rising economic inequality "the most important problem that we are facing now today"), former Federal Reserve Board chairman Alan Greenspan, ("This is not the type of thing which a democratic society – a capitalist democratic society – can really accept without addressing"), and President Barack Obama (who referred to the widening income gap as the "defining challenge of our time").
after several decades of stability, and has been the subject of study of many scholars and institutions.
For more about Income Inequality in the United States, click on any of the following blue hyperlinks:
- History
- Causes
- Effects: Economic
- Effects: Socio-economic mobility
- Effects on democracy and society
- Public attitudes
- States and cities
- International comparisons
- Policy responses
- Overview
- Resources available to children
- Affordable higher education
- Public welfare and infrastructure spending
- Taxes on the wealthy
- Reduce tax expenditures
- Corporate tax reform
- Minimum wages
- Maximum wage implementation
- Subsidies and income guarantees
- Rent-seeking limits
- Economic democracy
- Monetary policy
- Measurement approaches
- Wealth inequality
- See also:
- American Dream
- Economic inequality
- Economic mobility
- Economy of the United States
- Educational attainment in the United States
- High-net-worth individual
- Homelessness in the United States
- Inequality for All – 2013 documentary film presented by Robert Reich
- Income inequality metrics
- Legatum Prosperity Index
- List of countries by income equality
- List of countries by inequality-adjusted HDI
- Median income per household member
- Middle-class squeeze
- Occupy Movement
- Racial inequality in the United States
- Second Bill of Rights
- Socio-economic mobility in the United States
- The Divide: American Injustice in the Age of the Wealth Gap – book
- The Spirit Level: Why More Equal Societies Almost Always Do Better – book
- Social justice
- Tax policy and economic inequality in the United States
Widening Gap in Income between the wealthiest 1% and the rest of Americans
YouTube Video by Robert Reich*: "Inequality for All"
* -- Robert Reich, Chancellor's Professor of Public Policy, University of California, Berkeley; Former Secretary of Labor
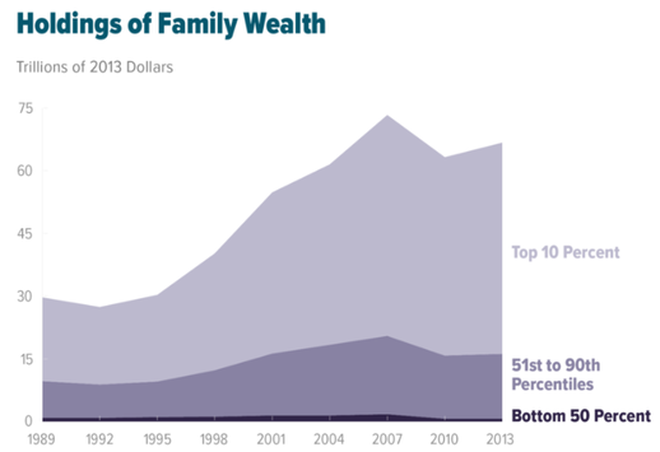
Pictured: CBO Chart, U.S. Holdings of Family Wealth 1989 to 2013. The top 10% of families held 76% of the wealth in 2013, while the bottom 50% of families held 1%. Inequality worsened from 1989 to 2013.
Wealth inequality in the United States (also known as the wealth gap) is the unequal distribution of assets among residents of the United States.
Wealth includes the values of homes, automobiles, personal valuables, businesses, savings, and investments.
However, according to the federal reserve, "For most households, pensions and Social Security are the most important sources of income during retirement, and the promised benefit stream constitutes a sizable fraction of household wealth" and "including pensions and Social Security in net worth makes the distribution more even".
Just prior to President Obama's 2014 State of the Union Address, media reported that the top wealthiest 1% possess 40% of the nation’s wealth; the bottom 80% own 7%; similarly, but later, the media reported, the "richest 1 percent in the United States now own more additional income than the bottom 90 percent".
The gap between the top 10% and the middle class is over 1,000%; that increases another 1,000% for the top 1%. The average employee "needs to work more than a month to earn what the CEO earns in one hour." Although different from income inequality, the two are related.
In Inequality for All—a 2013 documentary with Robert Reich in which he argued that income inequality is the defining issue for the United States—Reich states that 95% of economic gains went to the top 1% net worth (HNWI) since 2009 when the recovery allegedly started.
More recently, in 2017, an Oxfam study found that eight rich people, six of them Americans, own as much combined wealth as "half the human race".
A 2011 study found that US citizens across the political spectrum dramatically underestimate the current US wealth inequality and would prefer a far more egalitarian distribution of wealth.
Wealth is usually not used for daily expenditures or factored into household budgets, but combined with income it comprises the family's total opportunity "to secure a desired stature and standard of living, or pass their class status along to one's children".
Moreover, "wealth provides for both short- and long-term financial security, bestows social prestige, and contributes to political power, and can be used to produce more wealth."
Hence, wealth possesses a psychological element that awards people the feeling of agency, or the ability to act. The accumulation of wealth grants more options and eliminates restrictions about how one can live life. Dennis Gilbert asserts that the standard of living of the working and middle classes is dependent upon income and wages, while the rich tend to rely on wealth, distinguishing them from the vast majority of Americans.
A September 2014 study by Harvard Business School declared that the growing disparity between the very wealthy and the lower and middle classes is no longer sustainable.
Click on any of the following blue hyperlinks for more about Wealth Inequality in the United States:
- Statistics
- Wealth and income
- Wealth inequality and child poverty
- Causes of wealth inequality
- Racial disparities
- Effect on democracy
- See also:
- Affluence in the United States
- Citizens United v. Federal Election Commission
- Donor Class
- Monetary policy
- Net worth
- "Occupy" protests
- Occupy Wall Street
- Oligarchy
- Plutocracy
- Pareto principle
- Power elite
- Redistribution of wealth
- Tax Policy and Economic Inequality in the United States
- The Divide: American Injustice in the Age of the Wealth Gap
- Wealth concentration
- Wealth in the United States
- We are the 99%
Economic Globalization
YouTube: The Link Between Globalization and Political Instability
(Video by Stanford Graduate School of Business)
Pictured below: The Impact of Globalization On Economic Growth (See below)
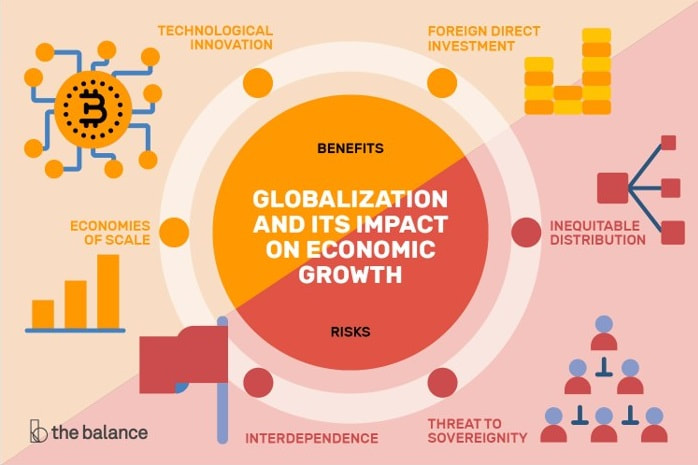
The Impact of Globalization On Economic Growth by The Balance
Globalization has impacted nearly every aspect of modern life. While some U.S. citizens may not be able to locate Beijing, China on a map, they certainly purchase an overwhelming number of goods that were manufactured there.
According to a 2010 Federal Reserve Bank of San Francisco report, approximately 35.6 percent of all clothing and shoes sold in the United States were actually manufactured in China, compared to just 3.4 percent made domestically. Below is a look beyond the everyday implications of globalization and towards the economic implications that impact international investors.
Globalization Benefits World Economies:
Most economists agree that globalization provides a net benefit to individual economies around the world, by making markets more efficient, increasing competition, limiting military conflicts, and spreading wealth more equally around the world.
However, the general public tends to assume that the costs associated with globalization outweigh the benefits, especially in the short-term, which has caused problems we’ll explore in the next section on protectionism.
The Milken Institute’s Globalization of the World Economy report highlights many of the benefits associated with globalization while outlining some of the associated risks that governments and investors should consider.
But, in aggregate, there is a consensus among economists that globalization provides a net benefit to nations around the world and therefore should be embraced on the whole by governments and individuals.
Some of the benefits of globalization include:
Some of the risks of globalization include:
Tariffs & Other Forms of Protectionism:
The 2008 economic crisis led many politicians to question the merits of globalization. Since then, global capital flows fell from $11 trillion in 2007 to a third of that figure in 2012. While some of that may be cyclical in nature, many countries implemented tariffs and other forms of protectionism designed to contain risk in their financial systems and make crises less damaging, although this comes at the cost of forgoing the benefits we’ve seen.
In the U.S. and Europe, new banking regulations were introduced that limited capital flows in order to reduce the risk of contagion. Tariffs have also been put in place to protect domestic industries seen as vital, such as the 127% U.S. tariff on Chinese paper clips or Japan’s 778% tariff on imported rice.
In developing countries, these figures are even worse, with Brazil’s tariffs being some four times higher than America’s and three times higher than China’s.
The election of Donald Trump in the United States and the British vote to leave the European Union - known as the 'Brexit' - have also contributed to the anti-globalization movement.
These trends have been driven by anti-immigration sentiments in Europe, although elections occurring in the past year have proven to be largely pro-globalization rather than anti-globalization.
Globalization may be inevitable over the long-run, but there are many bumps along the road in the short-run. These bumps are often spurred by economic crises or some of the negative consequences of globalization, but in the end, the world has always managed to learn that protectionism can make a bad situation worse.
The Bottom Line:
Globalization has impacted nearly every aspect of modern life and continues to be a growing force in the global economy. While there are a few drawbacks to globalization, most economists agree that it's a force that's both unstoppable and net beneficial to the world economy.
There have always been periods of protectionism and nationalism in the past, but globalization continues to be the most widely accepted solution to ensuring consistent economic growth around the world.
[End of Article]
___________________________________________________________________________
Economic globalization is one of the three main dimensions of globalization commonly found in academic literature, with the two others being political globalization and cultural globalization, as well as the general term of globalization.
Economic globalization refers to the free movement of goods, capital, services, technology and information. It is the increasing economic integration and interdependence of national, regional, and local economies across the world through an intensification of cross-border movement of goods, services, technologies and capital.
Whereas globalization is a broad set of processes concerning multiple networks of economic, political, and cultural interchange, contemporary economic globalization is propelled by the rapid growing significance of information in all types of productive activities and marketization, and by developments in science and technology.
Economic globalization primarily comprises the globalization of production, finance, markets, technology, organizational regimes, institutions, corporations, and labor.
While economic globalization has been expanding since the emergence of trans-national trade, it has grown at an increased rate due to an increase in communication and technological advances under the framework of General Agreement on Tariffs and Trade and World Trade Organization, which made countries gradually cut down trade barriers and open up their current accounts and capital accounts.
This recent boom has been largely supported by developed economies integrating with majority world through foreign direct investment and lowering costs of doing business, the reduction of trade barriers, and in many cases cross border migration
While globalization has radically increased incomes and economic growth in developing countries and lowered consumer prices in developed countries, it also changes the power balance between developing and developed countries and affects the culture of each affected country.
And the shifting location of goods production has caused many jobs to cross borders, requiring some workers in developed countries to change careers.
Click on any of the following blue hyperlinks for more about Economic Globalization:
Globalization has impacted nearly every aspect of modern life. While some U.S. citizens may not be able to locate Beijing, China on a map, they certainly purchase an overwhelming number of goods that were manufactured there.
According to a 2010 Federal Reserve Bank of San Francisco report, approximately 35.6 percent of all clothing and shoes sold in the United States were actually manufactured in China, compared to just 3.4 percent made domestically. Below is a look beyond the everyday implications of globalization and towards the economic implications that impact international investors.
Globalization Benefits World Economies:
Most economists agree that globalization provides a net benefit to individual economies around the world, by making markets more efficient, increasing competition, limiting military conflicts, and spreading wealth more equally around the world.
However, the general public tends to assume that the costs associated with globalization outweigh the benefits, especially in the short-term, which has caused problems we’ll explore in the next section on protectionism.
The Milken Institute’s Globalization of the World Economy report highlights many of the benefits associated with globalization while outlining some of the associated risks that governments and investors should consider.
But, in aggregate, there is a consensus among economists that globalization provides a net benefit to nations around the world and therefore should be embraced on the whole by governments and individuals.
Some of the benefits of globalization include:
- Foreign Direct Investment. Foreign direct investment (“FDI”) tends to increase at a much greater rate than the growth in world trade, helping boost technology transfer, industrial restructuring, and the growth of global companies.
- Technological Innovation. Increased competition from globalization helps stimulate new technology development, particularly with the growth in FDI, which helps improve economic output by making processes more efficient.
- Economies of Scale. Globalization enables large companies to realize economies of scale that reduce costs and prices, which in turn supports further economic growth, although this can hurt many small businesses attempting to compete domestically.
Some of the risks of globalization include:
- Interdependence. Globalization leads to the interdependence between nations, which could cause regional or global instabilities if local economic fluctuations end up impacting a large number of countries relying on them.
- National Sovereignty. Some see the rise of nation-states, multinational or global firms and other international organizations as a threat to sovereignty. Ultimately, this could cause some leaders to become nationalistic or xenophobic.
- Equity Distribution. The benefits of globalization can be unfairly skewed towards rich nations or individuals, creating greater inequalities and leading to potential conflicts both nationally and internationally as a result.
Tariffs & Other Forms of Protectionism:
The 2008 economic crisis led many politicians to question the merits of globalization. Since then, global capital flows fell from $11 trillion in 2007 to a third of that figure in 2012. While some of that may be cyclical in nature, many countries implemented tariffs and other forms of protectionism designed to contain risk in their financial systems and make crises less damaging, although this comes at the cost of forgoing the benefits we’ve seen.
In the U.S. and Europe, new banking regulations were introduced that limited capital flows in order to reduce the risk of contagion. Tariffs have also been put in place to protect domestic industries seen as vital, such as the 127% U.S. tariff on Chinese paper clips or Japan’s 778% tariff on imported rice.
In developing countries, these figures are even worse, with Brazil’s tariffs being some four times higher than America’s and three times higher than China’s.
The election of Donald Trump in the United States and the British vote to leave the European Union - known as the 'Brexit' - have also contributed to the anti-globalization movement.
These trends have been driven by anti-immigration sentiments in Europe, although elections occurring in the past year have proven to be largely pro-globalization rather than anti-globalization.
Globalization may be inevitable over the long-run, but there are many bumps along the road in the short-run. These bumps are often spurred by economic crises or some of the negative consequences of globalization, but in the end, the world has always managed to learn that protectionism can make a bad situation worse.
The Bottom Line:
Globalization has impacted nearly every aspect of modern life and continues to be a growing force in the global economy. While there are a few drawbacks to globalization, most economists agree that it's a force that's both unstoppable and net beneficial to the world economy.
There have always been periods of protectionism and nationalism in the past, but globalization continues to be the most widely accepted solution to ensuring consistent economic growth around the world.
[End of Article]
___________________________________________________________________________
Economic globalization is one of the three main dimensions of globalization commonly found in academic literature, with the two others being political globalization and cultural globalization, as well as the general term of globalization.
Economic globalization refers to the free movement of goods, capital, services, technology and information. It is the increasing economic integration and interdependence of national, regional, and local economies across the world through an intensification of cross-border movement of goods, services, technologies and capital.
Whereas globalization is a broad set of processes concerning multiple networks of economic, political, and cultural interchange, contemporary economic globalization is propelled by the rapid growing significance of information in all types of productive activities and marketization, and by developments in science and technology.
Economic globalization primarily comprises the globalization of production, finance, markets, technology, organizational regimes, institutions, corporations, and labor.
While economic globalization has been expanding since the emergence of trans-national trade, it has grown at an increased rate due to an increase in communication and technological advances under the framework of General Agreement on Tariffs and Trade and World Trade Organization, which made countries gradually cut down trade barriers and open up their current accounts and capital accounts.
This recent boom has been largely supported by developed economies integrating with majority world through foreign direct investment and lowering costs of doing business, the reduction of trade barriers, and in many cases cross border migration
While globalization has radically increased incomes and economic growth in developing countries and lowered consumer prices in developed countries, it also changes the power balance between developing and developed countries and affects the culture of each affected country.
And the shifting location of goods production has caused many jobs to cross borders, requiring some workers in developed countries to change careers.
Click on any of the following blue hyperlinks for more about Economic Globalization:
United States Federal Budget
YouTube Video: New forecast predicts trillion-dollar deficits by CNN
Pictured below:
TOP: Congressional Budget Office's Baseline Budget Projection
CENTER: Federal Government Outlays as Percentage
BOTTOM: Total Deficits or Surpluses
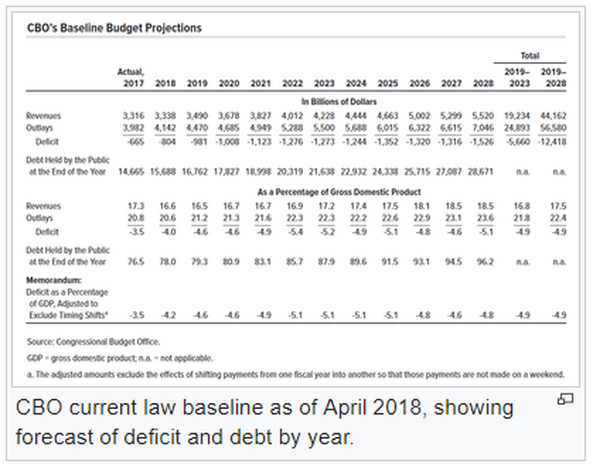
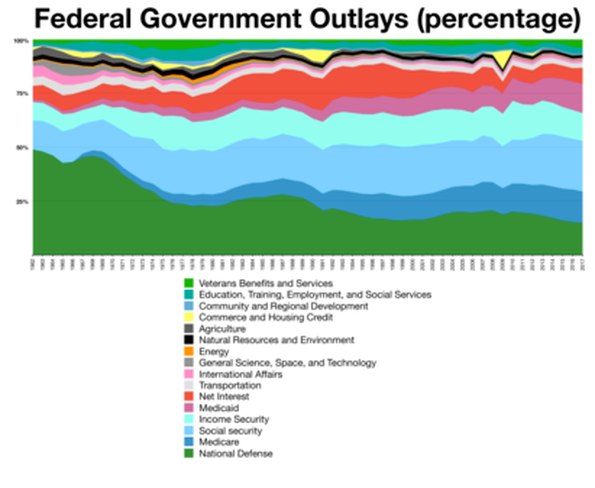
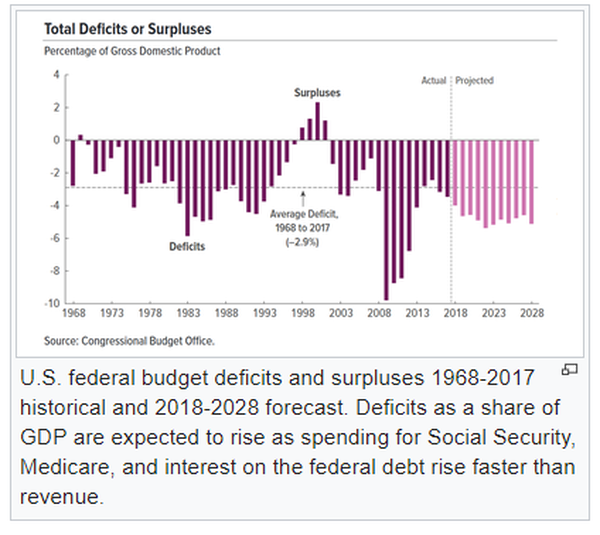
The recent Republican tax cuts and the bipartisan agreement to raise federal spending have done a number on already high budget deficits. CNN's Victor Blackwell explains how the outlook could be even worse than previously thought.
Overview:
The budget document often begins with the President's proposal to Congress recommending funding levels for the next fiscal year, beginning October 1 and ending on September 30 of the year following. The fiscal year refers to the year in which it ends.
However, Congress is the body required by law to pass appropriations annually and to submit funding bills passed by both houses to the President for signature. Congressional decisions are governed by rules and legislation regarding the federal budget process. Budget committees set spending limits for the House and Senate committees and for Appropriations subcommittees, which then approve individual appropriations bills to allocate funding to various federal programs.
If Congress fails to pass an annual budget, then several appropriations bills must be passed as "stop gap" measures. After Congress approves an appropriations bill, it is then sent to the President, who may either sign it into law or veto it. A vetoed bill is sent back to Congress, which can pass it into law with a two-thirds majority in each legislative chamber. Congress may also combine all or some appropriations bills into one omnibus reconciliation bill. In addition, the president may request and the Congress may pass supplemental appropriations bills or emergency supplemental appropriations bills.
Several government agencies provide budget data and analysis. These include the Government Accountability Office (GAO), the Congressional Budget Office (CBO), the Office of Management and Budget (OMB), and the Treasury Department. These agencies have reported that the federal government is facing many important long-run financing challenges, primarily driven by an aging population, rising interest payments, and spending for healthcare programs like Medicare and Medicaid.
During FY2017, the federal government spent $3.98 trillion on a budget or cash basis, up $128 billion or 3.3% vs. FY2016 spending of $3.85 trillion. Major categories of FY 2017 spending included:
Also during FY2017, the federal government collected approximately $3.32 trillion in tax revenue, up $48 billion or 1.5% versus FY2016. Primary receipt categories included individual income taxes ($1,587B or 48% of total receipts), Social Security/Social Insurance taxes ($1,162B or 35%), and corporate taxes ($297B or 9%).
Other revenue types included excise, estate and gift taxes. FY 2017 revenues were 17.3% of gross domestic product (GDP), versus 17.7% in FY 2016. Tax revenues averaged approximately 17.4% GDP over the 1980-2017 period.
The federal budget deficit (i.e., expenses greater than revenues) was $665 billion in FY2017, versus $585 billion in 2016, an increase of $80 billion or 14%. The budget deficit was 3.5% GDP in 2017, versus 3.2% GDP also in 2016. The budget deficit is forecast to rise to $804 billion in FY2018, due significantly to the Tax Cuts and Jobs Act and other spending bills.
President Trump signed the Tax Cuts and Jobs Act into law in December 2017. CBO forecasts that the 2017 Tax Act will increase the sum of budget deficits (debt) by $2.289 trillion over the 2018-2027 decade, or $1.891 trillion after macro-economic feedback. This is in addition to the $10.1 trillion increase forecast under the current policy baseline and existing $20 trillion national debt
Click on any of the following blue hyperlinks for further amplification on the United States Federal Budget:
Overview:
The budget document often begins with the President's proposal to Congress recommending funding levels for the next fiscal year, beginning October 1 and ending on September 30 of the year following. The fiscal year refers to the year in which it ends.
However, Congress is the body required by law to pass appropriations annually and to submit funding bills passed by both houses to the President for signature. Congressional decisions are governed by rules and legislation regarding the federal budget process. Budget committees set spending limits for the House and Senate committees and for Appropriations subcommittees, which then approve individual appropriations bills to allocate funding to various federal programs.
If Congress fails to pass an annual budget, then several appropriations bills must be passed as "stop gap" measures. After Congress approves an appropriations bill, it is then sent to the President, who may either sign it into law or veto it. A vetoed bill is sent back to Congress, which can pass it into law with a two-thirds majority in each legislative chamber. Congress may also combine all or some appropriations bills into one omnibus reconciliation bill. In addition, the president may request and the Congress may pass supplemental appropriations bills or emergency supplemental appropriations bills.
Several government agencies provide budget data and analysis. These include the Government Accountability Office (GAO), the Congressional Budget Office (CBO), the Office of Management and Budget (OMB), and the Treasury Department. These agencies have reported that the federal government is facing many important long-run financing challenges, primarily driven by an aging population, rising interest payments, and spending for healthcare programs like Medicare and Medicaid.
During FY2017, the federal government spent $3.98 trillion on a budget or cash basis, up $128 billion or 3.3% vs. FY2016 spending of $3.85 trillion. Major categories of FY 2017 spending included:
- Healthcare ($1,077B or 27% of spending),
- Social Security ($939B or 24%),
- non-defense discretionary spending used to run federal Departments and Agencies ($610B or 15%),
- the Defense Department ($590B or 15%),
- and interest ($263B or 7%).
Also during FY2017, the federal government collected approximately $3.32 trillion in tax revenue, up $48 billion or 1.5% versus FY2016. Primary receipt categories included individual income taxes ($1,587B or 48% of total receipts), Social Security/Social Insurance taxes ($1,162B or 35%), and corporate taxes ($297B or 9%).
Other revenue types included excise, estate and gift taxes. FY 2017 revenues were 17.3% of gross domestic product (GDP), versus 17.7% in FY 2016. Tax revenues averaged approximately 17.4% GDP over the 1980-2017 period.
The federal budget deficit (i.e., expenses greater than revenues) was $665 billion in FY2017, versus $585 billion in 2016, an increase of $80 billion or 14%. The budget deficit was 3.5% GDP in 2017, versus 3.2% GDP also in 2016. The budget deficit is forecast to rise to $804 billion in FY2018, due significantly to the Tax Cuts and Jobs Act and other spending bills.
President Trump signed the Tax Cuts and Jobs Act into law in December 2017. CBO forecasts that the 2017 Tax Act will increase the sum of budget deficits (debt) by $2.289 trillion over the 2018-2027 decade, or $1.891 trillion after macro-economic feedback. This is in addition to the $10.1 trillion increase forecast under the current policy baseline and existing $20 trillion national debt
Click on any of the following blue hyperlinks for further amplification on the United States Federal Budget:
- Budget principles
- Major receipt categories
- Major expenditure categories
- Understanding deficits and debt
- CBO budget projections
- Contemporary issues and debates
- Public opinion polls
- Proposed deficit reduction
- Total outlays in recent budget submissions
- See also:
- Congressional Budget Office
- The Federal Budget from the White House, OMB
- Budget of the United States Government and various supplements from 1923 to the present.
- Federal Budget Receipts and Outlays from 1930 to the present.
- Federal Budgets of the United States Government from fiscal years 1996 to the present.
- Index to the narrative section of the United States Federal Budget for 2018 plus concordance
- Recent CBO documents:
- "Chart talk" examples: One of the best ways to understand the long-term budget risks is through helpful charts. The following sources contain charts and commentary:
- Budget games and simulations:
- United States public debt
- United States fiscal cliff
- 2011 U.S. debt ceiling crisis
- Starve the beast (policy)
- Government budget by country
- I.O.U.S.A., documentary film by Patrick Creadon
- Modern Monetary Theory
- Unemployment in the United States
- List of U.S. state budgets
- Continuing resolution
- Appropriations bill (United States)
Economic Ranking of Countries by: Gross Domestic Product (GDP) vs. by Purchasing Power Parity (PPP)
YouTube Video: Top 10 Richest Countries by GDP (PPP) per capita
Pictured: Economic Ranking of Countries (L) by GDP and (R) by PPP
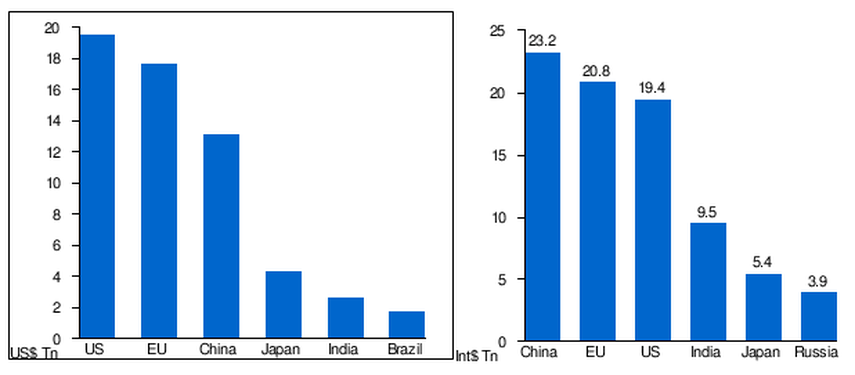
Click here for a List of Countries by Gross Domestic Product (GDP):
Gross domestic product (GDP) is the market value of all final goods and services from a nation in a given year. Countries are sorted by nominal GDP estimates from financial and statistical institutions, which are calculated at market or government official exchange rates.
Nominal GDP does not take into account differences in the cost of living in different countries, and the results can vary greatly from one year to another based on fluctuations in the exchange rates of the country's currency. Such fluctuations may change a country's ranking from one year to the next, even though they often make little or no difference in the standard of living of its population.
Comparisons of national wealth are also frequently made on the basis of purchasing power parity (PPP), to adjust for differences in the cost of living in different countries. PPP largely removes the exchange rate problem, but has its own drawbacks; it does not reflect the value of economic output in international trade, and it also requires more estimation than nominal GDP. On the whole, PPP per capita figures are less spread than nominal GDP per capita figures.
The United States is the world's largest economy with a GDP of approximately $18.56 trillion, notably due to high average incomes, a large population, capital investment, moderate unemployment, high consumer spending, a relatively young population, and technological innovation.
Tuvalu is the world's smallest national economy with a GDP of about $32 million because of its very small population, a lack of natural resources, reliance on foreign aid, negligible capital investment, demographic problems, and low average incomes.
Although the rankings of national economies have changed considerably over time, the United States has maintained its top position since the Gilded Age, a time period in which its economy saw rapid expansion, surpassing the British Empire and Qing dynasty in aggregate output.
Since China's transition to a market-based economy through privatization and deregulation, the country has seen its ranking increase from ninth in 1978 to second to only the United States in 2016 as economic growth accelerated and its share of global nominal GDP surged from 2% in 1980 to 15% in 2016.
India has also experienced a similar economic boom since the implementation of neoliberal reforms in the early 1990s.
When supranational entities are included, the European Union is the second largest economy in the world. It was the largest from 2004, when ten countries joined the union, to 2014, after which it was surpassed by the United States.
The first list largely includes data compiled by the International Monetary Fund's World Economic Outlook for 2016, the second list shows the World Bank's 2016 estimates, and the third list includes data compiled by the United Nations Statistics Division for 2015.
Several economies which are not considered to be countries (the world, the European Union, and some dependent territories) are included in the lists because they appear in the sources as distinct economies. These economies are italicized and not ranked in the charts, but are listed where applicable.
___________________________________________________________________________
Click here for a List of Countries by their estimated forecast of gross domestic product based on purchasing power parity, abbreviated GDP (PPP):
Countries are sorted by GDP PPP forecast estimates from financial and statistical institutions in the limited period January-April 2017, which are calculated at market or government official exchange rates. The data given on this page are based on the international dollar, a standardized unit used by economists.
GDP comparisons using PPP are arguably more useful than those using nominal GDP when assessing a nation's domestic market because PPP takes into account the relative cost of local goods, services and inflation rates of the country, rather than using international market exchange rates which may distort the real differences in per capita income.
It is however limited when measuring financial flows between countries. PPP is often used to gauge global poverty thresholds and is used by the United Nations in constructing the human development index. These surveys such as the International Comparison Program include both tradable and non-tradable goods in an attempt to estimate a representative basket of all goods.
The first table includes estimates for the year 2017 for all current 191 International Monetary Fund (IMF) members as well as Hong Kong and Taiwan (the official list says "Taiwan, Province of China").
Data are in millions of international dollars; they were calculated by the IMF. Figures were published in April 2017.
The second table includes data, mostly for the year 2015, for 180 of the 193 current United Nations member states as well as Hong Kong and Macau (the two Chinese Special Administrative Regions). Data are in billions of international dollars; they were compiled by the World Bank.
The third table is a tabulation of the CIA World Factbook Gross Domestic Product (GDP) (Purchasing Power Parity) data update of 2016. The data for GDP at purchasing power parity have also been rebased using the new International Comparison Program price surveys and extrapolated to 2007.
Click on any of the following blue hyperlinks for more about The List of Countries by GDP/PPP:
- List of countries by GDP (nominal) per capita
- List of countries by GDP (PPP) per capita
- List of IMF ranked countries by GDP, IMF ranked GDP (nominal), GDP (nominal) per capita, GDP (PPP), GDP (PPP) per capita, Population, and PPP
- List of IMF ranked countries by past and projected GDP (PPP)
- List of countries by real GDP growth rate
- List of countries by Human Development Index
- List of countries by income equality
- List of countries by distribution of wealth
- Lists of countries by GDP
- National wealth
Supply and Demand, including the Impact of Covid-19 on Supply and Demand
TOP: COVID-19 is hurting many industries and workers, but could it help trade and logistics? (Brookings)
BOTTOM: The shelves may be empty at some grocery stores nationwide right now, but the shortage won’t last forever as toilet paper and other household goods make their way through the supply chain. (Forbes)
- YouTube Video: Understanding the Economic Shock of the Covid-19 Crisis (Harvard Review)
- YouTube Video: Here's how coronavirus can affect global supply and demand (MIT)
- YouTube Video: What coronavirus means for the global economy | Ray Dalio (Ted)
TOP: COVID-19 is hurting many industries and workers, but could it help trade and logistics? (Brookings)
BOTTOM: The shelves may be empty at some grocery stores nationwide right now, but the shortage won’t last forever as toilet paper and other household goods make their way through the supply chain. (Forbes)
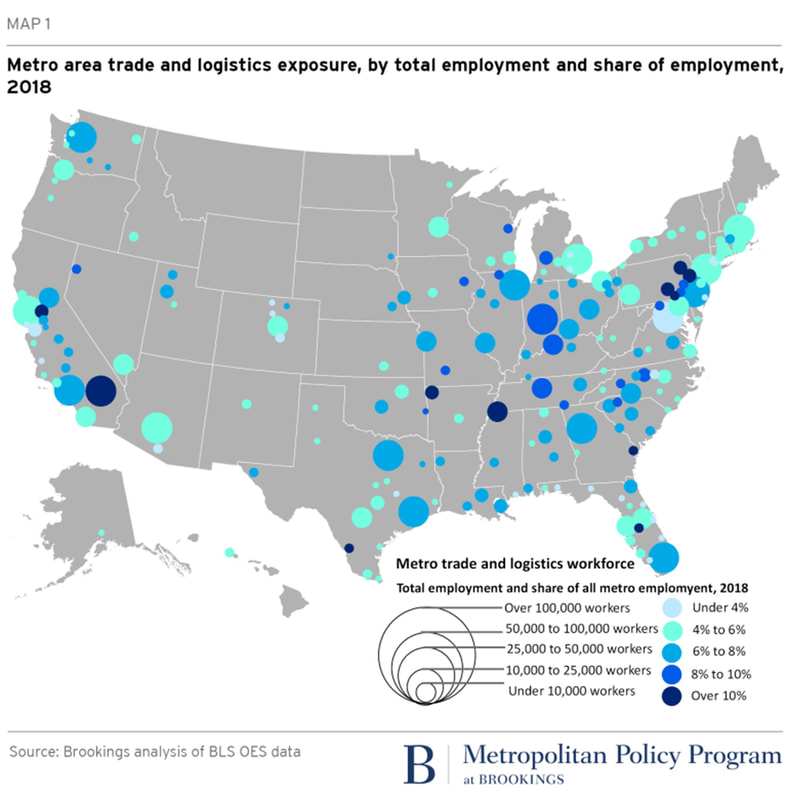

[Your Webhost: while typically including the economic impact of Covid-19 (bottom topic) might not apply to this opening topic ("Supply and Demand"), in fact, Covid-19 has weighed heavily against all countries in terms of both economic consequences and loss of life!]
Supply and Demand:
In microeconomics, supply and demand is an economic model of price determination in a market. It postulates that, holding all else equal, in a competitive market, the unit price for a particular good, or other traded item such as labor or liquid financial assets, will vary until it settles at a point where the quantity demanded (at the current price) will equal the quantity supplied (at the current price), resulting in an economic equilibrium for price and quantity transacted.
Click on any of the following blue hyperlinks for more about Supply and Demand:
Shortages related to the COVID-19 pandemic
Medical materials and other goods shortages caused by the COVID-19 pandemic quickly became a major issue of the pandemic. The matter of pandemic-related shortage has been studied in the past and has been documented in recent events.
On the medical side, shortages of personal protective equipment such as medical masks, gloves, face shields, sanitizing products, are also joined by potential shortage of more advanced devices such as hospital beds, Intensive care unit (ICU) beds, oxygen therapy, ventilators and ECMO (Extracorporeal membrane oxygenation) devices.
Human resources, especially in terms of medical staff, may be drained by the overwhelming extent of the epidemic and associated workload, together with losses by contamination, isolation, sickness or mortality among health care workers. Territories are differently equipped to face the pandemic.
Various emergency measures have been taken to ramp up equipment levels such as purchases, while calls for donations, local 3D makers, volunteer staffing, mandatory draft, or seizure of stocks and factory lines have also occurred.
Bidding wars between different countries and states over these items are reported to be a major issue, with price increases, orders seized by local government, or cancelled by selling company to be redirected to higher bidder. In some cases, medical workers have been ordered to not speak about these shortages of resources.
While public health advocates and officials have encouraged to flatten the curve by social distancing, the unmitigated ICU needs would be about 50 times the available ICU beds and ventilators capacity of most developed countries. There have also been calls to increase healthcare capacity despite shortages.
Background:
Long term and structural:
See also: Pandemic predictions and preparations prior to COVID-19
Following warnings and increased preparedness in the 2000s, the 2009 swine flu pandemic led to rapid anti-pandemic reactions among Western countries.
The H1N1/09 virus strain, with mild symptoms and low lethality, eventually led to a backlash over public sector over-reactiveness, spending, and the high cost/benefit of the 2009 flu vaccine.
In the following years, national strategic stockpiles of medical equipment were not systematically renewed. In France, a €382 million spending for H1N1 vaccines and masks was widely criticized. French health authorities decided in 2011 to not replace their stocks, to reduce acquisitions and storage costs, to rely more on supplies from China and just-in-time logistics, and to distribute the responsibility to private companies on an optional basis.
In 2013, in order to save cost, a law moved responsibility for personal protective equipment (PPE) stockpiles from the French government to public and private enterprises, which had to plan the security of their workers, without any verification mechanisms in place.
National manufacturers could not compete with Chinese manufacturers' prices on this new open market. The former strategic masks producer closed in 2018 while the French strategic stockpile dropped in this period from one billion surgical masks and 600 million FFP2 masks in 2010 to 150 million and zero, respectively, in early 2020.
France has been called a case study of Juan Branco, author of a critical book on French President Emmanuel Macron's rise to power, argued that selfish quest of power and loyalty in leadership led young and unexperienced people to be in charge of nation-wide health care reforms via blind accounting analysis and management.
France has been cited as a case study for countries now considering a U-turn over the past two decades of globalization of health supplies to gain lower immediate costs. The same approach was taken in the United States. The U.S. Strategic National Stockpile's stock of masks used against the 2009 flu pandemic was not replenished, neither by the Obama administration nor by the Trump administration.
American masks manufacturer Mike Bowen of Prestige Ameritech had been warning for years that the USA mask supply chain was too dependent on China. As Juan Branco for France, Former US President Obama denounced short-term individualistic mindset as negatively affecting public decision making and preparedness.
According to a report in the New York Times, Russian agents spent decades promoting debunked public health scares to increase mistrust toward the Federal government of the United States and its officials at home and abroad, but also to damage American science, a foundation of US national prosperity. These efforts have been linked to lower support for public health programs, anti-vaccines scares and illnesses spread, and weaker global pandemic preparedness prior to the 2020 pandemic.
Several public (World Health Organization (WHO), World Bank, Global Preparedness Monitoring Board) and private initiatives raised awareness about pandemic threats and needs for better preparedness.
Since 2015, Bill Gates has been warning about needing to prepare for a global pandemic. International divisions and lack of suitable collaboration limited preparedness. WHO's pandemic influenza preparedness project had a US$39 million two-year budget, out of WHO's 2020–2021 budget of US$4.8 billion. While WHO gives recommendations, there is no sustained mechanism to review countries' preparedness for epidemics and their rapid response abilities.
According to international economist Roland Rajah, while there are guidelines, local action depends on local governance. Andy Xie, writing in the South China Morning Post, argued that ruling elites, obsessed with economic metrics, failed to prepare their communities against well-known pandemic risks.
Tax systems in the early twenty-first century, by favoring the largest corporations with anti-competitive practices and lower investment rates into innovation and productions, favored corporate actors and corporate profits, increasing the risk of shortages and weakening the society ability to respond to a pandemic.
Early outbreaks in Hubei, Italy, and Spain showed that several wealthy countries' health care systems were overwhelmed. In developing countries with weaker medical infrastructure, oxygen therapy, equipment for intensive care bed and other medical needs, shortages were expected to occur earlier.
Tests:
See also: COVID-19 testing
Testing shortage is a key element preventing authorities from measuring the true extent of current epidemic spread. Germany and Korea's anticipative and aggressive testing strategies has helped to reduce the measured fatality rate. Germany started producing and stockpiling COVID-19 tests as soon as January 2020.
Diagnostic tests:
Reagents:
In Ireland and the UK, in late March and early April, reagent shortages limited the number of tests. By March, insufficient amounts of reagent became a bottleneck for mass testing in the European Union (EU), United Kingdom (UK) and the United States (US).
This has led some authors to explore sample preparation protocols that involve heating samples at 98 °C (208 °F) for 5 minutes to release RNA genomes for further testing.
In UK, on 1 April, the UK government confirmed that a total of 2,000 NHS staff had been tested for coronavirus since the outbreak began, but Cabinet Office Minister Michael Gove said a shortage of chemicals needed for the test meant it was not possible to screen the NHS's 1.2 million workforce.
Gove's statement was contradicted by the Chemical Industries Association, which said there was not a shortage of the relevant chemicals and that at a meeting with a business minister the week before the government had not tried to find out about potential supply problems.
There were also reagent shortages in the United States. Some hospitals manufactured their own reagents from publicly-available recipes.
Swabs:
A feared shortage of swabs in Iceland was averted when stocks were found to bridge the gap until more arrived from China. There were no swabs in the US Strategic National Stockpile, and the US had shortages, despite the one pre-pandemic domestic manufacturer increasing production to 1 million swabs per day in March, and government funding for it to build a new factory in May. Shortages also arose in the UK, but were resolved by 2 April.
In-house manufacturing:
The US FDA licensed a swab-free saliva test and more new swab designs, including 3-D printed versions which are now being manufactured in the labs, hospitals, and other medical facilities using the swabs.
In the US, general-use nasal swabs are Class I medical devices, and are not approved by the FDA. The NIH said that they should follow FDA labelling requirements, be made in a facility registered and listed with the FDA, and pass a publicly-available safety testing protocol.
The material must also be safe; an already-approved autoclavable surgical-grade plastic can be used. The full development process can take as little as two weeks. 3-D-printed swabs increased the demand for suitable 3-D printers.
Some 3-D-printed swab designs are publicly-licensed under Creative Commons licenses, and others are patented, but with the 3-D printing files freely available on request to permitted facilities during the epidemic.
Personal protective equipment:
Generalities:
Although the vast majority of PPE is produced in China, domestic supplies were insufficient. The Chinese government took control of stocks from foreign enterprises whose factories produced these goods. Medicon, whose three factories produced such supplies in China, saw their stocks seized by the Communist Party-led government.
Figures from China Customs show that some 2.46 billion pieces of epidemic prevention and control materials had been imported between 24 January and 29 February, including 2.02 billion masks and 25.38 million items of protective clothing valued at 8.2 billion yuan ($1 billion).
The Press reported that the China Poly Group, together with other Chinese companies and state-owned enterprises, had an important role in scouring markets abroad to procure essential medical supplies and equipment for China. Risland (formerly Country Garden) sourced 82 tons of supplies, which were subsequently airlifted to Wuhan.
Greenland Holdings also sourced bulk supplies of medical consumables such as surgical masks, thermometers, antibacterial wipes, hand sanitisers, gloves and paracetamol for shipping to China. The mass procurement of supplies at wholesale and retail levels by Chinese companies to help their compatriots back home have contributed to shortages of products in western countries where these Chinese companies operate. On 24 March the Australian Prime Minister Scott Morrison announced restrictions on such activities.
Given that the global supply of PPE is insufficient, and following these Chinese measures, the World Health Organization (WHO) recommended in February 2020 minimizing the need for PPE through telemedicine; physical barriers, such as:
Quality issues exacerbating shortages:
In late-March/early-April 2020, as Western countries were in turn dependent on China for supplies of masks and other equipment, European politicians e.g. the EU chief diplomat Josep Borrell accused China of a soft-power play to influence world opinion.
Also, some of the supplies sent to Spain, Turkey, and the Netherlands were rejected as being faulty. Dutch health ministry issued a recall of 600,000 face masks from a Chinese supplier on 21 March that did not fit properly and whose filters did not work as intended despite them having a quality certificate.
The Spanish government discovered that 60,000 out of 340,000 test kits from a Chinese manufacturer did not accurately test for COVID-19. The Chinese Ministry of Foreign Affairs responded that the customer should "double-check the instructions to make sure that you ordered, paid for and distributed the right ones. Do not use non-surgical masks for surgical purposes".
In mid-May, the European Commission suspended an order of 10 million Chinese masks destined for member states and the UK after two countries reported having received sub-standard products. The masks had been ordered by the EU's executive arm and was set to be distributed in six weekly instalments.
After a first batch of 1.5 million masks was distributed to 17 of the 27 member states and Britain, Poland said the 600,000 items they received did not have European certificates nor did they comply with the necessary standard. Commission health spokesman Stefan De Keersmaecker vowed to investigate and take the necessary action.
By April 2020, studies revealed that a significant percentage of those with coronavirus were asymptomatic, allowing the virus to spread undetected. Therefore, the CDC recommended "wearing cloth face coverings in public settings where other social distancing measures are difficult to maintain".
Sanitizing products:
Hand sanitizer went out of stock in many areas, causing price gouging. In response, brewers and distillers began to produce hand sanitizer.
Protective gear:
In the United States, shortages were such that some nurses at one New York City hospital resorted to wearing garbage bags as an alternative to unavailable protective clothing.
In light of the shortages of traditional protective gear, small businesses throughout the United States have been retooling to produce makeshift protective devices, often created through open source design initiatives in which manufacturers donate the gear to hospitals.
An example is the COVID-19 Intubation Safety Box, first used by hospitals in Taiwan, which is an acrylic cube placed over an infected patient's torso, with openings that allow ventilator intubation and extubation while minimizing contaminated droplet risk to healthcare workers.
CNBC reported that E-commerce platform Amazon banned sales of N95 face masks in the name of price gouging; the shortages of N95 protective gear became even more serious. Amazon Third party Golden Tree Supply turn to Canadian E-commerce platform Shopify to keep on supplying N95 face masks to the people of United States.
In March, The Doctors' Association UK alleged that shortages were covered-up through intimidating emails, threats of disciplinary action and in two cases being sent home from work.
Some doctors were disciplined after managers were annoyed by material they had posted online regarding shortages of surgical masks, goggles, visors and especially gowns in many British National Health Service hospitals.
On 18 April, the communities secretary, Robert Jenrick, reported that 400,000 protective gowns and other PPE were on their way to the U.K. from Turkey. One day later, these were delayed; this led hospital leaders to directly criticise the government for the first time during the pandemic.
The shipment arrived at Istanbul airport en route to the U.K. two days after ministers said that the PPE would appear in the country. Only 32,000 of the order arrived (less than one-tenth), despite the NHS making a down payment to secure its arrival on 22 April. Eventually, these all had to be returned to Turkey as they did not meet NHS standards.
In July, U.S. Customs and Border Protection (CBP) banned products by the Malaysia-based Top Glove and its subsidiary TG Medical due to alleged violations of workers' rights including "debt bondage, excessive overtime, retention of identification documents, and abusive working and living conditions." Most of the world's glove supply comes from Malaysia.
Facial masks:
See also:
Early epidemic in China:
As the epidemic accelerated, the mainland market saw a shortage of face masks due to increased public demand. In Shanghai, customers had to queue for nearly an hour to buy a pack of face masks; stocks were sold out in another half an hour.
Hoarding and price gouging drove up prices, so the market regulator said it would crack down on such acts. In January 2020, price controls were imposed on all face masks on Taobao and Tmall.
Other Chinese e-commerce platform – JD.com, Suning.com, Pinduoduo – did likewise; third-party vendors would be subject to price caps, with violators subject to sanctions.
National stocks and shortages:
In 2006, 156 million masks were added to the U.S. Strategic National Stockpile in anticipation of a flu pandemic. After they were used against the 2009 flu pandemic, neither the Obama administration nor the Trump administration renewed the stocks. By 1 April, U.S.'s Strategic National Stockpile was nearly emptied.
In France, 2009 H1N1-related spending rose to €382 million, mainly on supplies and vaccines, which was later criticized. It was decided in 2011 to not replete its stocks and rely more on supply from China and just-in-time logistics. In 2010, its stock included 1 billion surgical masks and 600 million FFP2 masks; in early 2020 it was 150 million and zero, respectively.
While stocks were progressively reduced, a 2013 rational stated the aim to reduce costs of acquisition and storage, now distributing this effort to all private enterprises as an optional best practice to ensure their workers' protection. This was especially relevant to FFP2 masks, more costly to acquire and store.
As the COVID-19 pandemic in France took an increasing toll on medical supplies, masks and PPE supplies ran low and caused national outrage. France needs 40 million masks per week, according to French president Emmanuel Macron. France instructed its few remaining mask-producing factories to work 24/7 shifts, and to ramp up national production to 40 million masks per month. French lawmakers have opened an inquiry on the past management of these strategic stocks.
In the wake of the 2020 COVID-19 pandemic and widespread complaints by nurses and other health care workers about lack of N95 masks and proper protocols, National Nurses United, the largest organization of registered nurses in the United States, filed over 125 complaints with Occupational Safety and Health Administration (OSHA) offices in 16 states charging hospitals with failing to comply with laws mandating safe workplaces in which COVID-19 nurses should be provided N-95 masks.
The World Health Organization (WHO) called for industry and governments to increase manufacturing by 40% to meet global demands on 3 March 2020 and they also released a document on 6 April 2020 with recommendations for the rational use of PPE. This document was intended for those in the health care and community settings, including the handling of cargo.
This global PPE shortage issue soon became a subject of interest for the concerned public. Academics from the likes of Science Foundation Ireland researched how we can find a solution and avoid this shortage in the future. Simultaneously, independent initiatives and online platforms like [https://PPE Needed.com PPE Needed] were started to provide an immediate solution. UNICEF has also taken steppes to mitigate this current risk and anticipate near-term effects of COVID-19 as well as the access to PPE suppliers.
Competition for supplies:
Countries such as Britain, France, Germany, South Korea, Taiwan, China, India, and others initially responded to the outbreak by limiting or banning exports of medical supplies to protect their citizens, including rescinding orders that other nations already secured.
Germany blocked exports of 240,000 masks bound for Switzerland and also stopped similar shipments to the Central Bohemian Region as well. One French company, Valmy SAS, was forced to block an order for PPE to be sent to the UK, after the company's UK representative told CNN that the order had been blocked by customs officials at the French coast.
Turkey blocked a shipment of ventilators bought by two regional Spanish governments from a Turkish company, citing the risk of a shortage at home in holding onto the ventilators; 116 of the ventilators were later released.
As the pandemic began to worsen, governments began employing strong-arm tactics including even surreptitious means to obtain medical supplies necessary to fight the coronavirus, either through paying more cash to reroute or seizing such equipment.
Slovakian prime minister Peter Pellegrini said the government was preparing cash worth 1.2 million euros ($1.3 million) to purchase masks from a contracted Chinese supplier. He then said "However, a dealer from Germany came there first, paid more for the shipment, and bought it."
Ukraine lawmaker Andriy Motovylovets also stated that "Our consuls who go to factories find their colleagues from other countries (Russia, USA, France, Germany, Italy, etc) who are trying to obtain our orders. We have paid upfront by wire transfer and have signed contracts.
But they have more money, in cash. We have to fight for each shipment." San Marino authorities said they arranged a bank transfer to a supplier in Lugano, Switzerland, to pay for a half-million masks to be shared with Italian neighbous. However, the truck came in empty, because one or several unidentified foreign buyers offered more instead.
Germany snatched 830,000 surgical masks that were arriving from China and destined for Italy. Although Italian authorities managed to persuade Germany to release them, no one in Germany, however, found the masks they seized at all. 1.5 million face masks that were supposed to be delivered from Spain to Slovenia were seized by German agents.
French guards confiscated lorries filled with 130,000 face masks and boxes of sanitisers bound for the UK in what was described as a "despicable act" by the British government.
Italian customs police hijacked some 800,000 imported masks and disposable gloves that were about to be sent to Switzerland.
On 22 March, an Italian newspaper said that the 680,000 face masks and ventilators it ordered from China were confiscated by the Czech Republic's police. They carried out an anti-trafficking operation in which they seized equipment from a warehouse of a private company in northern town of Lovosice.
According to Czech authorities, the donation from China represented only just over 100,000 masks. Czech government sent 110,000 items to Italy as compensation. It's unclear how the masks ended up in Lovosice. Czech Foreign Minister Tomáš Petříček told AFP: "Lovosice is not quite en route from China to Italy."
Valérie Pécresse, regional counselor of Île-de-France, alleged that some Americans, in their aggressive search for stocks, had made tarmac bids for stocks of masks – sight unseen – awaiting loading onto transporters, paying 3 times the price in cash.
However, Politico Europe reported the French claim as "unsubstantiated" and the U.S. Embassy in Paris stated that "The United States government has not purchased any masks intended for delivery from China to France. Reports to the contrary are completely false."
On 3 April, Berlin politician Andreas Geisel accused U.S. agents of appropriating a shipment of 200,000 3M-made face masks meant for Berlin police from the airport in Bangkok. However, these claims were proven false, as 3M revealed it "has no records of an order for respiratory masks from China for the Berlin police" and Berlin police later confirmed that the shipment was not seized by U.S. authorities, but was said to have simply been bought at a better price, widely believed to be from a German dealer or China.
This revelation outraged the Berlin opposition, whose CDU parliamentary group leader Burkard Dregger accused Geisel of "deliberately misleading Berliners" in order "to cover up its own inability to obtain protective equipment". FDP interior expert Marcel Luthe said "Big names in international politics like Berlin's senator Geisel are blaming others and telling US piracy to serve anti-American clichés."
Politico Europe reported that "the Berliners are taking a page straight out of the Trump playbook and not letting facts get in the way of a good story." The Guardian also reported that "There is no solid proof Trump [nor any other American official] approved the [German] heist".
On 3 April, Jared Moskowitz, head of Florida Division of Emergency Management, accused the American company 3M of selling N95 masks directly to foreign countries for cash instead of the United States.
Moskowitz stated that 3M agreed to authorise distributors and brokers to represent they were selling the masks to Florida, but instead his team for the last several weeks "get to warehouses that are completely empty." He then said the 3M authorized U.S. distributors later told him the masks Florida contracted for never showed up because the company instead prioritized orders that come in later, for higher prices, from foreign countries (including Germany, Russia, and France).
As a result, Moskowitz highlighted the issue on Twitter, saying he decided to "troll" 3M. Forbes reported that "roughly 280 million masks from warehouses around the U.S. had been purchased by foreign buyers [on 30 March 2020] and were earmarked to leave the country, according to the broker – and that was in one day", causing massive critical shortages of masks in the U.S.
Using the Defense Production Act, the Trump administration ordered 3M to stop selling US-produced masks to Canada and Latin America, a move the company said would cause "significant humanitarian implications" and could cause those countries to retaliate, resulting in a net decrease of supplies in the US.
On 3 April, the Swedish health care company Mölnlycke announced that France had seized millions of face masks and gloves that the company imported from China to Spain and Italy. The company's general manager, Richard Twomey, denounced France for "confiscat[ing] masks and gloves even though it was not [its] own. This is an extremely disturbing, unbecoming act." Mölnlycke estimated a total of "six million masks was seized by the French.
All had been contracted for, including a million masks each for France, Italy and Spain. The rest were destined for Belgium, the Netherlands, Portugal and Switzerland, which has special trading status with the EU." Sweden's foreign ministry stated to Agence France-Presse that "We expect France to promptly cease the requisition of medical equipment and do what it can to ensure that supply chains and the transportation of goods are secured. The common market has to function, particularly in times of crisis."
On 24 April, San Francisco Mayor London Breed complained that her city's orders for PPE were diverted to other cities and countries. She said "We’ve had issues of our orders being relocated by our suppliers in China. For example, we had isolation gowns on their way to San Francisco and they were diverted to France. We’ve had situations when things we’ve ordered that have gone through Customs were confiscated by FEMA to be diverted to other locations."
Trade in medical supplies between the United States and China has also become politically complicated. Exports of face masks and other medical equipment to China from the United States (and many other countries) spiked in February, according to statistics from Trade Data Monitor, prompting criticism from the Washington Post that the United States government failed to anticipate the domestic needs for that equipment.
Similarly, The Wall Street Journal, citing Trade Data Monitor to show that China is the leading source of many key medical supplies, raised concerns that US tariffs on imports from China threaten imports of medical supplies into the United States.
Reuse of Masks:
Shortage in single-use medical mask and field reports of reuse lead to the question of which process could properly sanitize these PPE without altering their filtering capacity.
FFP2 masks can be sanitized by 70 °C vapor allowing reuses. Use of alcohol is discouraged since it alters N95 mask microfibers' static charge which helps filtration. Chlorine is also discouraged since its fumes may be harmful. Authors are warning against reuses by non-professionals, pointing out that even the best scored methods can degrade the mask if not performed properly.
A Singaporean study found no contamination on mask after brief care to COVID-19 patients, suggesting masks could be reused for multiple patients cares. A portion of SARS-CoV-2 virus can survive long exposure to 60 °C.
Makers have designed Arduino-controlled disinfection boxes, with temperature controls, to safely reuse surgical and N95 masks.
Gas disinfection allows 10 reuse.
DIY masks:
Following N95 masks shortages, volunteers created 3D printed "NanoHack" alternative. This printed mask allows to use hand-cut surgical mask as fine-particle filters.
Given the scarcity of masks and ambiguity on their efficiency, individuals and volunteers have started to produce cloth masks for themselves or for others. Various designs are shared online to ease creation.
Medical face shield:
Reacting to shortage of face shield, volunteers from the maker community with 3D printing abilities initiated an effort to produce face-shields for hospital staff.
3D printer manufacturers:
At the early stage, a few 3D printer manufacturers published their designs.
On 14 March, Budmen Industries, a custom 3D printer maker in New York, created a face shield design and produced their first 50 shields with a plan to donate to the Onondaga County to use in a COVID-19 testing site.
The company published their design and it had more than 3,000 downloads within a week. By the end of the month, the company and its partner made 5,000 face shields with global requests for 260,000 units.
On 16 March, Prusa Research, a Czech 3D printer manufacturer, started working on a face shield design for medical use . The design was approved by the Czech Ministry of Health and went to a field test and a large scale production within 3 days.
The company published the design for people to make face shields to support local efforts. The design was downloaded in a large number by makers around the world. By the end of March, the company employed 500 employees to work on the 10,000 shields order. Their design was downloaded 40,000 times.
Local volunteers:
As the shortage of personal protective equipment in New York City hospitals got into a critical stage, volunteers started making face shields using the Budmen design on 20 March.
More efforts were started by various groups from hobbyists, academics, to experts. Many designs had been created and groups were formed to supply face shields to local hospitals.
On 24 March, while the epidemic was expanding, popular French 3D maker and YouTuber Heliox announced on 24 March that she would produce face shields for free, building upon another maker's design. She was quickly contacted by local hospitals, health centers and other medical professionals asking for rapid delivery of face shields. The visible popularity of her initiative caused other 3D makers to join the effort and offer their help in other regions to connect health facilities with nearby makers.
On 30 March, The New York Times published a video on COVID-19-related shortages and healthcare workers' DIY solutions.
Government agencies:
On 23 March 2020, United States Food and Drug Administration (FDA), United States Department of Veterans Affairs (VA), and National Institutes of Health (NIH) entered into a memorandum of understanding to form a public-private partnership with America Makes, a non-profit organization, to test designs of 3D printed personal protective equipment including face shields.
The agreement was to have NIH to provide the 3D Print Exchange system to solicit open designs, VA to perform testing in clinical settings, FDA to participate in the review process and America Makes to coordinate with makers to produce the approved designs for healthcare facilities. As of 18 June 13 face shields have been reviewed as appropriate for clinical use.
On 9 April 2020, FDA issued an emergency use authorization that included an authorization for the use of face shields by health care personnel. FDA laid out the details of the conditions, and waiver of requirements for face shield makers in a letter on 13 April 2020.
Companies:
Apple Inc. announced on 5 April they would produce 1 million face shields per week to be sent to U.S. hospitals.
By mid April, many large companies such as Hewlett-Packard, Ford Motor Company, and Blue Origin had joined the efforts to make face shields. Even sports equipment manufacturers such as Bauer Hockey joined in and started making face shields for medical workers.
Medical care devices:
The availability of critical care beds or ICU beds, mechanical ventilation and ECMO devices generally closely associated with hospital beds has been described as a critical bottleneck in responding to the ongoing COVID-19 pandemic. The lack of such devices dramatically raises the mortality rate of COVID-19.
Oxygenation mask:
Popular snorkelling masks have been adapted into oxygen dispensing emergency respiratory masks via the usage of 3D printed adapters and minimal modifications to the original mask.
According to Italian laws relative to medical cares where the project has occurs, usage by the patient requires a signed declaration of acceptance of use of an uncertified biomedical device. The project provides the 3D files for free, as well as 2 forms to register hospitals in need and 3D makers willing to produces adapters.
In France, the main sportswear and snorkeling masks producer Decathlon has locked down its mask sales to redirect them toward medical staff, patients and 3D makers. An international collaboration including Decathlon, BIC, Stanford, and other actors is on track to scale up production for international needs.
Intensive care beds:
See also: List of countries by hospital beds
Both rich countries and developing countries have or will face intensive care beds shortages, but the situation is expected to be more intense in developing countries due to lower equipment levels.
In early March, the UK government supported a strategy to develop natural herd immunity, drawing sharp criticism from medical personnel and researchers. Various forecasts by Imperial College COVID-19 Response Team, made public on 16 March, suggested that the peak number of cases in the UK would require between 100 and 225 CCBs / 100,000 inhabitants, if proper mitigation or no mitigation strategies are put into force, respectively.
These requirements would both exceed the UK's current capacities of 6.6–14 CCB / 100,000 inhabitants. In the best case scenario, the peak caseload would require 7.5 times the current number of available ICU beds. Around 16 March, the UK government changed trajectory toward a more standard mitigation/suppression strategy.
In France, around 15 March, the Grand Est region was the first to express the scarcity of CCB limiting its handling of the crisis. Assistance-publique Hôpitaux de Paris (AP-HP), which manages most hospitals in the French capital area (~10 million inhabitants), reported the need for 3,000–4,000 ICUs. Current capacity is reported to be between 1500[ and 350, depending on the source.
In France, given shortages of ICU hospital beds in Grand Est and Ile-de-France regions, severe but stable patients with ARS and breathing assistance have been moved toward other regional medical centers within France, Germany, Austria, Luxembourg or Switzerland.
Mechanical ventilation:
Mechanical ventilation has been called "the device that becomes the decider between life and death" for COVID-19 patients because 3.2% of detected cases need ventilation during treatment. Ventilators shortage is endemic in the developing world.
In case of shortage, some triage strategies have been previously discussed. One strategy is to grade the patient on dimensions such as: prospects for short-term survival; prospects for long-term survival; stage of life-related considerations; pregnancy and fair chance. The frequent 15 to 20 day duration of the intubation to recover is an important factor in the ventilator's shortage.
An important way of reducing demand for ventilators is the use of CPAP devices as a first resort. For this reason CPAP devices themselves have become a scarce item.
Official assessments:
In the 2000s, the U.S. CDC estimated a national shortage of 40–70,000 ventilators in case of pandemic influenza. From this assessment resulted Project Aura, a public-private initiative to design a frugal, $3,000 mechanical ventilator, simple to mass-produce, and able to supply the Strategic National Stockpile.
Newport Medical Instruments was granted the contract, designing and prototyping (2011) the frugal ventilators to CDC officials, and expecting to later profit from the product by moving into the private market where competing devices were sold for $10,000.
In April 2012, US Health and Human Services officials confirmed to the US Congress that the project was on schedule to file for market approval in late 2013, after which the device would go into mass-production. In May 2012, US$12 billion medical conglomerate Covidien, a top actor of the mechanical ventilation market, acquired Newport for $100 million.
Covidien soon asked to cancel the Project Aura contract since it wasn't profitable enough. Former Newport executives, government officials and executives at rival ventilator companies suspect Covidien acquired Newport to prevent the frugal $3,000 ventilator design from disturbing its profitable ventilation operation.
Covidien merged in 2015 into Medtronic. Project Aura looked for and then signed a new contract with Philips healthcare. In July 2019, the FDA signed for 10,000 units of their Trilogy Evo portable ventilator, to be delivered to the SNS by mid-2020.
On 25 March 2020, Andrew Cuomo made a detailed 1-hour COVID-19 press conference, emphasizing an expectation of a severe shortage of ventilators, and their importance in sustaining life in severe COVID-19 cases.
Cuomo said New York state would ultimately need about 30,000 ventilators to handle the influx, while having only 4,000 as of 25 March; on the 27th, President Trump expressed doubt about the need, saying "I don't believe you need 40,000 or 30,000 ventilators," and resisted calls to force businesses to produce them.
Later on the 27th, the President acceded to calls to assist states in ventilator procurement, using the Defense Production Act, although fears remain that procurement will not happen in time to prevent severe shortages.
Industrial suppliers:
In Europe, the company Löwenstein Medical producing 1500 ICU-level ventilators and 20,000 home-level ventilator per year for France alone, pointed out of the current high demand and production shortage.
Based in Europe, all their components are European and not relying on the Chinese supply chain. As for production ramp-up, it was suggested to increase the production of home-level ventilators, more basic and which can be assembled in half an hour, yet able to support patients through acute respiratory distress syndrome.
The current bottleneck is mainly a question of qualified human resources. In business as usual, ICU-level ventilators are to be renewed every 10 to 15 years. Due to the coronavirus pandemic, Germany and other European countries have started to take control over the company's supply.
In China, local manufacturers are racing to answer the demand. Medtronic made ventilator design specifications publicly available but licensing questions remain unclarified.
Improvised ventilators:
See also: Open-source ventilator
In the United Kingdom, despite a lack of ventilators being previously identified in Exercise Cygnus, there was a shortage of them during COVID-19 with the government stockpiles proving to be insufficient.
In March, the British government called for industry to get involved with making ventilators for the NHS, with Dyson and Babcock revealing plans on creating 30,000 medical ventilators (this amount was seen as necessary based on modelling from the time from China).
The Ventilator Challenge involved companies such as Airbus, Rolls-Royce and Ford. This was seen as impractical at the time; the type of ventilators suggested by the government to these companies were crude and would not have been able to be used in hospitals, and none of the companies involved reached the final stages of testing and the majority have proved surplus to requirements in hindsight.
3D makers have been working on various low-cost alternative ventilation devices or adaptations.
Anesthetist Dr. Alan Gauthier from Ontario, Canada, turned one single-patient ventilator into a nine-patient device thanks to a 2006 YouTube video by 2 doctors from Detroit. The method uses T-shaped tubes to split airflow and multiply the number of patients provided with respiratory support.
In Ireland, volunteers started the Open Source Ventilator Project in collaboration with medical staff.
In Italy, a local journalist and journal director Nunzia Vallini of the Giornale di Brescia (Brescia Daily) was informed that nearby Chiani hospital was running out of valves which mix oxygen with air and are therefore a critical part of reanimation devices. The valves supplier was itself out of stock leading to patient deaths.
Vallini contacted FabLab founder Massimo Temporelli, which invited Michele Faini, an expert in 3D print manufacturing and a research and development designer at Lonati SpA to join a 3D printing effort.
When the supplier didn't wish to share the design's specifics, they reverse-engineered the valves and produced a limited not-for-profit series for local hospitals. To satisfy biomedical requirements that can withstand periodic sanitation, Lonati SpA used their SLS 3D printers to print about 100 valves in Nylon PA12.
Faini and Temporelli still acknowledge the limitations of their production: 3D printing not being able to reach the quality and sterilized context of the original valves and manufacturing process. Contrary to rumous online, the valves don't cost US$10,000 each and the original manufacturer did not threaten to sue the 3D printers team.
Hackers of the Ventilator Project have brainstormed to propose to re-purposing CPAP machines (sleep-apnea masks) as ventilators, hacking single ventilators to split air-flow and treat multiple patients, and using grounded aircraft as treatment facilities to leverage their one-oxygen-mask-per-seat infrastructure.
Engineers familiar with devices design and production, medical professionals familiar existing respiratory devices and lawyers able to navigate FDA regulations if the needs arise are key participants among the 350 volunteers involved. The central avenue of exploration is to ditch away from the most advanced features of modern mechanical ventilation, which includes layers of electronics and patients monitoring systems, to focus solely on assisted respiration by pressured airflow.
The group is, by example, looking for an old Harry Diamond Laboratories "emergency army respirator" model to study. While hopeful they will be able to submit the viable and mass-producible design, several questions linger at this later levels: mass production line, FDA approval, personnel training, personnel availability, and eventually actual needs on the battlegrounds to come.
An MIT team has also designed an emergency ventilator.
ECMOs:
Extracorporeal membrane oxygenation are devices able to replace both the lungs and the patient's heart. As of 6 February 2020, the medical community was encouraged to set up criteria for ECMO patients triage.
Facilities:
Hospitals:
As Wuhan's situation worsened and to assist the overwhelmed Central Hospital of Wuhan and Dabie Mountain Regional Medical Centre, China built two emergency field hospitals within a few days: the Huoshenshan Hospital and Leishenshan Hospital. The hospitals were progressively phased out in March 2020.
On 23 March, Lieutenant General Todd T. Semonite, Chief of the U.S. Army Corps of Engineers, signaled an ongoing effort to lease existing facilities such as hotels, college dormitories, and a larger hall to temporarily convert them into medical facilities.
On 16 March, French President Emmanuel Macron announced a military hospital would be set up in the Grand-Est region, to provide up to 30 ICU beds. The hospital was being tested 7 days later.
By 8 March, Lombardy had created 482 new ICU beds. Lodi's ICU director reported that every single square metre, every single aisle of the hospital had been re-purposed for severe COVID-19 patients, increasing ICU beds from 7 to 24. In Monza, 3 new wards of 50 beds each were opened on 17 March. In Bergamo, gastrology, internal medicine, neurology services have been repurposed.
In the UK, almost the entire private health stock of beds was requisitioned, providing an additional 8,000 beds. Three Nightingale hospitals were created by NHS England, with the military, to provide an additional 10–11,000 critical care beds, another 1,000-bed hospital created in Scotland, and a 3,000-bed hospital at the Principality Stadium in Cardiff.
Temporary wards were constructed in hospital car parks, and existing wards re-organised to free up 33,000 beds in England and 3,000 in Scotland for COVID-19 patients. A hangar at Birmingham Airport was converted into a 12,000 body mortuary.
Morgues:
New York morgue shortages led the city to propose temporary burial in parks.
Health workers:
There are many factors to the healthcare worker shortage. First, the excess demand due to the pandemic. Second, the specialized nature of care of the critically ill and the time taken to train for new methods of working to prevent cross-contamination, in some cases with new types of protective equipment (PPE).
The third factor is the loss of staff to the pandemic, mostly because they are self-isolating with symptoms (which may be unrelated) or because a household member has symptoms, but also because of long term effects of the disease, or death. This last case applies across the health system and makes it harder to draw staff from non-COVID health workers.
Mitigations being used include recruiting military and sports medics, final-year doctors in training, private sector staff, and re-recruiting retired staff and those who have moved from the medical sector. For non-medical roles, staff have been recruited from other sectors.
Also, automation in health care (process automation solutions, AI-driven medical technologies, ...) can help to reduce medical staff and some equipment such as augmented reality headsets (Microsoft HoloLens, ...) may also help to reduce the possibility of medical staff becoming ill and unable to work an can also reduce the amount of medical staff requirements through labor efficiency gains.
Patient overload:
Facing the prospect of an unmanageable influx of patients both in his city and in others across the United States, New York City mayor Bill de Blasio called on the U.S. federal government to recruit additional medical staff to help meet demand. He suggested recruiting from a pool that includes retired doctors and nurses, private surgeons, and others not actively tending to COVID-19 patients, and he proposed assigning and reassigning them as needed to different parts of the country depending on which cities and states were expected to be hardest hit at any given point in time.
Isolation and trauma:
See also: Mental health during the 2019–20 coronavirus pandemic
As for China, medical staff are self-isolating from families and under high emotional pressure.
Psychological trauma is expected among medical professionals. The AMA has created a guide for healthcare organizations to reduce psychosocial trauma and increase the likelihood of medical staffs.
Sickness and death:
In Italy, at least 50 doctors have died from COVID-19.
In Lombardy, Italy, with the mid-March 2020 outbreak, medical staff reported high level of sick staff. In Lodi, doctors from other services have been called to attend to Covid patients.
In Cremona, the number of patients entries was three times the usual while services were running with 50% of their staff. On 12 March 8% of Italy's 13,382 cases were health workers. It was also reported that between 5 and 10% of deaths were medical staff.
On 17 March, one of the largest hospital of the Bergamo region ran out of ICU beds, patients were flown to other regions by helicopter.
About 14% of Spanish cases are medical staff.
In the USA, about 62,000 HCW have been detected as infected by late May 2020, 291 have died (0.47%).
By late May, Mexico had 11,000 medical staff detected as infected, depleting medical ranks.
Pharmaceutical products:
Critical inhaler medication shortage loomed as coronavirus cases soared in March 2020.
Consumer Goods:
Some daily goods have seen shortages as a result of both disruptions to the supply chains and spikes in demand,, leading to empty shelves for these products in grocery stores. Affected products included toilet paper, hand sanitizer, cleaning supplies and canned food.
Various consumer items were reported in local shortage due to either supply chain disruption or unusual demand, including:
Condoms:
In late March and early April, concerns about a global condom shortage arose after some factories that manufacture condoms were forced to shut down or reduce their operations, in compliance with government-imposed stay-at-home orders, including Malaysia-based Karex, the world's largest condom producer. This has been compounded with delays in delivery due to greater restrictions on imports and freight, such as Egypt's 18-day quarantine on condom shipments.
The possibility of a condom shortage has been particularly concerning for groups focused on contraception and HIV prevention in Africa.
Toilet paper and other paper products:
The pandemic led to shortages of toilet paper in various countries, including Australia, Singapore, Hong Kong, Canada, the United Kingdom and the United States. In March 2020 at numerous stores throughout these countries, shoppers reported empty shelves in both the toilet paper section as well as sections for related products such as paper towels, tissues, and diapers.
Initially, much of this was blamed on panic buying. Consumers began fearing both supply chain disruption and the possibility of being forced into extended quarantines that would prevent them from purchasing toilet paper and related products, despite reassurance from industry and government that neither was likely to occur. As a result, some consumers began hoarding toilet paper, leading to reports of empty shelves, which in turn led to additional fear of a toilet paper shortage that prompted others to hoard toilet paper as well.
The shortage created a massive spike in Google Search, over 4000% for the term "toilet paper" alone. Essential supply locator sites and tools sprouted up everywhere in an effort to assist communities in finding local sources as online retailers were out of stock.
However, by early April 2020, additional factors other than panic buying were identified as causes of the toilet paper shortage. In particular, as a result of stay-at-home orders, people have been spending much less time at schools, workplaces, and other public venues and much more time at home, thus using public toilets less frequently and home toilets more frequently.
This has caused a strain on supply chains, since public toilets and home toilets generally use two different grades of toilet paper: commercial toilet paper and consumer toilet paper, respectively. Georgia-Pacific predicted a 40 percent increase in the use of consumer toilet paper as a result of people staying at home.
Due to differences in roll size, packaging, and supply and distribution networks between the two grades, toilet paper manufacturers are expected to have difficulty shifting production to meet the shift in demand from commercial to home use, leading to lingering shortages even after panic buying subsides. There has also been an increase in the sale of bidets.
Others:
In France, due to closed borders preventing foreign seasonal workers from entering the country, the Minister of Agriculture called for jobless volunteers to contact strawberry farms to help collect the harvest for the usual minimal wage,
Laboratory mice are being culled, and some strains are at risk of shortage due to lockdowns.
In the United States, social distancing has led to shortages of blood donations.
Coins:
A shortage of coins was also reported around the United States as the circulation of coins came to a halt. The normal circulation of coins through banks, business, and consumers was interrupted at every step.
The lockdown closed both banks and businesses. Consumers also shied away from the use of cash when health warnings from the WHO, NIH, and CDC indicated that the use of cash and coin could spread the virus. Therefore, coins stopped moving throughout the economy.
The shortage was further exacerbated when the United States Department of the Treasury authorized the minting of fewer coins earlier in the year to protect workers during the pandemic.
See also:
Supply and Demand:
In microeconomics, supply and demand is an economic model of price determination in a market. It postulates that, holding all else equal, in a competitive market, the unit price for a particular good, or other traded item such as labor or liquid financial assets, will vary until it settles at a point where the quantity demanded (at the current price) will equal the quantity supplied (at the current price), resulting in an economic equilibrium for price and quantity transacted.
Click on any of the following blue hyperlinks for more about Supply and Demand:
- Graphical representations
- Microeconomics
- Other markets
- Empirical estimation
- Macroeconomic uses
- History
- Artificial intelligent buying platforms
- Criticism
- See also:
- Capacity utilization
- Consumer theory
- Deadweight loss
- Economic surplus
- Effective demand
- Effect of taxes and subsidies on price
- Elasticity
- Excess demand function
- Externality
- History of economic thought
- Inverse demand function
- Law of supply
- Neoclassical economics
- Price discovery
- Rationing
- Social cost
- Supply chain
- Supply shock
- Yield management
- Nobel Prize Winner Prof. William Vickrey: 15 fatal fallacies of financial fundamentalism – A Disquisition on Demand Side Economics (William Vickrey)
- Marshallian Cross Diagrams and Their Uses before Alfred Marshall: The Origins of Supply and Demand Geometry by Thomas M. Humphrey
- By what is the price of a commodity determined?, a brief statement of Karl Marx's rival account
- Supply and Demand by Fiona Maclachlan and Basic Supply and Demand by Mark Gillis, Wolfram Demonstrations Project.
Shortages related to the COVID-19 pandemic
Medical materials and other goods shortages caused by the COVID-19 pandemic quickly became a major issue of the pandemic. The matter of pandemic-related shortage has been studied in the past and has been documented in recent events.
On the medical side, shortages of personal protective equipment such as medical masks, gloves, face shields, sanitizing products, are also joined by potential shortage of more advanced devices such as hospital beds, Intensive care unit (ICU) beds, oxygen therapy, ventilators and ECMO (Extracorporeal membrane oxygenation) devices.
Human resources, especially in terms of medical staff, may be drained by the overwhelming extent of the epidemic and associated workload, together with losses by contamination, isolation, sickness or mortality among health care workers. Territories are differently equipped to face the pandemic.
Various emergency measures have been taken to ramp up equipment levels such as purchases, while calls for donations, local 3D makers, volunteer staffing, mandatory draft, or seizure of stocks and factory lines have also occurred.
Bidding wars between different countries and states over these items are reported to be a major issue, with price increases, orders seized by local government, or cancelled by selling company to be redirected to higher bidder. In some cases, medical workers have been ordered to not speak about these shortages of resources.
While public health advocates and officials have encouraged to flatten the curve by social distancing, the unmitigated ICU needs would be about 50 times the available ICU beds and ventilators capacity of most developed countries. There have also been calls to increase healthcare capacity despite shortages.
Background:
Long term and structural:
See also: Pandemic predictions and preparations prior to COVID-19
Following warnings and increased preparedness in the 2000s, the 2009 swine flu pandemic led to rapid anti-pandemic reactions among Western countries.
The H1N1/09 virus strain, with mild symptoms and low lethality, eventually led to a backlash over public sector over-reactiveness, spending, and the high cost/benefit of the 2009 flu vaccine.
In the following years, national strategic stockpiles of medical equipment were not systematically renewed. In France, a €382 million spending for H1N1 vaccines and masks was widely criticized. French health authorities decided in 2011 to not replace their stocks, to reduce acquisitions and storage costs, to rely more on supplies from China and just-in-time logistics, and to distribute the responsibility to private companies on an optional basis.
In 2013, in order to save cost, a law moved responsibility for personal protective equipment (PPE) stockpiles from the French government to public and private enterprises, which had to plan the security of their workers, without any verification mechanisms in place.
National manufacturers could not compete with Chinese manufacturers' prices on this new open market. The former strategic masks producer closed in 2018 while the French strategic stockpile dropped in this period from one billion surgical masks and 600 million FFP2 masks in 2010 to 150 million and zero, respectively, in early 2020.
France has been called a case study of Juan Branco, author of a critical book on French President Emmanuel Macron's rise to power, argued that selfish quest of power and loyalty in leadership led young and unexperienced people to be in charge of nation-wide health care reforms via blind accounting analysis and management.
France has been cited as a case study for countries now considering a U-turn over the past two decades of globalization of health supplies to gain lower immediate costs. The same approach was taken in the United States. The U.S. Strategic National Stockpile's stock of masks used against the 2009 flu pandemic was not replenished, neither by the Obama administration nor by the Trump administration.
American masks manufacturer Mike Bowen of Prestige Ameritech had been warning for years that the USA mask supply chain was too dependent on China. As Juan Branco for France, Former US President Obama denounced short-term individualistic mindset as negatively affecting public decision making and preparedness.
According to a report in the New York Times, Russian agents spent decades promoting debunked public health scares to increase mistrust toward the Federal government of the United States and its officials at home and abroad, but also to damage American science, a foundation of US national prosperity. These efforts have been linked to lower support for public health programs, anti-vaccines scares and illnesses spread, and weaker global pandemic preparedness prior to the 2020 pandemic.
Several public (World Health Organization (WHO), World Bank, Global Preparedness Monitoring Board) and private initiatives raised awareness about pandemic threats and needs for better preparedness.
Since 2015, Bill Gates has been warning about needing to prepare for a global pandemic. International divisions and lack of suitable collaboration limited preparedness. WHO's pandemic influenza preparedness project had a US$39 million two-year budget, out of WHO's 2020–2021 budget of US$4.8 billion. While WHO gives recommendations, there is no sustained mechanism to review countries' preparedness for epidemics and their rapid response abilities.
According to international economist Roland Rajah, while there are guidelines, local action depends on local governance. Andy Xie, writing in the South China Morning Post, argued that ruling elites, obsessed with economic metrics, failed to prepare their communities against well-known pandemic risks.
Tax systems in the early twenty-first century, by favoring the largest corporations with anti-competitive practices and lower investment rates into innovation and productions, favored corporate actors and corporate profits, increasing the risk of shortages and weakening the society ability to respond to a pandemic.
Early outbreaks in Hubei, Italy, and Spain showed that several wealthy countries' health care systems were overwhelmed. In developing countries with weaker medical infrastructure, oxygen therapy, equipment for intensive care bed and other medical needs, shortages were expected to occur earlier.
Tests:
See also: COVID-19 testing
Testing shortage is a key element preventing authorities from measuring the true extent of current epidemic spread. Germany and Korea's anticipative and aggressive testing strategies has helped to reduce the measured fatality rate. Germany started producing and stockpiling COVID-19 tests as soon as January 2020.
Diagnostic tests:
Reagents:
In Ireland and the UK, in late March and early April, reagent shortages limited the number of tests. By March, insufficient amounts of reagent became a bottleneck for mass testing in the European Union (EU), United Kingdom (UK) and the United States (US).
This has led some authors to explore sample preparation protocols that involve heating samples at 98 °C (208 °F) for 5 minutes to release RNA genomes for further testing.
In UK, on 1 April, the UK government confirmed that a total of 2,000 NHS staff had been tested for coronavirus since the outbreak began, but Cabinet Office Minister Michael Gove said a shortage of chemicals needed for the test meant it was not possible to screen the NHS's 1.2 million workforce.
Gove's statement was contradicted by the Chemical Industries Association, which said there was not a shortage of the relevant chemicals and that at a meeting with a business minister the week before the government had not tried to find out about potential supply problems.
There were also reagent shortages in the United States. Some hospitals manufactured their own reagents from publicly-available recipes.
Swabs:
A feared shortage of swabs in Iceland was averted when stocks were found to bridge the gap until more arrived from China. There were no swabs in the US Strategic National Stockpile, and the US had shortages, despite the one pre-pandemic domestic manufacturer increasing production to 1 million swabs per day in March, and government funding for it to build a new factory in May. Shortages also arose in the UK, but were resolved by 2 April.
In-house manufacturing:
The US FDA licensed a swab-free saliva test and more new swab designs, including 3-D printed versions which are now being manufactured in the labs, hospitals, and other medical facilities using the swabs.
In the US, general-use nasal swabs are Class I medical devices, and are not approved by the FDA. The NIH said that they should follow FDA labelling requirements, be made in a facility registered and listed with the FDA, and pass a publicly-available safety testing protocol.
The material must also be safe; an already-approved autoclavable surgical-grade plastic can be used. The full development process can take as little as two weeks. 3-D-printed swabs increased the demand for suitable 3-D printers.
Some 3-D-printed swab designs are publicly-licensed under Creative Commons licenses, and others are patented, but with the 3-D printing files freely available on request to permitted facilities during the epidemic.
Personal protective equipment:
Generalities:
Although the vast majority of PPE is produced in China, domestic supplies were insufficient. The Chinese government took control of stocks from foreign enterprises whose factories produced these goods. Medicon, whose three factories produced such supplies in China, saw their stocks seized by the Communist Party-led government.
Figures from China Customs show that some 2.46 billion pieces of epidemic prevention and control materials had been imported between 24 January and 29 February, including 2.02 billion masks and 25.38 million items of protective clothing valued at 8.2 billion yuan ($1 billion).
The Press reported that the China Poly Group, together with other Chinese companies and state-owned enterprises, had an important role in scouring markets abroad to procure essential medical supplies and equipment for China. Risland (formerly Country Garden) sourced 82 tons of supplies, which were subsequently airlifted to Wuhan.
Greenland Holdings also sourced bulk supplies of medical consumables such as surgical masks, thermometers, antibacterial wipes, hand sanitisers, gloves and paracetamol for shipping to China. The mass procurement of supplies at wholesale and retail levels by Chinese companies to help their compatriots back home have contributed to shortages of products in western countries where these Chinese companies operate. On 24 March the Australian Prime Minister Scott Morrison announced restrictions on such activities.
Given that the global supply of PPE is insufficient, and following these Chinese measures, the World Health Organization (WHO) recommended in February 2020 minimizing the need for PPE through telemedicine; physical barriers, such as:
- clear windows;
- allowing only those involved in direct care to enter a room with a COVID-19 patient;
- using only the PPE necessary for the specific task;
- continuing use of the same respirator without removing it while caring for multiple patients with the same diagnosis;
- monitoring and coordinating the PPE supply chain;
- and discouraging the use of masks for asymptomatic individuals.
Quality issues exacerbating shortages:
In late-March/early-April 2020, as Western countries were in turn dependent on China for supplies of masks and other equipment, European politicians e.g. the EU chief diplomat Josep Borrell accused China of a soft-power play to influence world opinion.
Also, some of the supplies sent to Spain, Turkey, and the Netherlands were rejected as being faulty. Dutch health ministry issued a recall of 600,000 face masks from a Chinese supplier on 21 March that did not fit properly and whose filters did not work as intended despite them having a quality certificate.
The Spanish government discovered that 60,000 out of 340,000 test kits from a Chinese manufacturer did not accurately test for COVID-19. The Chinese Ministry of Foreign Affairs responded that the customer should "double-check the instructions to make sure that you ordered, paid for and distributed the right ones. Do not use non-surgical masks for surgical purposes".
In mid-May, the European Commission suspended an order of 10 million Chinese masks destined for member states and the UK after two countries reported having received sub-standard products. The masks had been ordered by the EU's executive arm and was set to be distributed in six weekly instalments.
After a first batch of 1.5 million masks was distributed to 17 of the 27 member states and Britain, Poland said the 600,000 items they received did not have European certificates nor did they comply with the necessary standard. Commission health spokesman Stefan De Keersmaecker vowed to investigate and take the necessary action.
By April 2020, studies revealed that a significant percentage of those with coronavirus were asymptomatic, allowing the virus to spread undetected. Therefore, the CDC recommended "wearing cloth face coverings in public settings where other social distancing measures are difficult to maintain".
Sanitizing products:
Hand sanitizer went out of stock in many areas, causing price gouging. In response, brewers and distillers began to produce hand sanitizer.
Protective gear:
In the United States, shortages were such that some nurses at one New York City hospital resorted to wearing garbage bags as an alternative to unavailable protective clothing.
In light of the shortages of traditional protective gear, small businesses throughout the United States have been retooling to produce makeshift protective devices, often created through open source design initiatives in which manufacturers donate the gear to hospitals.
An example is the COVID-19 Intubation Safety Box, first used by hospitals in Taiwan, which is an acrylic cube placed over an infected patient's torso, with openings that allow ventilator intubation and extubation while minimizing contaminated droplet risk to healthcare workers.
CNBC reported that E-commerce platform Amazon banned sales of N95 face masks in the name of price gouging; the shortages of N95 protective gear became even more serious. Amazon Third party Golden Tree Supply turn to Canadian E-commerce platform Shopify to keep on supplying N95 face masks to the people of United States.
In March, The Doctors' Association UK alleged that shortages were covered-up through intimidating emails, threats of disciplinary action and in two cases being sent home from work.
Some doctors were disciplined after managers were annoyed by material they had posted online regarding shortages of surgical masks, goggles, visors and especially gowns in many British National Health Service hospitals.
On 18 April, the communities secretary, Robert Jenrick, reported that 400,000 protective gowns and other PPE were on their way to the U.K. from Turkey. One day later, these were delayed; this led hospital leaders to directly criticise the government for the first time during the pandemic.
The shipment arrived at Istanbul airport en route to the U.K. two days after ministers said that the PPE would appear in the country. Only 32,000 of the order arrived (less than one-tenth), despite the NHS making a down payment to secure its arrival on 22 April. Eventually, these all had to be returned to Turkey as they did not meet NHS standards.
In July, U.S. Customs and Border Protection (CBP) banned products by the Malaysia-based Top Glove and its subsidiary TG Medical due to alleged violations of workers' rights including "debt bondage, excessive overtime, retention of identification documents, and abusive working and living conditions." Most of the world's glove supply comes from Malaysia.
Facial masks:
See also:
Early epidemic in China:
As the epidemic accelerated, the mainland market saw a shortage of face masks due to increased public demand. In Shanghai, customers had to queue for nearly an hour to buy a pack of face masks; stocks were sold out in another half an hour.
Hoarding and price gouging drove up prices, so the market regulator said it would crack down on such acts. In January 2020, price controls were imposed on all face masks on Taobao and Tmall.
Other Chinese e-commerce platform – JD.com, Suning.com, Pinduoduo – did likewise; third-party vendors would be subject to price caps, with violators subject to sanctions.
National stocks and shortages:
In 2006, 156 million masks were added to the U.S. Strategic National Stockpile in anticipation of a flu pandemic. After they were used against the 2009 flu pandemic, neither the Obama administration nor the Trump administration renewed the stocks. By 1 April, U.S.'s Strategic National Stockpile was nearly emptied.
In France, 2009 H1N1-related spending rose to €382 million, mainly on supplies and vaccines, which was later criticized. It was decided in 2011 to not replete its stocks and rely more on supply from China and just-in-time logistics. In 2010, its stock included 1 billion surgical masks and 600 million FFP2 masks; in early 2020 it was 150 million and zero, respectively.
While stocks were progressively reduced, a 2013 rational stated the aim to reduce costs of acquisition and storage, now distributing this effort to all private enterprises as an optional best practice to ensure their workers' protection. This was especially relevant to FFP2 masks, more costly to acquire and store.
As the COVID-19 pandemic in France took an increasing toll on medical supplies, masks and PPE supplies ran low and caused national outrage. France needs 40 million masks per week, according to French president Emmanuel Macron. France instructed its few remaining mask-producing factories to work 24/7 shifts, and to ramp up national production to 40 million masks per month. French lawmakers have opened an inquiry on the past management of these strategic stocks.
In the wake of the 2020 COVID-19 pandemic and widespread complaints by nurses and other health care workers about lack of N95 masks and proper protocols, National Nurses United, the largest organization of registered nurses in the United States, filed over 125 complaints with Occupational Safety and Health Administration (OSHA) offices in 16 states charging hospitals with failing to comply with laws mandating safe workplaces in which COVID-19 nurses should be provided N-95 masks.
The World Health Organization (WHO) called for industry and governments to increase manufacturing by 40% to meet global demands on 3 March 2020 and they also released a document on 6 April 2020 with recommendations for the rational use of PPE. This document was intended for those in the health care and community settings, including the handling of cargo.
This global PPE shortage issue soon became a subject of interest for the concerned public. Academics from the likes of Science Foundation Ireland researched how we can find a solution and avoid this shortage in the future. Simultaneously, independent initiatives and online platforms like [https://PPE Needed.com PPE Needed] were started to provide an immediate solution. UNICEF has also taken steppes to mitigate this current risk and anticipate near-term effects of COVID-19 as well as the access to PPE suppliers.
Competition for supplies:
Countries such as Britain, France, Germany, South Korea, Taiwan, China, India, and others initially responded to the outbreak by limiting or banning exports of medical supplies to protect their citizens, including rescinding orders that other nations already secured.
Germany blocked exports of 240,000 masks bound for Switzerland and also stopped similar shipments to the Central Bohemian Region as well. One French company, Valmy SAS, was forced to block an order for PPE to be sent to the UK, after the company's UK representative told CNN that the order had been blocked by customs officials at the French coast.
Turkey blocked a shipment of ventilators bought by two regional Spanish governments from a Turkish company, citing the risk of a shortage at home in holding onto the ventilators; 116 of the ventilators were later released.
As the pandemic began to worsen, governments began employing strong-arm tactics including even surreptitious means to obtain medical supplies necessary to fight the coronavirus, either through paying more cash to reroute or seizing such equipment.
Slovakian prime minister Peter Pellegrini said the government was preparing cash worth 1.2 million euros ($1.3 million) to purchase masks from a contracted Chinese supplier. He then said "However, a dealer from Germany came there first, paid more for the shipment, and bought it."
Ukraine lawmaker Andriy Motovylovets also stated that "Our consuls who go to factories find their colleagues from other countries (Russia, USA, France, Germany, Italy, etc) who are trying to obtain our orders. We have paid upfront by wire transfer and have signed contracts.
But they have more money, in cash. We have to fight for each shipment." San Marino authorities said they arranged a bank transfer to a supplier in Lugano, Switzerland, to pay for a half-million masks to be shared with Italian neighbous. However, the truck came in empty, because one or several unidentified foreign buyers offered more instead.
Germany snatched 830,000 surgical masks that were arriving from China and destined for Italy. Although Italian authorities managed to persuade Germany to release them, no one in Germany, however, found the masks they seized at all. 1.5 million face masks that were supposed to be delivered from Spain to Slovenia were seized by German agents.
French guards confiscated lorries filled with 130,000 face masks and boxes of sanitisers bound for the UK in what was described as a "despicable act" by the British government.
Italian customs police hijacked some 800,000 imported masks and disposable gloves that were about to be sent to Switzerland.
On 22 March, an Italian newspaper said that the 680,000 face masks and ventilators it ordered from China were confiscated by the Czech Republic's police. They carried out an anti-trafficking operation in which they seized equipment from a warehouse of a private company in northern town of Lovosice.
According to Czech authorities, the donation from China represented only just over 100,000 masks. Czech government sent 110,000 items to Italy as compensation. It's unclear how the masks ended up in Lovosice. Czech Foreign Minister Tomáš Petříček told AFP: "Lovosice is not quite en route from China to Italy."
Valérie Pécresse, regional counselor of Île-de-France, alleged that some Americans, in their aggressive search for stocks, had made tarmac bids for stocks of masks – sight unseen – awaiting loading onto transporters, paying 3 times the price in cash.
However, Politico Europe reported the French claim as "unsubstantiated" and the U.S. Embassy in Paris stated that "The United States government has not purchased any masks intended for delivery from China to France. Reports to the contrary are completely false."
On 3 April, Berlin politician Andreas Geisel accused U.S. agents of appropriating a shipment of 200,000 3M-made face masks meant for Berlin police from the airport in Bangkok. However, these claims were proven false, as 3M revealed it "has no records of an order for respiratory masks from China for the Berlin police" and Berlin police later confirmed that the shipment was not seized by U.S. authorities, but was said to have simply been bought at a better price, widely believed to be from a German dealer or China.
This revelation outraged the Berlin opposition, whose CDU parliamentary group leader Burkard Dregger accused Geisel of "deliberately misleading Berliners" in order "to cover up its own inability to obtain protective equipment". FDP interior expert Marcel Luthe said "Big names in international politics like Berlin's senator Geisel are blaming others and telling US piracy to serve anti-American clichés."
Politico Europe reported that "the Berliners are taking a page straight out of the Trump playbook and not letting facts get in the way of a good story." The Guardian also reported that "There is no solid proof Trump [nor any other American official] approved the [German] heist".
On 3 April, Jared Moskowitz, head of Florida Division of Emergency Management, accused the American company 3M of selling N95 masks directly to foreign countries for cash instead of the United States.
Moskowitz stated that 3M agreed to authorise distributors and brokers to represent they were selling the masks to Florida, but instead his team for the last several weeks "get to warehouses that are completely empty." He then said the 3M authorized U.S. distributors later told him the masks Florida contracted for never showed up because the company instead prioritized orders that come in later, for higher prices, from foreign countries (including Germany, Russia, and France).
As a result, Moskowitz highlighted the issue on Twitter, saying he decided to "troll" 3M. Forbes reported that "roughly 280 million masks from warehouses around the U.S. had been purchased by foreign buyers [on 30 March 2020] and were earmarked to leave the country, according to the broker – and that was in one day", causing massive critical shortages of masks in the U.S.
Using the Defense Production Act, the Trump administration ordered 3M to stop selling US-produced masks to Canada and Latin America, a move the company said would cause "significant humanitarian implications" and could cause those countries to retaliate, resulting in a net decrease of supplies in the US.
On 3 April, the Swedish health care company Mölnlycke announced that France had seized millions of face masks and gloves that the company imported from China to Spain and Italy. The company's general manager, Richard Twomey, denounced France for "confiscat[ing] masks and gloves even though it was not [its] own. This is an extremely disturbing, unbecoming act." Mölnlycke estimated a total of "six million masks was seized by the French.
All had been contracted for, including a million masks each for France, Italy and Spain. The rest were destined for Belgium, the Netherlands, Portugal and Switzerland, which has special trading status with the EU." Sweden's foreign ministry stated to Agence France-Presse that "We expect France to promptly cease the requisition of medical equipment and do what it can to ensure that supply chains and the transportation of goods are secured. The common market has to function, particularly in times of crisis."
On 24 April, San Francisco Mayor London Breed complained that her city's orders for PPE were diverted to other cities and countries. She said "We’ve had issues of our orders being relocated by our suppliers in China. For example, we had isolation gowns on their way to San Francisco and they were diverted to France. We’ve had situations when things we’ve ordered that have gone through Customs were confiscated by FEMA to be diverted to other locations."
Trade in medical supplies between the United States and China has also become politically complicated. Exports of face masks and other medical equipment to China from the United States (and many other countries) spiked in February, according to statistics from Trade Data Monitor, prompting criticism from the Washington Post that the United States government failed to anticipate the domestic needs for that equipment.
Similarly, The Wall Street Journal, citing Trade Data Monitor to show that China is the leading source of many key medical supplies, raised concerns that US tariffs on imports from China threaten imports of medical supplies into the United States.
Reuse of Masks:
Shortage in single-use medical mask and field reports of reuse lead to the question of which process could properly sanitize these PPE without altering their filtering capacity.
FFP2 masks can be sanitized by 70 °C vapor allowing reuses. Use of alcohol is discouraged since it alters N95 mask microfibers' static charge which helps filtration. Chlorine is also discouraged since its fumes may be harmful. Authors are warning against reuses by non-professionals, pointing out that even the best scored methods can degrade the mask if not performed properly.
A Singaporean study found no contamination on mask after brief care to COVID-19 patients, suggesting masks could be reused for multiple patients cares. A portion of SARS-CoV-2 virus can survive long exposure to 60 °C.
Makers have designed Arduino-controlled disinfection boxes, with temperature controls, to safely reuse surgical and N95 masks.
Gas disinfection allows 10 reuse.
DIY masks:
Following N95 masks shortages, volunteers created 3D printed "NanoHack" alternative. This printed mask allows to use hand-cut surgical mask as fine-particle filters.
Given the scarcity of masks and ambiguity on their efficiency, individuals and volunteers have started to produce cloth masks for themselves or for others. Various designs are shared online to ease creation.
Medical face shield:
Reacting to shortage of face shield, volunteers from the maker community with 3D printing abilities initiated an effort to produce face-shields for hospital staff.
3D printer manufacturers:
At the early stage, a few 3D printer manufacturers published their designs.
On 14 March, Budmen Industries, a custom 3D printer maker in New York, created a face shield design and produced their first 50 shields with a plan to donate to the Onondaga County to use in a COVID-19 testing site.
The company published their design and it had more than 3,000 downloads within a week. By the end of the month, the company and its partner made 5,000 face shields with global requests for 260,000 units.
On 16 March, Prusa Research, a Czech 3D printer manufacturer, started working on a face shield design for medical use . The design was approved by the Czech Ministry of Health and went to a field test and a large scale production within 3 days.
The company published the design for people to make face shields to support local efforts. The design was downloaded in a large number by makers around the world. By the end of March, the company employed 500 employees to work on the 10,000 shields order. Their design was downloaded 40,000 times.
Local volunteers:
As the shortage of personal protective equipment in New York City hospitals got into a critical stage, volunteers started making face shields using the Budmen design on 20 March.
More efforts were started by various groups from hobbyists, academics, to experts. Many designs had been created and groups were formed to supply face shields to local hospitals.
On 24 March, while the epidemic was expanding, popular French 3D maker and YouTuber Heliox announced on 24 March that she would produce face shields for free, building upon another maker's design. She was quickly contacted by local hospitals, health centers and other medical professionals asking for rapid delivery of face shields. The visible popularity of her initiative caused other 3D makers to join the effort and offer their help in other regions to connect health facilities with nearby makers.
On 30 March, The New York Times published a video on COVID-19-related shortages and healthcare workers' DIY solutions.
Government agencies:
On 23 March 2020, United States Food and Drug Administration (FDA), United States Department of Veterans Affairs (VA), and National Institutes of Health (NIH) entered into a memorandum of understanding to form a public-private partnership with America Makes, a non-profit organization, to test designs of 3D printed personal protective equipment including face shields.
The agreement was to have NIH to provide the 3D Print Exchange system to solicit open designs, VA to perform testing in clinical settings, FDA to participate in the review process and America Makes to coordinate with makers to produce the approved designs for healthcare facilities. As of 18 June 13 face shields have been reviewed as appropriate for clinical use.
On 9 April 2020, FDA issued an emergency use authorization that included an authorization for the use of face shields by health care personnel. FDA laid out the details of the conditions, and waiver of requirements for face shield makers in a letter on 13 April 2020.
Companies:
Apple Inc. announced on 5 April they would produce 1 million face shields per week to be sent to U.S. hospitals.
By mid April, many large companies such as Hewlett-Packard, Ford Motor Company, and Blue Origin had joined the efforts to make face shields. Even sports equipment manufacturers such as Bauer Hockey joined in and started making face shields for medical workers.
Medical care devices:
The availability of critical care beds or ICU beds, mechanical ventilation and ECMO devices generally closely associated with hospital beds has been described as a critical bottleneck in responding to the ongoing COVID-19 pandemic. The lack of such devices dramatically raises the mortality rate of COVID-19.
Oxygenation mask:
Popular snorkelling masks have been adapted into oxygen dispensing emergency respiratory masks via the usage of 3D printed adapters and minimal modifications to the original mask.
According to Italian laws relative to medical cares where the project has occurs, usage by the patient requires a signed declaration of acceptance of use of an uncertified biomedical device. The project provides the 3D files for free, as well as 2 forms to register hospitals in need and 3D makers willing to produces adapters.
In France, the main sportswear and snorkeling masks producer Decathlon has locked down its mask sales to redirect them toward medical staff, patients and 3D makers. An international collaboration including Decathlon, BIC, Stanford, and other actors is on track to scale up production for international needs.
Intensive care beds:
See also: List of countries by hospital beds
Both rich countries and developing countries have or will face intensive care beds shortages, but the situation is expected to be more intense in developing countries due to lower equipment levels.
In early March, the UK government supported a strategy to develop natural herd immunity, drawing sharp criticism from medical personnel and researchers. Various forecasts by Imperial College COVID-19 Response Team, made public on 16 March, suggested that the peak number of cases in the UK would require between 100 and 225 CCBs / 100,000 inhabitants, if proper mitigation or no mitigation strategies are put into force, respectively.
These requirements would both exceed the UK's current capacities of 6.6–14 CCB / 100,000 inhabitants. In the best case scenario, the peak caseload would require 7.5 times the current number of available ICU beds. Around 16 March, the UK government changed trajectory toward a more standard mitigation/suppression strategy.
In France, around 15 March, the Grand Est region was the first to express the scarcity of CCB limiting its handling of the crisis. Assistance-publique Hôpitaux de Paris (AP-HP), which manages most hospitals in the French capital area (~10 million inhabitants), reported the need for 3,000–4,000 ICUs. Current capacity is reported to be between 1500[ and 350, depending on the source.
In France, given shortages of ICU hospital beds in Grand Est and Ile-de-France regions, severe but stable patients with ARS and breathing assistance have been moved toward other regional medical centers within France, Germany, Austria, Luxembourg or Switzerland.
Mechanical ventilation:
Mechanical ventilation has been called "the device that becomes the decider between life and death" for COVID-19 patients because 3.2% of detected cases need ventilation during treatment. Ventilators shortage is endemic in the developing world.
In case of shortage, some triage strategies have been previously discussed. One strategy is to grade the patient on dimensions such as: prospects for short-term survival; prospects for long-term survival; stage of life-related considerations; pregnancy and fair chance. The frequent 15 to 20 day duration of the intubation to recover is an important factor in the ventilator's shortage.
An important way of reducing demand for ventilators is the use of CPAP devices as a first resort. For this reason CPAP devices themselves have become a scarce item.
Official assessments:
In the 2000s, the U.S. CDC estimated a national shortage of 40–70,000 ventilators in case of pandemic influenza. From this assessment resulted Project Aura, a public-private initiative to design a frugal, $3,000 mechanical ventilator, simple to mass-produce, and able to supply the Strategic National Stockpile.
Newport Medical Instruments was granted the contract, designing and prototyping (2011) the frugal ventilators to CDC officials, and expecting to later profit from the product by moving into the private market where competing devices were sold for $10,000.
In April 2012, US Health and Human Services officials confirmed to the US Congress that the project was on schedule to file for market approval in late 2013, after which the device would go into mass-production. In May 2012, US$12 billion medical conglomerate Covidien, a top actor of the mechanical ventilation market, acquired Newport for $100 million.
Covidien soon asked to cancel the Project Aura contract since it wasn't profitable enough. Former Newport executives, government officials and executives at rival ventilator companies suspect Covidien acquired Newport to prevent the frugal $3,000 ventilator design from disturbing its profitable ventilation operation.
Covidien merged in 2015 into Medtronic. Project Aura looked for and then signed a new contract with Philips healthcare. In July 2019, the FDA signed for 10,000 units of their Trilogy Evo portable ventilator, to be delivered to the SNS by mid-2020.
On 25 March 2020, Andrew Cuomo made a detailed 1-hour COVID-19 press conference, emphasizing an expectation of a severe shortage of ventilators, and their importance in sustaining life in severe COVID-19 cases.
Cuomo said New York state would ultimately need about 30,000 ventilators to handle the influx, while having only 4,000 as of 25 March; on the 27th, President Trump expressed doubt about the need, saying "I don't believe you need 40,000 or 30,000 ventilators," and resisted calls to force businesses to produce them.
Later on the 27th, the President acceded to calls to assist states in ventilator procurement, using the Defense Production Act, although fears remain that procurement will not happen in time to prevent severe shortages.
Industrial suppliers:
In Europe, the company Löwenstein Medical producing 1500 ICU-level ventilators and 20,000 home-level ventilator per year for France alone, pointed out of the current high demand and production shortage.
Based in Europe, all their components are European and not relying on the Chinese supply chain. As for production ramp-up, it was suggested to increase the production of home-level ventilators, more basic and which can be assembled in half an hour, yet able to support patients through acute respiratory distress syndrome.
The current bottleneck is mainly a question of qualified human resources. In business as usual, ICU-level ventilators are to be renewed every 10 to 15 years. Due to the coronavirus pandemic, Germany and other European countries have started to take control over the company's supply.
In China, local manufacturers are racing to answer the demand. Medtronic made ventilator design specifications publicly available but licensing questions remain unclarified.
Improvised ventilators:
See also: Open-source ventilator
In the United Kingdom, despite a lack of ventilators being previously identified in Exercise Cygnus, there was a shortage of them during COVID-19 with the government stockpiles proving to be insufficient.
In March, the British government called for industry to get involved with making ventilators for the NHS, with Dyson and Babcock revealing plans on creating 30,000 medical ventilators (this amount was seen as necessary based on modelling from the time from China).
The Ventilator Challenge involved companies such as Airbus, Rolls-Royce and Ford. This was seen as impractical at the time; the type of ventilators suggested by the government to these companies were crude and would not have been able to be used in hospitals, and none of the companies involved reached the final stages of testing and the majority have proved surplus to requirements in hindsight.
3D makers have been working on various low-cost alternative ventilation devices or adaptations.
Anesthetist Dr. Alan Gauthier from Ontario, Canada, turned one single-patient ventilator into a nine-patient device thanks to a 2006 YouTube video by 2 doctors from Detroit. The method uses T-shaped tubes to split airflow and multiply the number of patients provided with respiratory support.
In Ireland, volunteers started the Open Source Ventilator Project in collaboration with medical staff.
In Italy, a local journalist and journal director Nunzia Vallini of the Giornale di Brescia (Brescia Daily) was informed that nearby Chiani hospital was running out of valves which mix oxygen with air and are therefore a critical part of reanimation devices. The valves supplier was itself out of stock leading to patient deaths.
Vallini contacted FabLab founder Massimo Temporelli, which invited Michele Faini, an expert in 3D print manufacturing and a research and development designer at Lonati SpA to join a 3D printing effort.
When the supplier didn't wish to share the design's specifics, they reverse-engineered the valves and produced a limited not-for-profit series for local hospitals. To satisfy biomedical requirements that can withstand periodic sanitation, Lonati SpA used their SLS 3D printers to print about 100 valves in Nylon PA12.
Faini and Temporelli still acknowledge the limitations of their production: 3D printing not being able to reach the quality and sterilized context of the original valves and manufacturing process. Contrary to rumous online, the valves don't cost US$10,000 each and the original manufacturer did not threaten to sue the 3D printers team.
Hackers of the Ventilator Project have brainstormed to propose to re-purposing CPAP machines (sleep-apnea masks) as ventilators, hacking single ventilators to split air-flow and treat multiple patients, and using grounded aircraft as treatment facilities to leverage their one-oxygen-mask-per-seat infrastructure.
Engineers familiar with devices design and production, medical professionals familiar existing respiratory devices and lawyers able to navigate FDA regulations if the needs arise are key participants among the 350 volunteers involved. The central avenue of exploration is to ditch away from the most advanced features of modern mechanical ventilation, which includes layers of electronics and patients monitoring systems, to focus solely on assisted respiration by pressured airflow.
The group is, by example, looking for an old Harry Diamond Laboratories "emergency army respirator" model to study. While hopeful they will be able to submit the viable and mass-producible design, several questions linger at this later levels: mass production line, FDA approval, personnel training, personnel availability, and eventually actual needs on the battlegrounds to come.
An MIT team has also designed an emergency ventilator.
ECMOs:
Extracorporeal membrane oxygenation are devices able to replace both the lungs and the patient's heart. As of 6 February 2020, the medical community was encouraged to set up criteria for ECMO patients triage.
Facilities:
Hospitals:
As Wuhan's situation worsened and to assist the overwhelmed Central Hospital of Wuhan and Dabie Mountain Regional Medical Centre, China built two emergency field hospitals within a few days: the Huoshenshan Hospital and Leishenshan Hospital. The hospitals were progressively phased out in March 2020.
On 23 March, Lieutenant General Todd T. Semonite, Chief of the U.S. Army Corps of Engineers, signaled an ongoing effort to lease existing facilities such as hotels, college dormitories, and a larger hall to temporarily convert them into medical facilities.
On 16 March, French President Emmanuel Macron announced a military hospital would be set up in the Grand-Est region, to provide up to 30 ICU beds. The hospital was being tested 7 days later.
By 8 March, Lombardy had created 482 new ICU beds. Lodi's ICU director reported that every single square metre, every single aisle of the hospital had been re-purposed for severe COVID-19 patients, increasing ICU beds from 7 to 24. In Monza, 3 new wards of 50 beds each were opened on 17 March. In Bergamo, gastrology, internal medicine, neurology services have been repurposed.
In the UK, almost the entire private health stock of beds was requisitioned, providing an additional 8,000 beds. Three Nightingale hospitals were created by NHS England, with the military, to provide an additional 10–11,000 critical care beds, another 1,000-bed hospital created in Scotland, and a 3,000-bed hospital at the Principality Stadium in Cardiff.
Temporary wards were constructed in hospital car parks, and existing wards re-organised to free up 33,000 beds in England and 3,000 in Scotland for COVID-19 patients. A hangar at Birmingham Airport was converted into a 12,000 body mortuary.
Morgues:
New York morgue shortages led the city to propose temporary burial in parks.
Health workers:
There are many factors to the healthcare worker shortage. First, the excess demand due to the pandemic. Second, the specialized nature of care of the critically ill and the time taken to train for new methods of working to prevent cross-contamination, in some cases with new types of protective equipment (PPE).
The third factor is the loss of staff to the pandemic, mostly because they are self-isolating with symptoms (which may be unrelated) or because a household member has symptoms, but also because of long term effects of the disease, or death. This last case applies across the health system and makes it harder to draw staff from non-COVID health workers.
Mitigations being used include recruiting military and sports medics, final-year doctors in training, private sector staff, and re-recruiting retired staff and those who have moved from the medical sector. For non-medical roles, staff have been recruited from other sectors.
Also, automation in health care (process automation solutions, AI-driven medical technologies, ...) can help to reduce medical staff and some equipment such as augmented reality headsets (Microsoft HoloLens, ...) may also help to reduce the possibility of medical staff becoming ill and unable to work an can also reduce the amount of medical staff requirements through labor efficiency gains.
Patient overload:
Facing the prospect of an unmanageable influx of patients both in his city and in others across the United States, New York City mayor Bill de Blasio called on the U.S. federal government to recruit additional medical staff to help meet demand. He suggested recruiting from a pool that includes retired doctors and nurses, private surgeons, and others not actively tending to COVID-19 patients, and he proposed assigning and reassigning them as needed to different parts of the country depending on which cities and states were expected to be hardest hit at any given point in time.
Isolation and trauma:
See also: Mental health during the 2019–20 coronavirus pandemic
As for China, medical staff are self-isolating from families and under high emotional pressure.
Psychological trauma is expected among medical professionals. The AMA has created a guide for healthcare organizations to reduce psychosocial trauma and increase the likelihood of medical staffs.
Sickness and death:
In Italy, at least 50 doctors have died from COVID-19.
In Lombardy, Italy, with the mid-March 2020 outbreak, medical staff reported high level of sick staff. In Lodi, doctors from other services have been called to attend to Covid patients.
In Cremona, the number of patients entries was three times the usual while services were running with 50% of their staff. On 12 March 8% of Italy's 13,382 cases were health workers. It was also reported that between 5 and 10% of deaths were medical staff.
On 17 March, one of the largest hospital of the Bergamo region ran out of ICU beds, patients were flown to other regions by helicopter.
About 14% of Spanish cases are medical staff.
In the USA, about 62,000 HCW have been detected as infected by late May 2020, 291 have died (0.47%).
By late May, Mexico had 11,000 medical staff detected as infected, depleting medical ranks.
Pharmaceutical products:
Critical inhaler medication shortage loomed as coronavirus cases soared in March 2020.
Consumer Goods:
Some daily goods have seen shortages as a result of both disruptions to the supply chains and spikes in demand,, leading to empty shelves for these products in grocery stores. Affected products included toilet paper, hand sanitizer, cleaning supplies and canned food.
Various consumer items were reported in local shortage due to either supply chain disruption or unusual demand, including:
- freezers,
- $100 bills (on one bank in New York City),
- jigsaw puzzles,
- Kettlebells,
- blood,
- baking yeast,
- dogs and cats for adoption in New York City,
- PlayStation 4,
- Nintendo Switch and Nintendo Switch Lite,
- laptop and tablet computers,
- and small gold bars and gold coins.
Condoms:
In late March and early April, concerns about a global condom shortage arose after some factories that manufacture condoms were forced to shut down or reduce their operations, in compliance with government-imposed stay-at-home orders, including Malaysia-based Karex, the world's largest condom producer. This has been compounded with delays in delivery due to greater restrictions on imports and freight, such as Egypt's 18-day quarantine on condom shipments.
The possibility of a condom shortage has been particularly concerning for groups focused on contraception and HIV prevention in Africa.
Toilet paper and other paper products:
The pandemic led to shortages of toilet paper in various countries, including Australia, Singapore, Hong Kong, Canada, the United Kingdom and the United States. In March 2020 at numerous stores throughout these countries, shoppers reported empty shelves in both the toilet paper section as well as sections for related products such as paper towels, tissues, and diapers.
Initially, much of this was blamed on panic buying. Consumers began fearing both supply chain disruption and the possibility of being forced into extended quarantines that would prevent them from purchasing toilet paper and related products, despite reassurance from industry and government that neither was likely to occur. As a result, some consumers began hoarding toilet paper, leading to reports of empty shelves, which in turn led to additional fear of a toilet paper shortage that prompted others to hoard toilet paper as well.
The shortage created a massive spike in Google Search, over 4000% for the term "toilet paper" alone. Essential supply locator sites and tools sprouted up everywhere in an effort to assist communities in finding local sources as online retailers were out of stock.
However, by early April 2020, additional factors other than panic buying were identified as causes of the toilet paper shortage. In particular, as a result of stay-at-home orders, people have been spending much less time at schools, workplaces, and other public venues and much more time at home, thus using public toilets less frequently and home toilets more frequently.
This has caused a strain on supply chains, since public toilets and home toilets generally use two different grades of toilet paper: commercial toilet paper and consumer toilet paper, respectively. Georgia-Pacific predicted a 40 percent increase in the use of consumer toilet paper as a result of people staying at home.
Due to differences in roll size, packaging, and supply and distribution networks between the two grades, toilet paper manufacturers are expected to have difficulty shifting production to meet the shift in demand from commercial to home use, leading to lingering shortages even after panic buying subsides. There has also been an increase in the sale of bidets.
Others:
In France, due to closed borders preventing foreign seasonal workers from entering the country, the Minister of Agriculture called for jobless volunteers to contact strawberry farms to help collect the harvest for the usual minimal wage,
Laboratory mice are being culled, and some strains are at risk of shortage due to lockdowns.
In the United States, social distancing has led to shortages of blood donations.
Coins:
A shortage of coins was also reported around the United States as the circulation of coins came to a halt. The normal circulation of coins through banks, business, and consumers was interrupted at every step.
The lockdown closed both banks and businesses. Consumers also shied away from the use of cash when health warnings from the WHO, NIH, and CDC indicated that the use of cash and coin could spread the virus. Therefore, coins stopped moving throughout the economy.
The shortage was further exacerbated when the United States Department of the Treasury authorized the minting of fewer coins earlier in the year to protect workers during the pandemic.
See also:
- List of countries by hospital beds – Wikipedia list article
- Economic impact of the COVID-19 pandemic – Economic effects of the COVID-19 pandemic
American Rescue Plan Act of 2021
- YouTube Video: Examining the American Rescue Plan Act: Key Provisions for Organizations & Individuals
- YouTube Video: Markup of: American Rescue Plan Act of 2021
- YouTube Video: Nonpartisan report shows who is likely to benefit most from American Rescue Plan
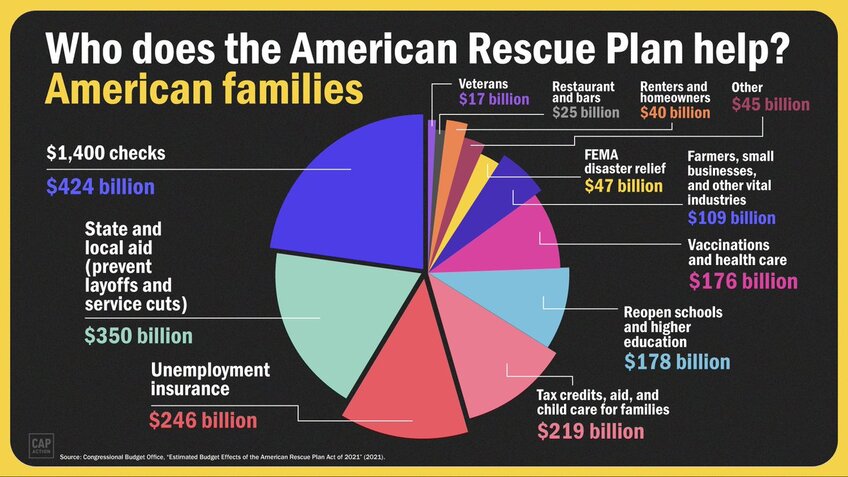
The American Rescue Plan Act of 2021, also called the COVID-19 Stimulus Package or American Rescue Plan, is a $1.9 trillion economic stimulus bill passed by the 117th United States Congress and signed into law by President Joe Biden on March 11, 2021, to speed up the United States' recovery from the economic and health effects of the COVID-19 pandemic and the ongoing recession.
First proposed on January 14, 2021, the package builds upon many of the measures in the CARES Act from March 2020 and in the Consolidated Appropriations Act, 2021, from December.
Beginning on February 2, 2021, Democrats in the United States Senate started to open debates on a budget resolution that would allow them to pass the stimulus package without support from Republicans through the process of reconciliation.
The House of Representatives voted 218–212 to approve its version of the budget resolution. A vote-a-rama session started two days later after the resolution was approved, and the Senate introduced amendments in the relief package. The day after, Vice President Kamala Harris cast her first tie-breaking vote as vice president in order to give the Senate's approval to start the reconciliation process, with the House following suit by voting 219–209 to agree to the Senate version of the resolution.
On February 8, 2021, the Financial Services and Education and Labor committees released a draft of $1.9 trillion stimulus legislation. A portion of the relief package was approved by the House Ways and Means on February 11, setting it up for a vote in the House. The legislation was also approved by the Transportation and Infrastructure, Small Business, and House Veterans Affairs committees.
On February 22, the House Budget Committee voted 19–16 to advance the bill to the House for a floor vote. The bill passed the House by a vote of 219–212 on February 27. All but two Democrats voted for the bill and all Republicans voted against the bill. A modified version passed the Senate on March 6 by a vote of 50–49.
The final amended bill was passed by the House on March 10 by a vote of 220–211 with one Democrat voting against it with all Republicans. The bill was signed into law by President Biden on March 11, 2021, which was the first anniversary of COVID-19 being declared a global pandemic by the World Health Organization.
Background:
Impact of the COVID-19 pandemic:
Further information:
The United States went under an economic recession, and roughly 500,000 Americans died due to the public health crisis. Additionally, over 29 million Americans tested positive for COVID-19 since the start of the pandemic.
The United States also faced an eviction, unemployment, and hunger crisis since the start of the pandemic. Over 30 to 40 million Americans faced a risk of being evicted from their homes by January 2021.
Then-president Donald Trump also faced criticism for not having a federal strategy to combat the pandemic such as nationwide mask mandates on transportation, a testing strategy, health guidelines, providing medical-grade protective gear, and having an effective vaccine distribution strategy. On January 20, the day after Joe Biden was inaugurated, he warned that the death toll could exceed 500,000.
However, according to Snopes, Biden inherited a vaccine distribution strategy from Trump, and disease expert Anthony Fauci said that his administration would incorporate some aspects of that Trump-era strategy in its ongoing work.
Previous COVID-19 pandemic legislation:
Further information:
Prior to the American Rescue Plan, the CARES Act from March and in the Consolidated Appropriations Act, 2021, from December were both signed into law by then-president Donald Trump. Trump previously expressed support for a direct payments of $2,000 along with Joe Biden and the Democrats. Even though Trump called for Congress to pass a bill increasing the direct payments from $600 to $2,000, then-Senate Majority Leader Mitch McConnell blocked the bill.
Additionally, the House voted on the HEROES Act on May 15, 2020, which would operate as a $3 billion relief package, but it wasn't considered by the Senate as Republicans said that it would be "dead on arrival". Prior to the Georgia Senate runoffs, Biden said that the direct payments of $2,000 would be passed if Jon Ossoff and Raphael Warnock won their seats, but also warned that it would not pass if either Kelly Loeffler or David Perdue won.
On January 14, prior to being inaugurated as president, Biden announced the $1.9 trillion stimulus package.
Legislative history:
Negotiations:
Ten Republican senators announced plans to unveil a roughly $600 billion COVID-19 relief package as a counterproposal to President Joe Biden's $1.9 trillion plan meant to force negotiations. The senators, including Susan Collins of Maine, Lisa Murkowski of Alaska, Mitt Romney of Utah and Rob Portman of Ohio, told Biden in a letter that they devised the plan "in the spirit of bipartisanship and unity" that the President has urged and said they planned to release a full proposal on February 1.
On the same day, House Speaker Nancy Pelosi and Senate Majority Leader Chuck Schumer introduced a budget resolution co-sponsored by Bernie Sanders as a step to pass the legislation without support from the Republican Party. The next day, Biden met with Majority Leader Schumer and other Democrats regarding the relief package.
On February 7, Transportation Secretary Pete Buttigieg and Treasury Secretary Janet Yellen expressed support for the stimulus package. Yellen said that the funding would help millions of Americans and rejected concerns the colossal spending could cause inflation. Yellen also said that the stimulus package would restore full employment by 2022.
On February 9, Biden met with JPMorgan Chase CEO Jamie Dimon and other CEOs to discuss the stimulus plan, with Yellen and Harris taking part in the meeting.
On February 11, Pelosi said that she expects lawmakers to complete the legislation by the end of February, and for the legislation to be signed into law by March 14.
On February 16, Biden promoted his stimulus plan in a visit in Milwaukee, Wisconsin during his first official trip as President. He promoted it via a CNN townhall meeting with voters. On February 18, Yellen called for major stimulus checks during an interview on CNBC, and said that stimulus checks would help the economy stage a full recovery.
Budget resolution passage:
The United States Senate voted 50–49 to open debate on the resolution, which would allow Democrats to pass the relief package without support from Republicans through the process of reconciliation. The House voted 218–212 to approve the budget resolution.
On February 4, a vote-a-rama session began, and the Senate introduced amendments to the relief package, including an amendment in a 90–10 vote that would provide direct relief to the restaurant industry.
Vice President Kamala Harris cast her first tie-breaking vote as vice president to give final Senate approval to the reconciliation bill, sending it to the House to approve the changes, and allowing drafting of the relief bill to begin in the committees. The House approved the resolution 219–209, with Jared Golden being the sole Democrat to join all Republicans in opposition to the bill due to a preference for a separate vaccine bill instead of the longer reconciliation process.
One of the many non-binding budget amendments in the vote-a-rama session was meant to prohibit people who are in the country illegally from receiving pandemic relief checks. The non-binding amendments are not likely to have any effect on the final relief bill. The minority party uses the hundreds of non-binding votes in the hours-long vote-a-rama session to send messages.
Under current law, people in the country unlawfully are already prohibited from receiving checks. The amendment passed with eight Democrats joining all Republicans. The amendment received criticism from progressive immigration activist Greisa Martínez Rosas and Senator Mazie Hirono (D-HI).
The White House later stated that it would continue to support legislation that would give all otherwise eligible individuals with social security numbers stimulus checks.
Budget reconciliation passage:
On February 8, a draft of the $1.9 trillion stimulus legislation was released by the Financial Services and Education and Labor committees. On February 11, the House Ways and Means Committee advanced a portion of the $1.9 trillion relief package. The legislation was also approved by several other House committees such as the Transportation and Infrastructure, Small Business, and House Veterans Affairs.
On February 19, the full text of the bill was released. It included an increase in the federal minimum wage, direct checks for Americans making $75,000 or less a year, an extension of $400 federal unemployment benefits and more money for small businesses.
On February 22, the House Budget Committee voted 19–16 to advance the bill. The following day, House Majority Leader Steny Hoyer announced that the House vote would occur that Friday. On February 26, the House passed the trillion dollar relief package by a vote of 219–212; two Democrats, Kurt Schrader (OR) and Jared Golden (ME) joined all Republicans in opposition.
Majority Leader Chuck Schumer predicted that the Senate would pass the bill before March 14. On March 4, Majority Leader Chuck Schumer introduced the Senate version of the bill on the floor, which had a few changes to the House bill. The Senate voted 51-50 to advance the relief bill and allow debates to begin, with Harris casting the tie-breaking vote.
Ron Johnson objected to Schumer's request to skip the reading of the bill, forcing the Senate clerks to read aloud the entire 628-page Senate bill, delaying the Senate amendment process for up to 15 hours. On March 5, the Senate reconvened and had 3 hours of debate, and thereafter moved to the "vote-a-rama" session, where senators would have the opportunity to introduce, debate, and vote on amendments.
There were multiple amendments brought onto the Senate floor. Bernie Sanders introduced the first amendment to raise the federal minimum wage to $15 per hour. All Republicans and eight Democrats voted against the amendment. After the vote, Sanders stated he was not surprised by the outcome and vowed that progressives would keep fighting on other fronts to raise the minimum wage.
Senator Tom Carper introduced an amendment which would extend the unemployment benefits through the end of September but would cut the benefits from $400 to $300. The amendment also did not tax the first $10,200 of unemployment benefits. Senator Joe Manchin, a key vote in the Senate, disagreed with Carper's amendment, stalling the Senate amendment process for hours while his Democratic colleagues and the White House pressured him to support Carper's amendment.
Manchin had initially signaled he would support a GOP-backed amendment by Portman to cut off the unemployment benefits at July. After hours of negotiations between top Senate Democrats and the White House, Manchin stated he would back a revised version of Carper's amendment which would cut off the unemployment benefits at September 6.
Minimum wage provision:
See also: Minimum wage in the United States
President Biden expressed doubt that his push to increase the federal minimum wage to $15 an hour would be included in the final coronavirus relief package. Biden predicted that Senate rules for budget reconciliation would prevent the increase from going forward.
Sanders and his allies argued that the higher wage would reduce the amount of federal assistance low-income individuals receive and increase their taxable income — meeting the Senate parliamentarian's requirement that any reconciliation measure have an effect on the federal budget.
While recent polling indicates that support for increasing the minimum wage to $15 an hour ranges from 53–60%, Democratic Senators Joe Manchin and Kyrsten Sinema opposed this provision and threatened to derail the bill over this issue.
On February 25, the day before the full House vote, the Senate Parliamentarian Elizabeth MacDonough ruled that the proposal to add the minimum wage provision to the stimulus bill was not compatible with the Senate's budget reconciliation process. Pelosi stated later that day that the House will still approve the bill with the minimum wage raise, although it will have to be amended out in the final Senate bill to comply with the parliamentarian's ruling.
Progressive Democrats and liberal groups urged Harris to overrule MacDonough (which she has the constitutional power to do as president of the Senate) or for Senate Democratic leadership to replace her (which the Republicans did once before, firing Robert Dove in 2001 after he made a series of rulings blocking tax cuts from being considered under the 51-vote budget reconciliation process); however, neither course was taken. On March 5, eight members of the Senate Democratic caucus joined all 50 Republican Senators to reject an amendment raised by Senator Sanders to increase the minimum wage to $15 in the bill.
In a budget analysis released in February 2021, the Congressional Budget Office found that increasing the minimum wage to $15 would lift 900,000 people out of poverty and cumulatively raise the wage of all affected people by $333 billion, but also could increase the cumulative budget deficit, over the next decade, to $54 billion (and add $16 billion in interest costs) and reduce employment by 0.9% (1.4 million jobs) over four years.
Republican Senators Mitt Romney and Tom Cotton introduced their own bill, which would raise the minimum wage to $10, phasing in gradually to 2025. The minimum wage would biennially rise with inflation, indexed to the chained consumer price index.
Businesses would also be required to use the E-Verify system so to ensure that workers paid the higher wages are legal immigrants and eligible to work. Adult workers would have to provide a photo ID, states would be incentivized to share driver’s-license data with the system, and the federal government would make more of an effort to block or suspend misused Social Security numbers.
Other provisions not included in the final bill:
The House-passed bill included $1.5 million for the Seaway International Bridge, which connects the U.S. and Canada, and $140 million for the Silicon Valley BART extension; however, both provisions were removed from the Senate bill due to Republican opposition.
Final passage:
On March 10, 2021, the House passed the Senate bill on a party-line vote of 220–211 (concurring in the Senate amendments), sending the bill to President Biden for his signature. Biden signed the bill the following day, on March 11, 2021. On March 15, 2021, the White House announced that Gene Sperling will oversee the implementation of the bill.
Following the signing, Biden and his top messengers kicked off a "Help is Here" tour across the country to promote the legislation, with Harris visiting a COVID-19 vaccination site in Las Vegas and First Lady Jill Biden visiting an elementary school in New Jersey. On March 16, Biden promoted the bill in Chester, Pennsylvania.
Key elements of the Act:
Key elements of the Act include:
Impact:
The bill's economic-relief provisions are overwhelmingly geared toward low-income and middle-class Americans, who will benefit from (among other provisions) the direct payments, the bill's expansion of low-income tax credits, child-care subsidies, expanded health-insurance access, extension of expanded unemployment benefits, food stamps, and rental assistance programs.
The bill contains little direct aid to high income-earners, who largely retained their jobs during the COVID-19 economic shock and bolstered their savings. Biden's administration crafted the plan in part because economic aid to lower-income and middle-income Americans (who are more likely to immediately spend funds on bills, groceries, and housing costs to avoid eviction or foreclosure) is more likely to stimulate the U.S. economy than aid to higher-earners (who are more likely to save the money).
The Institute on Taxation and Economic Policy found that the stimulus bill's direct payments, child tax credit expansion, and earned income tax credit expansion would boost the income of the poorest one-fifth of Americans by nearly $3,590. The Congressional Budget Office estimated that the bill's increase in health insurance subsidies would lead to 1.3 million previously uninsured Americans gaining health insurance coverage.
An analysis by Columbia University's Center on Poverty and Social Policy estimated that the original stimulus proposal would reduce overall U.S. poverty by a third, reduce child poverty by 57.8% and reduce the adult poverty rate by more than 25%. However these estimates relied in part upon a minimum wage increase that was not included in the final bill, meaning effects on poverty may be notably different then anticipated in that study.
The Tax Policy Center wrote that, for households making under $25,000, the bill would cut their taxes by an average of $2,800, which would boost their after-tax income by 20%.
Additionally, low-income households with children would see an average tax cut of about $7,700, and this would boost their after-tax income by 35%. Middle-income households will also see an average tax cut of about $3,350, and this would increase their after-tax income by 5.5%. Overall, about 70% of the bill's tax benefits will go to households making under $91,000.
Reactions:
Congress:
In a deeply polarized Congress, the relief package received universal support from Democrats and universal opposition from Republicans, passing on party-line votes.
Some House Democratic progressives expressed disappointment with some changes to the relief package made in the Senate (such as the dropping of the $15 minimum wage) to win over moderate Democratic support, but continued to support the package.
Republicans in Congress opposed the bill, but failed to unify around a specific critique other than calling it "ultraprogressive" or "bloated," and falsely claiming the bill only benefitted Democratic-led states.
While debates and negotiations over the stimulus package were on-going, Republicans focused instead on culture war issues unrelated to government actions, such as the decision by the Dr. Seuss estate to stop publishing a racially incendiary Dr. Seuss book and the re-branding of the "Mr. Potato Head" toy.
Many of the provisions in the bill were also included in stimulus legislation passed with Republican support under the Trump administration, making it difficult for Republicans to argue against them. After Congress passed the bill, Senator Roger Wicker (R-MS) highlighted on social media that the bill awarded $28.6 billion of "targeted relief" for "independent restaurant operators" to "survive the pandemic".
In that social media post, Wicker neglected to mention that he had in fact voted against the bill.
President Biden:
President Joe Biden advocated for fast-tracking the stimulus package with optimally bipartisan support. In early February 2021, Biden criticized Republicans for not seeking a bipartisan compromise on a final aid bill, and said the Republicans were wilfully obstructing his proposal.
At the time, Biden signaled openness to passing the legislation without any support from congressional Republicans. Biden stated that he could not, "in good conscience," make concessions to Republicans who he said propose to either "do nothing or not enough" as Republicans complain Biden is forsaking his promises on bipartisanship and unity.
Furthermore, Biden noted that "[a]ll of a sudden, many of them have rediscovered fiscal restraint and the concern for the deficits" whereas in the Trump administration Republicans had passed trillions in dollars in tax cuts and mostly corporate aid for the coronavirus crisis, adding trillions of dollars to the national debt without much reservation.
Others:
Republican mayors such as Jerry Dyer of Fresno, Francis X. Suarez of Miami, David Holt of Oklahoma City, and Betsy Price of Fort Worth, Texas expressed their support for the plan. Dyer told the Washington Post that "It’s not a Republican issue or a Democrat issue. It’s a public health issue. It’s an economic issue. And it’s a public safety issue."
Over 150 CEOs of major companies expressed support for the Biden stimulus plan in a letter and urged Congress to pass it.
A broad range of advocacy and interest groups praised the bill, including:
The Business Roundtable, U.S. Chamber of Commerce, and Committee for a Responsible Federal Budget called for a smaller and more targeted package.
Several observers have noted that the stimulus greatly increases the role of the government in fighting poverty in the United States, to an extent not seen since Lyndon Johnson's Great Society in the 1960s; accordingly some have seen it as evidence that the United States is moving towards social democracy and away from the "government is the problem" consensus in place since the 1980s.
Public opinion:
The stimulus plan had broad public support. A February 11 Newsweek/Harris X poll showed that 60% of Republican voters expressed support for the stimulus plan and a poll from Quinnipiac University found that 68% of Americans support it.
A Morning Consult/Politico poll showed that 76% of voters, including 60% of Republicans and 89% of Democrats, supported the bill.
A Monmouth University poll found that 62% of Americans approve of the stimulus package, with 92% of Democrats, 56% of independents, and 33% of Republicans supporting the legislation.
CBS News released a poll on March 12, which showed that 75% of Americans approved the stimulus bill, including 77% of independents, 46% of Republicans, and 94% of Democrats.
See also:
First proposed on January 14, 2021, the package builds upon many of the measures in the CARES Act from March 2020 and in the Consolidated Appropriations Act, 2021, from December.
Beginning on February 2, 2021, Democrats in the United States Senate started to open debates on a budget resolution that would allow them to pass the stimulus package without support from Republicans through the process of reconciliation.
The House of Representatives voted 218–212 to approve its version of the budget resolution. A vote-a-rama session started two days later after the resolution was approved, and the Senate introduced amendments in the relief package. The day after, Vice President Kamala Harris cast her first tie-breaking vote as vice president in order to give the Senate's approval to start the reconciliation process, with the House following suit by voting 219–209 to agree to the Senate version of the resolution.
On February 8, 2021, the Financial Services and Education and Labor committees released a draft of $1.9 trillion stimulus legislation. A portion of the relief package was approved by the House Ways and Means on February 11, setting it up for a vote in the House. The legislation was also approved by the Transportation and Infrastructure, Small Business, and House Veterans Affairs committees.
On February 22, the House Budget Committee voted 19–16 to advance the bill to the House for a floor vote. The bill passed the House by a vote of 219–212 on February 27. All but two Democrats voted for the bill and all Republicans voted against the bill. A modified version passed the Senate on March 6 by a vote of 50–49.
The final amended bill was passed by the House on March 10 by a vote of 220–211 with one Democrat voting against it with all Republicans. The bill was signed into law by President Biden on March 11, 2021, which was the first anniversary of COVID-19 being declared a global pandemic by the World Health Organization.
Background:
Impact of the COVID-19 pandemic:
Further information:
- Economic impact of the COVID-19 pandemic in the United States
- and COVID-19 pandemic in the United States.
The United States went under an economic recession, and roughly 500,000 Americans died due to the public health crisis. Additionally, over 29 million Americans tested positive for COVID-19 since the start of the pandemic.
The United States also faced an eviction, unemployment, and hunger crisis since the start of the pandemic. Over 30 to 40 million Americans faced a risk of being evicted from their homes by January 2021.
Then-president Donald Trump also faced criticism for not having a federal strategy to combat the pandemic such as nationwide mask mandates on transportation, a testing strategy, health guidelines, providing medical-grade protective gear, and having an effective vaccine distribution strategy. On January 20, the day after Joe Biden was inaugurated, he warned that the death toll could exceed 500,000.
However, according to Snopes, Biden inherited a vaccine distribution strategy from Trump, and disease expert Anthony Fauci said that his administration would incorporate some aspects of that Trump-era strategy in its ongoing work.
Previous COVID-19 pandemic legislation:
Further information:
Prior to the American Rescue Plan, the CARES Act from March and in the Consolidated Appropriations Act, 2021, from December were both signed into law by then-president Donald Trump. Trump previously expressed support for a direct payments of $2,000 along with Joe Biden and the Democrats. Even though Trump called for Congress to pass a bill increasing the direct payments from $600 to $2,000, then-Senate Majority Leader Mitch McConnell blocked the bill.
Additionally, the House voted on the HEROES Act on May 15, 2020, which would operate as a $3 billion relief package, but it wasn't considered by the Senate as Republicans said that it would be "dead on arrival". Prior to the Georgia Senate runoffs, Biden said that the direct payments of $2,000 would be passed if Jon Ossoff and Raphael Warnock won their seats, but also warned that it would not pass if either Kelly Loeffler or David Perdue won.
On January 14, prior to being inaugurated as president, Biden announced the $1.9 trillion stimulus package.
Legislative history:
Negotiations:
Ten Republican senators announced plans to unveil a roughly $600 billion COVID-19 relief package as a counterproposal to President Joe Biden's $1.9 trillion plan meant to force negotiations. The senators, including Susan Collins of Maine, Lisa Murkowski of Alaska, Mitt Romney of Utah and Rob Portman of Ohio, told Biden in a letter that they devised the plan "in the spirit of bipartisanship and unity" that the President has urged and said they planned to release a full proposal on February 1.
On the same day, House Speaker Nancy Pelosi and Senate Majority Leader Chuck Schumer introduced a budget resolution co-sponsored by Bernie Sanders as a step to pass the legislation without support from the Republican Party. The next day, Biden met with Majority Leader Schumer and other Democrats regarding the relief package.
On February 7, Transportation Secretary Pete Buttigieg and Treasury Secretary Janet Yellen expressed support for the stimulus package. Yellen said that the funding would help millions of Americans and rejected concerns the colossal spending could cause inflation. Yellen also said that the stimulus package would restore full employment by 2022.
On February 9, Biden met with JPMorgan Chase CEO Jamie Dimon and other CEOs to discuss the stimulus plan, with Yellen and Harris taking part in the meeting.
On February 11, Pelosi said that she expects lawmakers to complete the legislation by the end of February, and for the legislation to be signed into law by March 14.
On February 16, Biden promoted his stimulus plan in a visit in Milwaukee, Wisconsin during his first official trip as President. He promoted it via a CNN townhall meeting with voters. On February 18, Yellen called for major stimulus checks during an interview on CNBC, and said that stimulus checks would help the economy stage a full recovery.
Budget resolution passage:
The United States Senate voted 50–49 to open debate on the resolution, which would allow Democrats to pass the relief package without support from Republicans through the process of reconciliation. The House voted 218–212 to approve the budget resolution.
On February 4, a vote-a-rama session began, and the Senate introduced amendments to the relief package, including an amendment in a 90–10 vote that would provide direct relief to the restaurant industry.
Vice President Kamala Harris cast her first tie-breaking vote as vice president to give final Senate approval to the reconciliation bill, sending it to the House to approve the changes, and allowing drafting of the relief bill to begin in the committees. The House approved the resolution 219–209, with Jared Golden being the sole Democrat to join all Republicans in opposition to the bill due to a preference for a separate vaccine bill instead of the longer reconciliation process.
One of the many non-binding budget amendments in the vote-a-rama session was meant to prohibit people who are in the country illegally from receiving pandemic relief checks. The non-binding amendments are not likely to have any effect on the final relief bill. The minority party uses the hundreds of non-binding votes in the hours-long vote-a-rama session to send messages.
Under current law, people in the country unlawfully are already prohibited from receiving checks. The amendment passed with eight Democrats joining all Republicans. The amendment received criticism from progressive immigration activist Greisa Martínez Rosas and Senator Mazie Hirono (D-HI).
The White House later stated that it would continue to support legislation that would give all otherwise eligible individuals with social security numbers stimulus checks.
Budget reconciliation passage:
On February 8, a draft of the $1.9 trillion stimulus legislation was released by the Financial Services and Education and Labor committees. On February 11, the House Ways and Means Committee advanced a portion of the $1.9 trillion relief package. The legislation was also approved by several other House committees such as the Transportation and Infrastructure, Small Business, and House Veterans Affairs.
On February 19, the full text of the bill was released. It included an increase in the federal minimum wage, direct checks for Americans making $75,000 or less a year, an extension of $400 federal unemployment benefits and more money for small businesses.
On February 22, the House Budget Committee voted 19–16 to advance the bill. The following day, House Majority Leader Steny Hoyer announced that the House vote would occur that Friday. On February 26, the House passed the trillion dollar relief package by a vote of 219–212; two Democrats, Kurt Schrader (OR) and Jared Golden (ME) joined all Republicans in opposition.
Majority Leader Chuck Schumer predicted that the Senate would pass the bill before March 14. On March 4, Majority Leader Chuck Schumer introduced the Senate version of the bill on the floor, which had a few changes to the House bill. The Senate voted 51-50 to advance the relief bill and allow debates to begin, with Harris casting the tie-breaking vote.
Ron Johnson objected to Schumer's request to skip the reading of the bill, forcing the Senate clerks to read aloud the entire 628-page Senate bill, delaying the Senate amendment process for up to 15 hours. On March 5, the Senate reconvened and had 3 hours of debate, and thereafter moved to the "vote-a-rama" session, where senators would have the opportunity to introduce, debate, and vote on amendments.
There were multiple amendments brought onto the Senate floor. Bernie Sanders introduced the first amendment to raise the federal minimum wage to $15 per hour. All Republicans and eight Democrats voted against the amendment. After the vote, Sanders stated he was not surprised by the outcome and vowed that progressives would keep fighting on other fronts to raise the minimum wage.
Senator Tom Carper introduced an amendment which would extend the unemployment benefits through the end of September but would cut the benefits from $400 to $300. The amendment also did not tax the first $10,200 of unemployment benefits. Senator Joe Manchin, a key vote in the Senate, disagreed with Carper's amendment, stalling the Senate amendment process for hours while his Democratic colleagues and the White House pressured him to support Carper's amendment.
Manchin had initially signaled he would support a GOP-backed amendment by Portman to cut off the unemployment benefits at July. After hours of negotiations between top Senate Democrats and the White House, Manchin stated he would back a revised version of Carper's amendment which would cut off the unemployment benefits at September 6.
Minimum wage provision:
See also: Minimum wage in the United States
President Biden expressed doubt that his push to increase the federal minimum wage to $15 an hour would be included in the final coronavirus relief package. Biden predicted that Senate rules for budget reconciliation would prevent the increase from going forward.
Sanders and his allies argued that the higher wage would reduce the amount of federal assistance low-income individuals receive and increase their taxable income — meeting the Senate parliamentarian's requirement that any reconciliation measure have an effect on the federal budget.
While recent polling indicates that support for increasing the minimum wage to $15 an hour ranges from 53–60%, Democratic Senators Joe Manchin and Kyrsten Sinema opposed this provision and threatened to derail the bill over this issue.
On February 25, the day before the full House vote, the Senate Parliamentarian Elizabeth MacDonough ruled that the proposal to add the minimum wage provision to the stimulus bill was not compatible with the Senate's budget reconciliation process. Pelosi stated later that day that the House will still approve the bill with the minimum wage raise, although it will have to be amended out in the final Senate bill to comply with the parliamentarian's ruling.
Progressive Democrats and liberal groups urged Harris to overrule MacDonough (which she has the constitutional power to do as president of the Senate) or for Senate Democratic leadership to replace her (which the Republicans did once before, firing Robert Dove in 2001 after he made a series of rulings blocking tax cuts from being considered under the 51-vote budget reconciliation process); however, neither course was taken. On March 5, eight members of the Senate Democratic caucus joined all 50 Republican Senators to reject an amendment raised by Senator Sanders to increase the minimum wage to $15 in the bill.
In a budget analysis released in February 2021, the Congressional Budget Office found that increasing the minimum wage to $15 would lift 900,000 people out of poverty and cumulatively raise the wage of all affected people by $333 billion, but also could increase the cumulative budget deficit, over the next decade, to $54 billion (and add $16 billion in interest costs) and reduce employment by 0.9% (1.4 million jobs) over four years.
Republican Senators Mitt Romney and Tom Cotton introduced their own bill, which would raise the minimum wage to $10, phasing in gradually to 2025. The minimum wage would biennially rise with inflation, indexed to the chained consumer price index.
Businesses would also be required to use the E-Verify system so to ensure that workers paid the higher wages are legal immigrants and eligible to work. Adult workers would have to provide a photo ID, states would be incentivized to share driver’s-license data with the system, and the federal government would make more of an effort to block or suspend misused Social Security numbers.
Other provisions not included in the final bill:
The House-passed bill included $1.5 million for the Seaway International Bridge, which connects the U.S. and Canada, and $140 million for the Silicon Valley BART extension; however, both provisions were removed from the Senate bill due to Republican opposition.
Final passage:
On March 10, 2021, the House passed the Senate bill on a party-line vote of 220–211 (concurring in the Senate amendments), sending the bill to President Biden for his signature. Biden signed the bill the following day, on March 11, 2021. On March 15, 2021, the White House announced that Gene Sperling will oversee the implementation of the bill.
Following the signing, Biden and his top messengers kicked off a "Help is Here" tour across the country to promote the legislation, with Harris visiting a COVID-19 vaccination site in Las Vegas and First Lady Jill Biden visiting an elementary school in New Jersey. On March 16, Biden promoted the bill in Chester, Pennsylvania.
Key elements of the Act:
Key elements of the Act include:
- Extending expanded unemployment benefits with a $300 weekly supplement through Labor Day (September 6, 2021), preventing benefits from expiring on March 31, 2021
- Most Democrats favored a higher amount (with the bill initially passed by the House providing for $400 weekly supplement) and some favored a longer duration (through early October); however, the final bill contained a scaled-back provision, at the insistence of Senator Joe Manchin of West Virginia, and other moderate Senate Democrats.
- The act makes the first $10,200 in unemployment benefits for 2020 not taxable for households with incomes below $150,000, thus avoiding the risk of many workers incurring surprise federal tax liability.
- $1,400 direct payments to individuals.
- Under pressure from Manchin, Biden agreed to have the direct payment start to phase out for high-income taxpayers, including some who received stimulus checks in previous stimulus rounds. The stimulus benefit begins to phase out for taxpayers making $75,000 for individuals, $112,500 for single parents, and $150,000 for couples; taxpayers making more than $80,000 for individuals, $120,000 for single parents, and $160,000 for households will not receive any payment. (House Democrats and Biden had favored less stringent caps; the bill initially passed by the House set income caps $100,000 for individuals and $200,000 for couples).
- Unlike in past rounds of stimulus payments, otherwise eligible adult dependents will receive payments, including college students, SSI recipients, and SSDI recipients.
- Emergency paid leave for over 100 million Americans
- The Act provides a tax credit, through October 1, 2021, to employers who choose to offer paid sick leave and paid family leave benefits. However, the Act did not require employers to provide the benefit, as Biden initially proposed.
- Extends a 15% increase in food stamp benefits (the increase, passed in previous rounds of stimulus; was set to expire at the end of June 2021; the bill extends it through September 2021).
- Tax provisions
- Expands the child tax credit by allowing qualifying families to offset, for the 2021 tax year, $3,000 per child up to age 17 and $3,600 per child under age 6. The size of the benefit will gradually diminish for single filers earning more than $75,000 per year, or married couples making more than $150,000 a year. Additionally, this credit is now fully refundable, and half of the benefit can be sent out to eligible households in 2021. The proposal was backed by Senator Mitt Romney of Utah, who introduced a similar bill four days earlier.
- Expands the child and dependent care credit by making the credit fully refundable and increasing the maximum benefit to $4,000 for one eligible individual and $8,000 for two or more eligible individuals. Additionally, the value of this credit will now be based on 50% of the value of eligible expenses. The income limit for receiving this credit is also increased to $125,000 for households. These changes are also for 2021 only.
- Expands the earned income tax credit by removing the upper age limit and lowering the lower age limit to 19. The maximum benefit for adults not claiming a qualifying child will also be increased to $1,502. These provisions are for 2021 only. A permanent change was made to raise the limit on investment income from $3,650 to $10,000, indexed by inflation; and to allow adults with children who do not qualify to claim the credit to claim it only for themselves.
- Forgiven student loan debt is made tax-free, should Biden or Congress decide to cancel any debt.
- Reduction of reporting requirement threshold (1099-K) for third party settlement organizations (e.g. PayPal) from over $20,000 and 200 transactions to over $600 and no minimum number of transaction. This is expected to impact gig workers, independent contractors, casual eBay sellers, among others. This amendment is projected to generate $8.4 billion over the next decade.
- Three tax increases on large corporations and wealthy individuals, collectively raising $60 billion in revenue. These are:
- Limits publicly traded companies' ability to deduct executive compensation (for employees more than $1 million) from their corporate taxes (will generate $6 billion in tax revenue).
- Repeals an obscure provisions in the tax code that gave multinational corporations additional discretion in accounting for interest expenses (will generate $22 billion in tax revenue).
- Extends "loss limitation" restrictions on unincorporated businesses (will generate $31 billion in tax revenue)
- Grants to small businesses, specifically:
- $28.6 billion for a new grant program for restaurants and bars to meet payroll and other expenses. Individual businesses will be eligible for $5 million each.
- $15 billion for Emergency Injury Disaster Loans (a long-term, low-interest loan program of the Small Business Administration); priority for some funds would go to "severely impacted small businesses with fewer than 10 workers".
- An additional $7 billion for the Paycheck Protection Program, and an expansion of the eligibility criteria to some non-profit organizations previously excluded from the program.
- $3 billion for a payroll support program for aviation manufacturers. The industry itself will be responsible for funding half of the program, and the program will last six months.
- $1.25 billion in funding for the Shuttered Venue Operators Grant for music halls and other concert venues
- $175 million for a Community Navigator Program to reach out to eligible businesses.
- $350 billion to help state, local, and tribal governments bridge budget shortfalls and mitigate the fiscal shock.
- A total of $195 billion would be allocated among the states and the District of Columbia, and the tribes and territories would be allocated about $25 billion.
- The Act also allocates $60 billion to counties and $10 billion for a Coronavirus Capital Projects Fund. (The bill initially passed by the House would have instead allocated $65 billion to counties and $65 billion to municipalities, but the Senate formula was adopted instead).
- Education funding:
- $130 billion for K-12 schools, to safely reopen most schools within 100 days.
- The money for K-12 schools may be used to improve ventilation in school buildings, reduce class sizes to make social distancing possible, purchase personal protective equipment, and hire support staff.
- 20% of the school money must be directed to programs to help counteract "learning loss" from students who missed school during the pandemic.
- Almost $40 billion for colleges and universities.
- At least half of the money to colleges and universities must go to emergency grants to students.
- $130 billion for K-12 schools, to safely reopen most schools within 100 days.
- Funding for housing:
- $21.6 billion for rental assistance programs. This fund will provide money to states and local governments, which will then provide grants to eligible households. These grants can be used to pay for rental assistance as well as utility fees.
- $10 billion for the Homeowner Assistance Fund. This fund will allocate money to states and local governments, which will then give grants to homeowners to prevent them from defaulting on their mortgage or foreclosing on their home. These grants can also be used to pay for flood insurance premiums, HOA fees, utility bills, and any other necessary payments to prevent the homeowner from losing their home.
- $5 billion for the Section 8 Housing Choice Voucher Program. These funds must go to those who are or were recently homeless, as well as individuals who are escaping from domestic violence, sexual assault, or human trafficking.
- $5 billion to support state and local programs for the homeless and at-risk individuals. These funds can be used for rental assistance, housing counseling, and homelessness prevention services. Additionally, these grants can be used by state and local governments to buy and convert commercial properties into permanent shelters or affordable housing.
- $4.5 billion for the Low-Income Home Energy Assistance Program, which will assist homeowners with the costs of heating and cooling.
- $750 million for housing assistance for tribes and Native Hawaiians. These grants can be used by tribal nations or Native Hawaiians to pay rent or stay housed.
- $500 million in grants for low-income homes to help with water services.
- $139 million for rural housing assistance programs.
- $120 million for housing counseling services.
- The bill contains the following COVID-19 funding (including for COVID-19 vaccines, testing, and contact tracing) and other healthcare-related funding:
- $50 billion to the Federal Emergency Management Agency for vaccine distribution and assistance.
- $47.8 billion on COVID-19 testing, mitigation, and transmission prevention, including diagnosis, tracing, and monitoring.
- $13.48 billion for Department of Veterans Affairs healthcare programs through September 30, 2023.
- $10 billion under the Defense Production Act for personal protective equipment and other medical gear, and for response to pathogens that could become future public health emergencies.
- $7.66 billion for workforce programs for state, local, and territorial public health departments and certain nonprofits, including funds to hire and train the following:
- "case investigators,
- contact tracers,
- social support specialists,
- community health workers,
- public health nurses,
- disease intervention specialists,
- epidemiologists,
- program managers,
- laboratory personnel,
- informaticians,
- communication and policy experts,
- and any other positions as may be required to prevent, prepare for, and respond to COVID-19."
- $7.6 billion to community health centers and Federally Qualified Health Centers to combat COVID-19, including promotion, distribution, and administration of the COVID-19 vaccine; COVID-19 tracing and mitigation; COVID-19-related equipment; and COVID-19 outreach and education.
- $7.5 billion to the Centers for Disease Control and Prevention (CDC) for COVID-19 vaccine distribution, administration, and tracking, including preparation of community vaccination centers and mobile vaccine units and acceleration of vaccine deployment. The bill funds 100,000 public health workers for vaccination outreach and contact tracing.
- $6.05 billion for "expenses related to research, development, manufacturing, production and purchase of vaccines".
- $5.4 billion to the Indian Health Services.
- $3.5 billion in block grants to states, evenly split between the Community Mental Health Services Block Grant program and the Substance Abuse Prevention Treatment Block Grant program.
- $1.75 billion for genomic sequencing, analytics, and disease surveillance.
- $1 billion to the U.S. Department of Health and Human Services for vaccine confidence programs to increase vaccination rates.
- Approximately $750 million on global health security to fight COVID-19 and other emerging infectious diseases.
- $500 million to the Food and Drug Administration to evaluate vaccine performance and facilitate vaccine oversight and manufacturing.
- $330 million for teaching health centers with graduate medical education programs.
- $500 million to the CDC for public health surveillance and analytics, including a modernization of the U.S. disease warning system to predict COVID-19 "hot spots" and emerging public health threats.
- $200 million for nursing loan repayment programs.
- $100 million for the Medical Reserve Corps.
- $100 million for a Behavioral Health Workforce Education and Training Program.
- $80 million for mental and behavioral health training.
- $86 billion for a rescue package/bailout for approximately 185 multiemployer pension funds (usually pension plans set up by a union and industry) that are close to insolvency. The pension funds collectively cover 10.7 million workers.
- Transportation provisions
- $30.5 billion in grants to public transit and commuter rail agencies across the country to mitigate major decreases in ridership and fare revenue due to the COVID-19 pandemic. This includes $6 billion to the MTA (the U.S.'s largest public transit agency) and $1.4 billion to the WMATA, VRE and MARC.)
- $15 billion for airlines and airline contractors for a third extension of Payroll Support Program (which would otherwise have expired at the end of March 2021). The extension will prevent the furlough of more than 27,000 aviation employees.
- $8 billion for U.S. airports.
- $2 billion for Amtrak.
- $10.4 billion for agriculture and USDA, of which:
- $4 billion (39% of total agricultural expenditures) and $1 billion (9.7% of total agricultural expenditures) goes to debt forgiveness and outreach/support, respectively, for socially disadvantaged farmers. Experts identified the relief bill as the most important legislation for African-American farmers since the Civil Rights Act of 1964, benefiting many who were not fully compensated by the Pigford settlements.
- $3.6 billion (35% of total agricultural expenditures) for COVID-19 response (e.g., for agricultural and supply chain workers) and for the purchase and distribution of food.
- $800 million (7.7% of total agricultural expenditures) for Food for Peace.
- $500 million (4.8% of total agricultural expenditures) for USDA-administered Emergency Rural Development Grants for Rural Healthcare.
- $1.85 billion for cybersecurity funding as a response to the SolarWinds hack.
- $1 billion will go to the General Services Administration's Technology Modernization Fund which will help the federal government launch new cyber and information technology programs.
- $650 million will go to the Cybersecurity and Infrastructure Security Agency to improve its risk mitigation services.
- $200 million will go to the U.S. Digital Service.
- Changes to healthcare:
- Subsidizes 100% of premiums for COBRA recipients from April 1 to September 30, 2021. Due to these subsidies, at least 2.2 million additional people will enroll in COBRA in 2021.
- Temporary changes to ACA:
- Removing the welfare cliff by removing the income limit on premium subsidies. Instead, anyone can be eligible for premium subsidies if the cost of their premiums is more than 8.5% of their income. These subsidies will not affect rich households.
- Increasing subsidies that are already available to low-income households. An estimated 2.5 million uninsured people will get covered due to these changes. Additionally, about 3.4 million of the lowest income enrollees will see their premiums fall by 100%.
- Create a special rule whereby anyone who qualifies for unemployment automatically qualifies for the maximum amount of subsidies.
- Protect any ACA subsidy recipient from clawbacks due to income fluctuations in 2020.
- Medicaid and CHIP changes:
- Requires coverage of COVID-19 vaccines and treatment. Expands state options for COVID-19 testing for the uninsured.
- Allows states to give 12 months of post-partum coverage for new mothers.
- Introduce new incentives for states to expand Medicaid coverage.
Impact:
The bill's economic-relief provisions are overwhelmingly geared toward low-income and middle-class Americans, who will benefit from (among other provisions) the direct payments, the bill's expansion of low-income tax credits, child-care subsidies, expanded health-insurance access, extension of expanded unemployment benefits, food stamps, and rental assistance programs.
The bill contains little direct aid to high income-earners, who largely retained their jobs during the COVID-19 economic shock and bolstered their savings. Biden's administration crafted the plan in part because economic aid to lower-income and middle-income Americans (who are more likely to immediately spend funds on bills, groceries, and housing costs to avoid eviction or foreclosure) is more likely to stimulate the U.S. economy than aid to higher-earners (who are more likely to save the money).
The Institute on Taxation and Economic Policy found that the stimulus bill's direct payments, child tax credit expansion, and earned income tax credit expansion would boost the income of the poorest one-fifth of Americans by nearly $3,590. The Congressional Budget Office estimated that the bill's increase in health insurance subsidies would lead to 1.3 million previously uninsured Americans gaining health insurance coverage.
An analysis by Columbia University's Center on Poverty and Social Policy estimated that the original stimulus proposal would reduce overall U.S. poverty by a third, reduce child poverty by 57.8% and reduce the adult poverty rate by more than 25%. However these estimates relied in part upon a minimum wage increase that was not included in the final bill, meaning effects on poverty may be notably different then anticipated in that study.
The Tax Policy Center wrote that, for households making under $25,000, the bill would cut their taxes by an average of $2,800, which would boost their after-tax income by 20%.
Additionally, low-income households with children would see an average tax cut of about $7,700, and this would boost their after-tax income by 35%. Middle-income households will also see an average tax cut of about $3,350, and this would increase their after-tax income by 5.5%. Overall, about 70% of the bill's tax benefits will go to households making under $91,000.
Reactions:
Congress:
In a deeply polarized Congress, the relief package received universal support from Democrats and universal opposition from Republicans, passing on party-line votes.
Some House Democratic progressives expressed disappointment with some changes to the relief package made in the Senate (such as the dropping of the $15 minimum wage) to win over moderate Democratic support, but continued to support the package.
Republicans in Congress opposed the bill, but failed to unify around a specific critique other than calling it "ultraprogressive" or "bloated," and falsely claiming the bill only benefitted Democratic-led states.
While debates and negotiations over the stimulus package were on-going, Republicans focused instead on culture war issues unrelated to government actions, such as the decision by the Dr. Seuss estate to stop publishing a racially incendiary Dr. Seuss book and the re-branding of the "Mr. Potato Head" toy.
Many of the provisions in the bill were also included in stimulus legislation passed with Republican support under the Trump administration, making it difficult for Republicans to argue against them. After Congress passed the bill, Senator Roger Wicker (R-MS) highlighted on social media that the bill awarded $28.6 billion of "targeted relief" for "independent restaurant operators" to "survive the pandemic".
In that social media post, Wicker neglected to mention that he had in fact voted against the bill.
President Biden:
President Joe Biden advocated for fast-tracking the stimulus package with optimally bipartisan support. In early February 2021, Biden criticized Republicans for not seeking a bipartisan compromise on a final aid bill, and said the Republicans were wilfully obstructing his proposal.
At the time, Biden signaled openness to passing the legislation without any support from congressional Republicans. Biden stated that he could not, "in good conscience," make concessions to Republicans who he said propose to either "do nothing or not enough" as Republicans complain Biden is forsaking his promises on bipartisanship and unity.
Furthermore, Biden noted that "[a]ll of a sudden, many of them have rediscovered fiscal restraint and the concern for the deficits" whereas in the Trump administration Republicans had passed trillions in dollars in tax cuts and mostly corporate aid for the coronavirus crisis, adding trillions of dollars to the national debt without much reservation.
Others:
Republican mayors such as Jerry Dyer of Fresno, Francis X. Suarez of Miami, David Holt of Oklahoma City, and Betsy Price of Fort Worth, Texas expressed their support for the plan. Dyer told the Washington Post that "It’s not a Republican issue or a Democrat issue. It’s a public health issue. It’s an economic issue. And it’s a public safety issue."
Over 150 CEOs of major companies expressed support for the Biden stimulus plan in a letter and urged Congress to pass it.
A broad range of advocacy and interest groups praised the bill, including:
- local government groups (National Association of Counties and U.S. Conference of Mayors);
- business associations:
- education organizations:
- organized labor (the AFL-CIO and AFSCME);
- healthcare organizations:
- the American Public Transportation Association,
- the civil rights groups UnidosUS,
- Feeding America,
- the American Hotel & Lodging Association,
- the Main Street Alliance, the U.S. Travel Association,
- the American Hospital Association,
- the Association of American Medical Colleges,
- and the National Council of Nonprofits praised the bill, but said that additional relief would be necessary.
The Business Roundtable, U.S. Chamber of Commerce, and Committee for a Responsible Federal Budget called for a smaller and more targeted package.
Several observers have noted that the stimulus greatly increases the role of the government in fighting poverty in the United States, to an extent not seen since Lyndon Johnson's Great Society in the 1960s; accordingly some have seen it as evidence that the United States is moving towards social democracy and away from the "government is the problem" consensus in place since the 1980s.
Public opinion:
The stimulus plan had broad public support. A February 11 Newsweek/Harris X poll showed that 60% of Republican voters expressed support for the stimulus plan and a poll from Quinnipiac University found that 68% of Americans support it.
A Morning Consult/Politico poll showed that 76% of voters, including 60% of Republicans and 89% of Democrats, supported the bill.
A Monmouth University poll found that 62% of Americans approve of the stimulus package, with 92% of Democrats, 56% of independents, and 33% of Republicans supporting the legislation.
CBS News released a poll on March 12, which showed that 75% of Americans approved the stimulus bill, including 77% of independents, 46% of Republicans, and 94% of Democrats.
See also:
- List of COVID-19 pandemic legislation
- COVID-19 pandemic in the United States
- Coronavirus Preparedness and Response Supplemental Appropriations Act, 2020
- Families First Coronavirus Response Act
- Coronavirus Aid, Relief, and Economic Security Act (CARES Act) – includes $1200 stimulus checks
- Paycheck Protection Program and Health Care Enhancement Act
- Paycheck Protection Program Flexibility Act of 2020
- A bill to extend the authority for commitments for the paycheck protection program
- Consolidated Appropriations Act, 2021 – includes $600 stimulus checks
- Media related to American Rescue Plan at Wikimedia Commons
- US President Biden signs US$1.9 trillion COVID-19 relief package at Wikinews
- Works related to Remarks by President Biden on the American Rescue Plan and Signing of Executive Orders at Wikisource
- Works related to The Economics of the American Rescue Plan at Wikisource
- Works related to American Rescue Plan Fact Sheet at Wikisource
Macroeconomics vs. MicroeconomicsPictured below: Microeconomics vs. Macroeconomics - Concept, Difference, Micro & Macro Economic Interdependence: see also first Youtube Video above
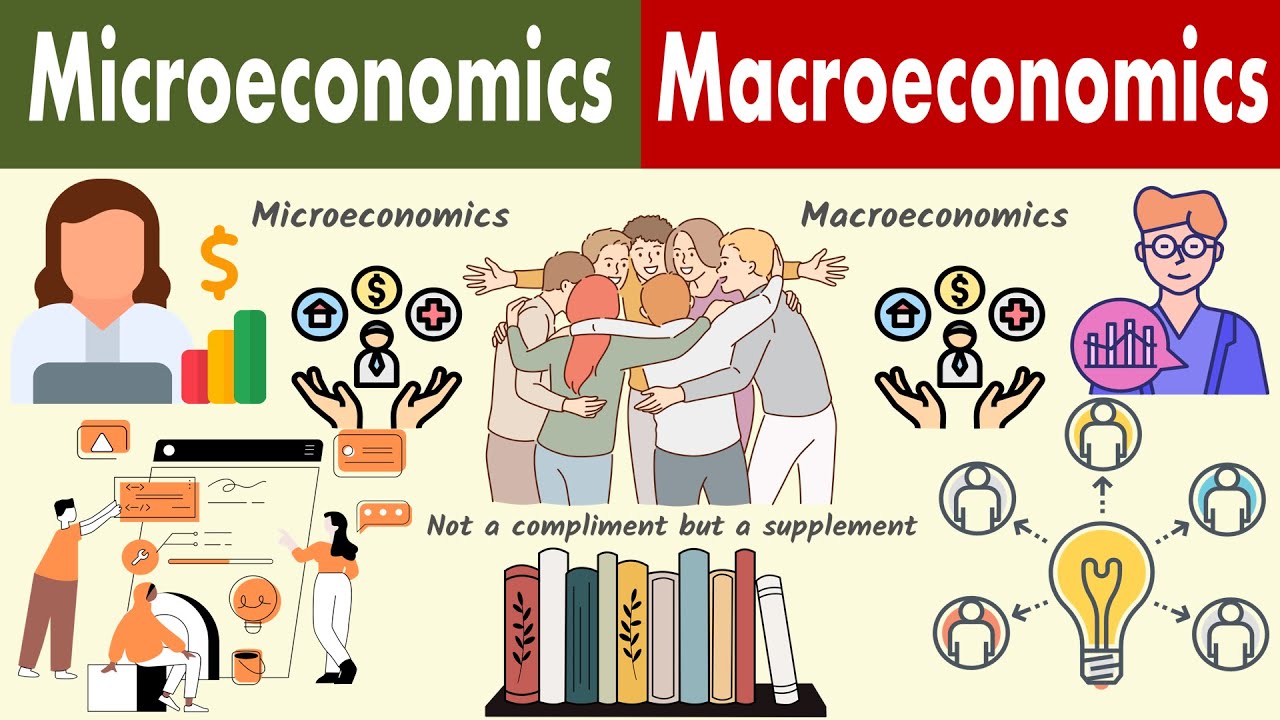
Macroeconomics:
Macroeconomics is a branch of economics that deals with the performance, structure, behavior, and decision-making of an economy as a whole—for example, using interest rates, taxes, and government spending to regulate an economy's growth and stability. This includes regional, national, and global economies.
Macroeconomists study topics such as:
Macroeconomics and microeconomics are the two most general fields in economics. The United Nations Sustainable Development Goal 17 has a target to enhance global macroeconomic stability through policy coordination and coherence as part of the 2030 Agenda.
According to a 2018 assessment by economists Emi Nakamura and Jón Steinsson, economic "evidence regarding the consequences of different macroeconomic policies is still highly imperfect and open to serious criticism."
Development:
Main article: History of macroeconomic thought
Origins:
Macroeconomics descended from the once divided fields of business cycle theory and monetary theory. The quantity theory of money was particularly influential prior to World War II. It took many forms, including the version based on the work of Irving Fisher:
M*V = P*Q
In the typical view of the quantity theory, money velocity (V) and the quantity of goods produced (Q) would be constant, so any increase in money supply (M) would lead to a direct increase in price level (P). The quantity theory of money was a central part of the classical theory of the economy that prevailed in the early twentieth century.
Austrian School:
Ludwig von Mises's work Theory of Money and Credit, published in 1912, was one of the first books from the Austrian School to deal with macroeconomic topics.
Keynes and his followers:
Macroeconomics, at least in its modern form, began with the publication of General Theory of Employment, Interest and Money written by John Maynard Keynes. When the Great Depression struck, classical economists had difficulty explaining how goods could go unsold and workers could be left unemployed.
In classical theory, prices and wages would drop until the market cleared, and all goods and labor were sold. Keynes offered a new theory of economics that explained why markets might not clear, which would evolve (later in the 20th century) into a group of macroeconomic schools of thought known as Keynesian economics – also called Keynesianism or Keynesian theory.
In Keynes' theory, the quantity theory broke down because people and businesses tend to hold on to their cash in tough economic times – a phenomenon he described in terms of liquidity preferences. Keynes also explained how the multiplier effect would magnify a small decrease in consumption or investment and cause declines throughout the economy.
Keynes also noted the role uncertainty and animal spirits can play in the economy.
The generation following Keynes combined the macroeconomics of the General Theory with neoclassical microeconomics to create the neoclassical synthesis. By the 1950s, most economists had accepted the synthesis view of the macroeconomy. Economists like Paul Samuelson, Franco Modigliani, James Tobin, and Robert Solow developed formal Keynesian models and contributed formal theories of consumption, investment, and money demand that fleshed out the Keynesian framework.
Monetarism:
Milton Friedman updated the quantity theory of money to include a role for money demand.
He argued that the role of money in the economy was sufficient to explain the Great Depression, and that aggregate demand oriented explanations were not necessary. Friedman also argued that monetary policy was more effective than fiscal policy; however, Friedman doubted the government's ability to "fine-tune" the economy with monetary policy.
He generally favored a policy of steady growth in money supply instead of frequent intervention.
Friedman also challenged the Phillips curve relationship between inflation and unemployment. Friedman and Edmund Phelps (who was not a monetarist) proposed an "augmented" version of the Phillips curve that excluded the possibility of a stable, long-run tradeoff between inflation and unemployment.
When the oil shocks of the 1970s created a high unemployment and high inflation, Friedman and Phelps were vindicated. Monetarism was particularly influential in the early 1980s.
Monetarism fell out of favor when central banks found it difficult to target money supply instead of interest rates as monetarists recommended. Monetarism also became politically unpopular when the central banks created recessions in order to slow inflation.
New classical:
New classical macroeconomics further challenged the Keynesian school. A central development in new classical thought came when Robert Lucas introduced rational expectations to macroeconomics. Prior to Lucas, economists had generally used adaptive expectations where agents were assumed to look at the recent past to make expectations about the future.
Under rational expectations, agents are assumed to be more sophisticated. A consumer will not simply assume a 2% inflation rate just because that has been the average the past few years; they will look at current monetary policy and economic conditions to make an informed forecast. When new classical economists introduced rational expectations into their models, they showed that monetary policy could only have a limited impact.
Lucas also made an influential critique of Keynesian empirical models. He argued that forecasting models based on empirical relationships would keep producing the same predictions even as the underlying model generating the data changed. He advocated models based on fundamental economic theory that would, in principle, be structurally accurate as economies changed.
Following Lucas's critique, new classical economists, led by Edward C. Prescott and Finn E. Kydland, created real business cycle (RB C) models of the macro economy.
RB C models were created by combining fundamental equations from neo-classical microeconomics. In order to generate macroeconomic fluctuations, RB C models explained recessions and unemployment with changes in technology instead of changes in the markets for goods or money. Critics of RB C models argue that money clearly plays an important role in the economy, and the idea that technological regress can explain recent recessions is implausible.
However, technological shocks are only the more prominent of a myriad of possible shocks to the system that can be modeled. Despite questions about the theory behind RB C models, they have clearly been influential in economic methodology.
New Keynesian response:
New Keynesian economists responded to the new classical school by adopting rational expectations and focusing on developing micro-founded models that are immune to the Lucas critique. Stanley Fischer and John B. Taylor produced early work in this area by showing that monetary policy could be effective even in models with rational expectations when contracts locked in wages for workers.
Other new Keynesian economists, including Olivier Blanchard, Julio Rotemberg, Greg Mankiw, David Romer, and Michael Woodford, expanded on this work and demonstrated other cases where inflexible prices and wages led to monetary and fiscal policy having real effects.
Like classical models, new classical models had assumed that prices would be able to adjust perfectly and monetary policy would only lead to price changes. New Keynesian models investigated sources of sticky prices and wages due to imperfect competition, which would not adjust, allowing monetary policy to impact quantities instead of prices.
By the late 1990s, economists had reached a rough consensus. The nominal rigidity of new Keynesian theory was combined with rational expectations and the RBC methodology to produce dynamic stochastic general equilibrium (DSGE) models. The fusion of elements from different schools of thought has been dubbed the new neoclassical synthesis. These models are now used by many central banks and are a core part of contemporary macroeconomics.
New Keynesian economics, which developed partly in response to new classical economics, strives to provide microeconomic foundations to Keynesian economics by showing how imperfect markets can justify demand management.
Pictured below:
Production and national income: Macroeconomics takes a big-picture view of the entire economy, including examining the roles of, and relationships between, corporations, governments and households, and the different types of markets, such as the financial market and the labour market. However, the use of natural resources and the generation of waste (like greenhouse gases) are often excluded in its models.
Macroeconomics is a branch of economics that deals with the performance, structure, behavior, and decision-making of an economy as a whole—for example, using interest rates, taxes, and government spending to regulate an economy's growth and stability. This includes regional, national, and global economies.
Macroeconomists study topics such as:
- GDP (Gross Domestic Product),
- unemployment (including unemployment rates),
- national income,
- price indices,
- output,
- consumption,
- inflation,
- saving,
- investment,
- energy,
- international trade,
- and international finance.
Macroeconomics and microeconomics are the two most general fields in economics. The United Nations Sustainable Development Goal 17 has a target to enhance global macroeconomic stability through policy coordination and coherence as part of the 2030 Agenda.
According to a 2018 assessment by economists Emi Nakamura and Jón Steinsson, economic "evidence regarding the consequences of different macroeconomic policies is still highly imperfect and open to serious criticism."
Development:
Main article: History of macroeconomic thought
Origins:
Macroeconomics descended from the once divided fields of business cycle theory and monetary theory. The quantity theory of money was particularly influential prior to World War II. It took many forms, including the version based on the work of Irving Fisher:
M*V = P*Q
In the typical view of the quantity theory, money velocity (V) and the quantity of goods produced (Q) would be constant, so any increase in money supply (M) would lead to a direct increase in price level (P). The quantity theory of money was a central part of the classical theory of the economy that prevailed in the early twentieth century.
Austrian School:
Ludwig von Mises's work Theory of Money and Credit, published in 1912, was one of the first books from the Austrian School to deal with macroeconomic topics.
Keynes and his followers:
Macroeconomics, at least in its modern form, began with the publication of General Theory of Employment, Interest and Money written by John Maynard Keynes. When the Great Depression struck, classical economists had difficulty explaining how goods could go unsold and workers could be left unemployed.
In classical theory, prices and wages would drop until the market cleared, and all goods and labor were sold. Keynes offered a new theory of economics that explained why markets might not clear, which would evolve (later in the 20th century) into a group of macroeconomic schools of thought known as Keynesian economics – also called Keynesianism or Keynesian theory.
In Keynes' theory, the quantity theory broke down because people and businesses tend to hold on to their cash in tough economic times – a phenomenon he described in terms of liquidity preferences. Keynes also explained how the multiplier effect would magnify a small decrease in consumption or investment and cause declines throughout the economy.
Keynes also noted the role uncertainty and animal spirits can play in the economy.
The generation following Keynes combined the macroeconomics of the General Theory with neoclassical microeconomics to create the neoclassical synthesis. By the 1950s, most economists had accepted the synthesis view of the macroeconomy. Economists like Paul Samuelson, Franco Modigliani, James Tobin, and Robert Solow developed formal Keynesian models and contributed formal theories of consumption, investment, and money demand that fleshed out the Keynesian framework.
Monetarism:
Milton Friedman updated the quantity theory of money to include a role for money demand.
He argued that the role of money in the economy was sufficient to explain the Great Depression, and that aggregate demand oriented explanations were not necessary. Friedman also argued that monetary policy was more effective than fiscal policy; however, Friedman doubted the government's ability to "fine-tune" the economy with monetary policy.
He generally favored a policy of steady growth in money supply instead of frequent intervention.
Friedman also challenged the Phillips curve relationship between inflation and unemployment. Friedman and Edmund Phelps (who was not a monetarist) proposed an "augmented" version of the Phillips curve that excluded the possibility of a stable, long-run tradeoff between inflation and unemployment.
When the oil shocks of the 1970s created a high unemployment and high inflation, Friedman and Phelps were vindicated. Monetarism was particularly influential in the early 1980s.
Monetarism fell out of favor when central banks found it difficult to target money supply instead of interest rates as monetarists recommended. Monetarism also became politically unpopular when the central banks created recessions in order to slow inflation.
New classical:
New classical macroeconomics further challenged the Keynesian school. A central development in new classical thought came when Robert Lucas introduced rational expectations to macroeconomics. Prior to Lucas, economists had generally used adaptive expectations where agents were assumed to look at the recent past to make expectations about the future.
Under rational expectations, agents are assumed to be more sophisticated. A consumer will not simply assume a 2% inflation rate just because that has been the average the past few years; they will look at current monetary policy and economic conditions to make an informed forecast. When new classical economists introduced rational expectations into their models, they showed that monetary policy could only have a limited impact.
Lucas also made an influential critique of Keynesian empirical models. He argued that forecasting models based on empirical relationships would keep producing the same predictions even as the underlying model generating the data changed. He advocated models based on fundamental economic theory that would, in principle, be structurally accurate as economies changed.
Following Lucas's critique, new classical economists, led by Edward C. Prescott and Finn E. Kydland, created real business cycle (RB C) models of the macro economy.
RB C models were created by combining fundamental equations from neo-classical microeconomics. In order to generate macroeconomic fluctuations, RB C models explained recessions and unemployment with changes in technology instead of changes in the markets for goods or money. Critics of RB C models argue that money clearly plays an important role in the economy, and the idea that technological regress can explain recent recessions is implausible.
However, technological shocks are only the more prominent of a myriad of possible shocks to the system that can be modeled. Despite questions about the theory behind RB C models, they have clearly been influential in economic methodology.
New Keynesian response:
New Keynesian economists responded to the new classical school by adopting rational expectations and focusing on developing micro-founded models that are immune to the Lucas critique. Stanley Fischer and John B. Taylor produced early work in this area by showing that monetary policy could be effective even in models with rational expectations when contracts locked in wages for workers.
Other new Keynesian economists, including Olivier Blanchard, Julio Rotemberg, Greg Mankiw, David Romer, and Michael Woodford, expanded on this work and demonstrated other cases where inflexible prices and wages led to monetary and fiscal policy having real effects.
Like classical models, new classical models had assumed that prices would be able to adjust perfectly and monetary policy would only lead to price changes. New Keynesian models investigated sources of sticky prices and wages due to imperfect competition, which would not adjust, allowing monetary policy to impact quantities instead of prices.
By the late 1990s, economists had reached a rough consensus. The nominal rigidity of new Keynesian theory was combined with rational expectations and the RBC methodology to produce dynamic stochastic general equilibrium (DSGE) models. The fusion of elements from different schools of thought has been dubbed the new neoclassical synthesis. These models are now used by many central banks and are a core part of contemporary macroeconomics.
New Keynesian economics, which developed partly in response to new classical economics, strives to provide microeconomic foundations to Keynesian economics by showing how imperfect markets can justify demand management.
Pictured below:
Production and national income: Macroeconomics takes a big-picture view of the entire economy, including examining the roles of, and relationships between, corporations, governments and households, and the different types of markets, such as the financial market and the labour market. However, the use of natural resources and the generation of waste (like greenhouse gases) are often excluded in its models.
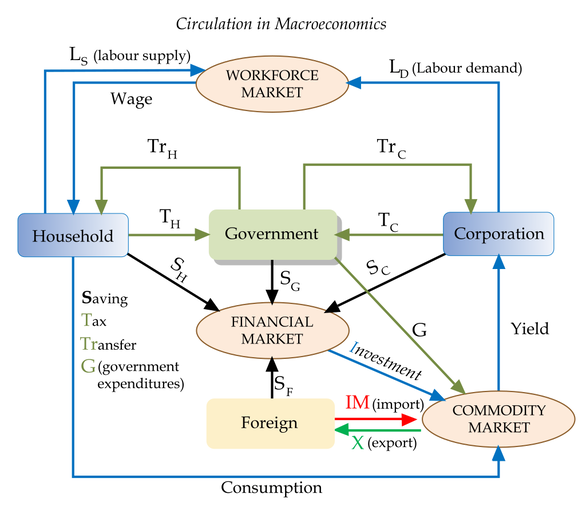
Macroeconomic models:
Aggregate demand–aggregate supply:
The AD-AS model has become the standard textbook model for explaining the macroeconomy. This model shows the price level and level of real output given the equilibrium in aggregate demand and aggregate supply.
The aggregate demand curve's downward slope means that more output is demanded at lower price levels.
The downward slope is the result of three effects:
In the conventional Keynesian use of the AS-AD model, the aggregate supply curve is horizontal at low levels of output and becomes inelastic near the point of potential output, which corresponds with full employment. Since the economy cannot produce beyond the potential output, any AD expansion will lead to higher price levels instead of higher output.
The AD–AS diagram can model a variety of macroeconomic phenomena, including inflation. Changes in the non-price level factors or determinants cause changes in aggregate demand and shifts of the entire aggregate demand (AD) curve.
When demand for goods exceeds supply, there is an inflationary gap where demand-pull inflation occurs and the AD curve shifts upward to a higher price level. When the economy faces higher costs, cost-push inflation occurs and the AS curve shifts upward to higher price levels. The AS–AD diagram is also widely used as an instructive tool to model the effects of various macroeconomic policies.
Macro economics also deals with study of GDP (gross domestic product) employment, inflation.
IS-LM:
The IS–LM model gives the underpinnings of aggregate demand (itself discussed above). It answers the question "At any given price level, what is the quantity of goods demanded?".
This model shows what combination of interest rates and output will ensure equilibrium in both the goods and money markets. The goods market is modeled as giving equality between investment and public and private saving (IS), and the money market is modeled as giving equilibrium between the money supply and liquidity preference.
The IS curve consists of the points (combinations of income and interest rate) where investment, given the interest rate, is equal to public and private saving, given output.
The IS curve is downward sloping because output and the interest rate have an inverse relationship in the goods market: as output increases, more income is saved, which means interest rates must be lower to spur enough investment to match saving.
The LM curve is upward sloping because the interest rate and output have a positive relationship in the money market: as income (identically equal to output) increases, the demand for money increases, resulting in a rise in the interest rate in order to just offset the incipient rise in money demand.
The IS-LM model is often used to demonstrate the effects of monetary and fiscal policy. Textbooks frequently use the IS-LM model, but it does not feature the complexities of most modern macroeconomic models. Nevertheless, these models still feature similar relationships to those in IS-LM.
Growth models:
The neoclassical growth model of Robert Solow has become a common textbook model for explaining economic growth in the long-run. The model begins with a production function where national output is the product of two inputs: capital and labor. The Solow model assumes that labor and capital are used at constant rates without the fluctuations in unemployment and capital utilization commonly seen in business cycles.
An increase in output, or economic growth, can only occur because of an increase in the capital stock, a larger population, or technological advancements that lead to higher productivity (total factor productivity). An increase in the savings rate leads to a temporary increase as the economy creates more capital, which adds to output.
However, eventually the depreciation rate will limit the expansion of capital: savings will be used up replacing depreciated capital, and no savings will remain to pay for an additional expansion in capital. Solow's model suggests that economic growth in terms of output per capita depends solely on technological advances that enhance productivity.
In the 1980s and 1990s endogenous growth theory arose to challenge neoclassical growth theory. This group of models explains economic growth through other factors, such as increasing returns to scale for capital and learning-by-doing, that are endogenously determined instead of the exogenous technological improvement used to explain growth in Solow's model.
The quantity theory by Russian economist Vladimir Pokrovskii explains growth as a consequence of the dynamics of three factors, among them capital service as one of independent production factors in line with labour and capital.
Capital service as production factor was interpreted by Ayres and Warr as useful work of production equipment, which makes it possible to reproduce historical rates of economic growth with considerable precision and without recourse to exogenous and unexplained technological progress, thereby overcoming the major flaw of the Solow theory of economic growth.
Humanity's economic system as a subsystem of the global environment:
In the macroeconomic models in ecological economics, the economic system is a subsystem of the environment. In this model, the circular flow of income diagram is replaced in ecological economics by a more complex flow diagram reflecting the input of solar energy, which sustains natural inputs and environmental services which are then used as units of production.
Once consumed, natural inputs pass out of the economy as pollution and waste. The potential of an environment to provide services and materials is referred to as an "environment's source function", and this function is depleted as resources are consumed or pollution contaminates the resources.
The "sink function" describes an environment's ability to absorb and render harmless waste and pollution: when waste output exceeds the limit of the sink function, long-term damage occurs.
Some persistent pollutants, such as some organic pollutants and nuclear waste are absorbed very slowly or not at all; ecological economists emphasize minimizing "cumulative pollutants". Pollutants affect human health and the health of the ecosystem.
Basic macroeconomic concepts:
Macroeconomics encompasses a variety of concepts and variables, but there are three central topics for macroeconomic research. Macroeconomic theories usually relate the phenomena of output, unemployment, and inflation. Outside of macroeconomic theory, these topics are also important to all economic agents including workers, consumers, and producers.
Output and income:
National output is the total amount of everything a country produces in a given period of time. Everything that is produced and sold generates an equal amount of income. The total output of the economy is measured GDP per person.
The output and income are usually considered equivalent and the two terms are often used interchangeably, output changes into income. Output can be measured or it can be viewed from the production side and measured as the total value of final goods and services or the sum of all value added in the economy.
Macroeconomic output is usually measured by gross domestic product (GDP) or one of the other national accounts. Economists interested in long-run increases in output, study economic growth. Advances in technology, accumulation of machinery and other capital, and better education and human capital, are all factors that lead to increase economic output over time.
However, output does not always increase consistently over time. Business cycles can cause short-term drops in output called recessions. Economists look for macroeconomic policies that prevent economies from slipping into recessions, and that lead to faster long-term growth.
Unemployment:
Main article: Unemployment
The amount of unemployment in an economy is measured by the unemployment rate, i.e. the percentage of workers without jobs in the labor force. The unemployment rate in the labor force only includes workers actively looking for jobs. People who are retired, pursuing education, or discouraged from seeking work by a lack of job prospects are excluded.
Unemployment can be generally broken down into several types that are related to different causes:
Inflation and deflation:
A general price increase across the entire economy is called inflation. When prices decrease, there is deflation. Economists measure these changes in prices with price indexes. Inflation can occur when an economy becomes overheated and grows too quickly. Similarly, a declining economy can lead to deflation.
Central bankers, who manage a country's money supply, try to avoid changes in price level by using monetary policy. Raising interest rates or reducing the supply of money in an economy is posited to reduce inflation. Inflation can lead to increased uncertainty and other negative consequences.
Deflation can lower economic output. Central bankers try to stabilize prices to protect economies from the negative consequences of price changes.
Changes in price level may be the result of several factors. The quantity theory of money holds that changes in price level are directly related to changes in the money supply. Most economists believe that this relationship explains long-run changes in the price level.
Short-run fluctuations may also be related to monetary factors, but changes in aggregate demand and aggregate supply can also influence price level. For example, a decrease in demand due to a recession can lead to lower price levels and deflation. A negative supply shock, such as an oil crisis, lowers aggregate supply and can cause inflation.
Macroeconomic policy:
Macroeconomic policy is usually implemented through two sets of tools: fiscal and monetary policy. Both forms of policy are used to stabilize the economy, which can mean boosting the economy to the level of GDP consistent with full employment. Macroeconomic policy focuses on limiting the effects of the business cycle to achieve the economic goals of price stability, full employment, and growth.
According to a 2018 assessment by economists Emi Nakamura and Jón Steinsson, economic "evidence regarding the consequences of different macroeconomic policies is still highly imperfect and open to serious criticism." Nakamura and Steinsson write that macroeconomics struggles with long-term predictions, which is a result of the high complexity of the systems it studies.
Monetary policy:
Further information: Monetary policy
Central banks implement monetary policy by controlling the money supply through several mechanisms. Typically, central banks take action by issuing money to buy bonds (or other assets), which boosts the supply of money and lowers interest rates, or, in the case of contractionary monetary policy, banks sell bonds and take money out of circulation. Usually policy is not implemented by directly targeting the supply of money.
Central banks continuously shift the money supply to maintain a targeted fixed interest rate. Some of them allow the interest rate to fluctuate and focus on targeting inflation rates instead. Central banks generally try to achieve high output without letting loose monetary policy that create large amounts of inflation.
Conventional monetary policy can be ineffective in situations such as a liquidity trap. When interest rates and inflation are near zero, the central bank cannot loosen monetary policy through conventional means.
Central banks can use unconventional monetary policy such as quantitative easing to help increase output. Instead of buying government bonds, central banks can implement quantitative easing by buying not only government bonds, but also other assets such as corporate bonds, stocks, and other securities. This allows lower interest rates for a broader class of assets beyond government bonds.
In another example of unconventional monetary policy, the United States Federal Reserve recently made an attempt at such a policy with Operation Twist. Unable to lower current interest rates, the Federal Reserve lowered long-term interest rates by buying long-term bonds and selling short-term bonds to create a flat yield curve.
'The difference between Macroeconomics and Microeconomics'
In addition, economists consider two areas. Macroeconomics in the broad sense is interested in the operation of the economy as a whole. It investigates topics like employment, GDP, and inflation—material for news articles and discussions of national policy.
Small-scale microeconomics is interested in the interactions between supply and demand in particular marketplaces for commodities and services.
The focus of macroeconomics is often on a country and how its markets interact to produce large-scale phenomena that economists refer to as aggregate variables. A single market is the focus of analysis in the field of microeconomics, such as whether changes in supply or demand are to blame for price increases in the oil and automotive sectors.
Macroeconomics frequently examines the role that the government plays in promoting general economic growth or managing inflation, for instance. Because trade, investment, and capital movements connect home markets to markets abroad, macroeconomics frequently touches on the global scale.
However, microeconomics can also involve other countries. Single markets are sometimes not limited to a single nation; the world market for oil is a prime example.
From introductory classes in "principles of economics" through doctoral studies, the macro/micro divide is institutionalized in the field of economics. Most economists identify as either macro- or micro-economists. Several new scholarly publications have just been launched by the American Economic Association. The first is microeconomics. Another is named Macroeconomics, which is apart from each other.
While Consumer demand theory, production theory (also known as the theory of the firm), and related topics such as the nature of market competition, economic welfare, and the role of imperfect information in economic outcomes are divided into microeconomics, which examines the behavior of individual consumers and firms.
At its most abstract level, general equilibrium, which deals with multiple markets at once, is also a subset of microeconomics. Microeconomic analysis makes up the majority of economic analysis. It is rich with principles that are applicable in the real world and addresses topics like the impact of minimum wages, taxes, price supports, or monopolies on certain markets.
The field of commerce, industrial organization and market structure, labor economics, public finance, and welfare economics are all areas in which it is used. Microeconomic analysis sheds light on such varied endeavors as firm creation.
It is harder to understand macroeconomics. It describes the connections between large aggregates that are difficult to comprehend, such the amount of national income, savings, and prices in general. The study of long-term national economic growth, the analysis of short-term deviations from equilibrium, and the creation of policies to stabilize the national economy—that is, to reduce volatility in growth and prices—are the traditional divisions of this area.
These measures can be taken by the government through taxation and expenditure or by the central bank through monetary policy.
Fiscal policy:
Further information: Fiscal policy
Fiscal policy is the use of government's revenue and expenditure as instruments to influence the economy. Examples of such tools are expenditure, taxes, and debt.
For example, if the economy is producing less than potential output, government spending can be used to employ idle resources and boost output. Government spending does not have to make up for the entire output gap.
There is a multiplier effect that boosts the impact of government spending. For instance, when the government pays for a bridge, the project not only adds the value of the bridge to output, but also allows the bridge workers to increase their consumption and investment, which helps to close the output gap.
The effects of fiscal policy can be limited by crowding out. When the government takes on spending projects, it limits the amount of resources available for the private sector to use.
Crowding out occurs when government spending simply replaces private sector output instead of adding additional output to the economy. Crowding out also occurs when government spending raises interest rates, which limits investment. Defenders of fiscal stimulus argue that crowding out is not a concern when the economy is depressed, plenty of resources are left idle, and interest rates are low.
Fiscal policy can be implemented through automatic stabilizers. Automatic stabilizers do not suffer from the policy lags of discretionary fiscal policy. Automatic stabilizers use conventional fiscal mechanisms but take effect as soon as the economy takes a downturn: spending on unemployment benefits automatically increases when unemployment rises and, in a progressive income tax system, the effective tax rate automatically falls when incomes decline.
Comparison:
Economists usually favor monetary over fiscal policy because it has two major advantages.
First, monetary policy is generally implemented by independent central banks instead of the political institutions that control fiscal policy. Independent central banks are less likely to make decisions based on political motives.
Second, monetary policy suffers shorter inside lags and outside lags than fiscal policy.
Additionally, central banks are able to make quick decisions with rapid implementation. Whereas fiscal policy will most likely move slowly through government bureaucracy and take longer to fully implement into the economy.
See also:
Microeconomics
Picture below: Microeconomics Definition -- Microeconomics is a ‘bottom-up’ approach where patterns from everyday life are pieced together to correlate demand and supply. The study examines how the behaviors of individuals, households, and firms have an impact on the market.
Microeconomics is entirely contradictory to macroeconomics. It is a narrower concept that focuses only on a single market or segment. This study only interprets the tiny components of the economy. The study states that the market attains equilibrium when the supply of goods controls the demand.
Click here for the Table of contents for courses about Microeconomics
Aggregate demand–aggregate supply:
The AD-AS model has become the standard textbook model for explaining the macroeconomy. This model shows the price level and level of real output given the equilibrium in aggregate demand and aggregate supply.
The aggregate demand curve's downward slope means that more output is demanded at lower price levels.
The downward slope is the result of three effects:
- the Pigou or real balance effect, which states that as real prices fall, real wealth increases, resulting in higher consumer demand of goods;
- the Keynes or interest rate effect, which states that as prices fall, the demand for money decreases, causing interest rates to decline and borrowing for investment and consumption to increase;
- and the net export effect, which states that as prices rise, domestic goods become comparatively more expensive to foreign consumers, leading to a decline in exports.
In the conventional Keynesian use of the AS-AD model, the aggregate supply curve is horizontal at low levels of output and becomes inelastic near the point of potential output, which corresponds with full employment. Since the economy cannot produce beyond the potential output, any AD expansion will lead to higher price levels instead of higher output.
The AD–AS diagram can model a variety of macroeconomic phenomena, including inflation. Changes in the non-price level factors or determinants cause changes in aggregate demand and shifts of the entire aggregate demand (AD) curve.
When demand for goods exceeds supply, there is an inflationary gap where demand-pull inflation occurs and the AD curve shifts upward to a higher price level. When the economy faces higher costs, cost-push inflation occurs and the AS curve shifts upward to higher price levels. The AS–AD diagram is also widely used as an instructive tool to model the effects of various macroeconomic policies.
Macro economics also deals with study of GDP (gross domestic product) employment, inflation.
IS-LM:
The IS–LM model gives the underpinnings of aggregate demand (itself discussed above). It answers the question "At any given price level, what is the quantity of goods demanded?".
This model shows what combination of interest rates and output will ensure equilibrium in both the goods and money markets. The goods market is modeled as giving equality between investment and public and private saving (IS), and the money market is modeled as giving equilibrium between the money supply and liquidity preference.
The IS curve consists of the points (combinations of income and interest rate) where investment, given the interest rate, is equal to public and private saving, given output.
The IS curve is downward sloping because output and the interest rate have an inverse relationship in the goods market: as output increases, more income is saved, which means interest rates must be lower to spur enough investment to match saving.
The LM curve is upward sloping because the interest rate and output have a positive relationship in the money market: as income (identically equal to output) increases, the demand for money increases, resulting in a rise in the interest rate in order to just offset the incipient rise in money demand.
The IS-LM model is often used to demonstrate the effects of monetary and fiscal policy. Textbooks frequently use the IS-LM model, but it does not feature the complexities of most modern macroeconomic models. Nevertheless, these models still feature similar relationships to those in IS-LM.
Growth models:
The neoclassical growth model of Robert Solow has become a common textbook model for explaining economic growth in the long-run. The model begins with a production function where national output is the product of two inputs: capital and labor. The Solow model assumes that labor and capital are used at constant rates without the fluctuations in unemployment and capital utilization commonly seen in business cycles.
An increase in output, or economic growth, can only occur because of an increase in the capital stock, a larger population, or technological advancements that lead to higher productivity (total factor productivity). An increase in the savings rate leads to a temporary increase as the economy creates more capital, which adds to output.
However, eventually the depreciation rate will limit the expansion of capital: savings will be used up replacing depreciated capital, and no savings will remain to pay for an additional expansion in capital. Solow's model suggests that economic growth in terms of output per capita depends solely on technological advances that enhance productivity.
In the 1980s and 1990s endogenous growth theory arose to challenge neoclassical growth theory. This group of models explains economic growth through other factors, such as increasing returns to scale for capital and learning-by-doing, that are endogenously determined instead of the exogenous technological improvement used to explain growth in Solow's model.
The quantity theory by Russian economist Vladimir Pokrovskii explains growth as a consequence of the dynamics of three factors, among them capital service as one of independent production factors in line with labour and capital.
Capital service as production factor was interpreted by Ayres and Warr as useful work of production equipment, which makes it possible to reproduce historical rates of economic growth with considerable precision and without recourse to exogenous and unexplained technological progress, thereby overcoming the major flaw of the Solow theory of economic growth.
Humanity's economic system as a subsystem of the global environment:
In the macroeconomic models in ecological economics, the economic system is a subsystem of the environment. In this model, the circular flow of income diagram is replaced in ecological economics by a more complex flow diagram reflecting the input of solar energy, which sustains natural inputs and environmental services which are then used as units of production.
Once consumed, natural inputs pass out of the economy as pollution and waste. The potential of an environment to provide services and materials is referred to as an "environment's source function", and this function is depleted as resources are consumed or pollution contaminates the resources.
The "sink function" describes an environment's ability to absorb and render harmless waste and pollution: when waste output exceeds the limit of the sink function, long-term damage occurs.
Some persistent pollutants, such as some organic pollutants and nuclear waste are absorbed very slowly or not at all; ecological economists emphasize minimizing "cumulative pollutants". Pollutants affect human health and the health of the ecosystem.
Basic macroeconomic concepts:
Macroeconomics encompasses a variety of concepts and variables, but there are three central topics for macroeconomic research. Macroeconomic theories usually relate the phenomena of output, unemployment, and inflation. Outside of macroeconomic theory, these topics are also important to all economic agents including workers, consumers, and producers.
Output and income:
National output is the total amount of everything a country produces in a given period of time. Everything that is produced and sold generates an equal amount of income. The total output of the economy is measured GDP per person.
The output and income are usually considered equivalent and the two terms are often used interchangeably, output changes into income. Output can be measured or it can be viewed from the production side and measured as the total value of final goods and services or the sum of all value added in the economy.
Macroeconomic output is usually measured by gross domestic product (GDP) or one of the other national accounts. Economists interested in long-run increases in output, study economic growth. Advances in technology, accumulation of machinery and other capital, and better education and human capital, are all factors that lead to increase economic output over time.
However, output does not always increase consistently over time. Business cycles can cause short-term drops in output called recessions. Economists look for macroeconomic policies that prevent economies from slipping into recessions, and that lead to faster long-term growth.
Unemployment:
Main article: Unemployment
The amount of unemployment in an economy is measured by the unemployment rate, i.e. the percentage of workers without jobs in the labor force. The unemployment rate in the labor force only includes workers actively looking for jobs. People who are retired, pursuing education, or discouraged from seeking work by a lack of job prospects are excluded.
Unemployment can be generally broken down into several types that are related to different causes:
- Classical unemployment theory suggests that unemployment occurs when wages are too high for employers to be willing to hire more workers. Other more modern economic theories suggest that increased wages actually decrease unemployment by creating more consumer demand. According to these more recent theories, unemployment results from reduced demand for the goods and services produced through labor and suggest that only in markets where profit margins are very low, and in which the market will not bear a price increase of product or service, will higher wages result in unemployment.
- Consistent with classical unemployment theory, frictional unemployment occurs when appropriate job vacancies exist for a worker, but the length of time needed to search for and find the job leads to a period of unemployment.
- Structural unemployment covers a variety of possible causes of unemployment including a mismatch between workers' skills and the skills required for open jobs. Large amounts of structural unemployment commonly occur when an economy shifts to focus on new industries and workers find their previous set of skills are no longer in demand. Structural unemployment is similar to frictional unemployment as both reflect the problem of matching workers with job vacancies, but structural unemployment also covers the time needed to acquire new skills in addition to the short-term search process.
- While some types of unemployment may occur regardless of the condition of the economy, cyclical unemployment occurs when growth stagnates. Okun's law represents the empirical relationship between unemployment and economic growth. The original version of Okun's law states that a 3% increase in output would lead to a 1% decrease in unemployment.
Inflation and deflation:
A general price increase across the entire economy is called inflation. When prices decrease, there is deflation. Economists measure these changes in prices with price indexes. Inflation can occur when an economy becomes overheated and grows too quickly. Similarly, a declining economy can lead to deflation.
Central bankers, who manage a country's money supply, try to avoid changes in price level by using monetary policy. Raising interest rates or reducing the supply of money in an economy is posited to reduce inflation. Inflation can lead to increased uncertainty and other negative consequences.
Deflation can lower economic output. Central bankers try to stabilize prices to protect economies from the negative consequences of price changes.
Changes in price level may be the result of several factors. The quantity theory of money holds that changes in price level are directly related to changes in the money supply. Most economists believe that this relationship explains long-run changes in the price level.
Short-run fluctuations may also be related to monetary factors, but changes in aggregate demand and aggregate supply can also influence price level. For example, a decrease in demand due to a recession can lead to lower price levels and deflation. A negative supply shock, such as an oil crisis, lowers aggregate supply and can cause inflation.
Macroeconomic policy:
Macroeconomic policy is usually implemented through two sets of tools: fiscal and monetary policy. Both forms of policy are used to stabilize the economy, which can mean boosting the economy to the level of GDP consistent with full employment. Macroeconomic policy focuses on limiting the effects of the business cycle to achieve the economic goals of price stability, full employment, and growth.
According to a 2018 assessment by economists Emi Nakamura and Jón Steinsson, economic "evidence regarding the consequences of different macroeconomic policies is still highly imperfect and open to serious criticism." Nakamura and Steinsson write that macroeconomics struggles with long-term predictions, which is a result of the high complexity of the systems it studies.
Monetary policy:
Further information: Monetary policy
Central banks implement monetary policy by controlling the money supply through several mechanisms. Typically, central banks take action by issuing money to buy bonds (or other assets), which boosts the supply of money and lowers interest rates, or, in the case of contractionary monetary policy, banks sell bonds and take money out of circulation. Usually policy is not implemented by directly targeting the supply of money.
Central banks continuously shift the money supply to maintain a targeted fixed interest rate. Some of them allow the interest rate to fluctuate and focus on targeting inflation rates instead. Central banks generally try to achieve high output without letting loose monetary policy that create large amounts of inflation.
Conventional monetary policy can be ineffective in situations such as a liquidity trap. When interest rates and inflation are near zero, the central bank cannot loosen monetary policy through conventional means.
Central banks can use unconventional monetary policy such as quantitative easing to help increase output. Instead of buying government bonds, central banks can implement quantitative easing by buying not only government bonds, but also other assets such as corporate bonds, stocks, and other securities. This allows lower interest rates for a broader class of assets beyond government bonds.
In another example of unconventional monetary policy, the United States Federal Reserve recently made an attempt at such a policy with Operation Twist. Unable to lower current interest rates, the Federal Reserve lowered long-term interest rates by buying long-term bonds and selling short-term bonds to create a flat yield curve.
'The difference between Macroeconomics and Microeconomics'
In addition, economists consider two areas. Macroeconomics in the broad sense is interested in the operation of the economy as a whole. It investigates topics like employment, GDP, and inflation—material for news articles and discussions of national policy.
Small-scale microeconomics is interested in the interactions between supply and demand in particular marketplaces for commodities and services.
The focus of macroeconomics is often on a country and how its markets interact to produce large-scale phenomena that economists refer to as aggregate variables. A single market is the focus of analysis in the field of microeconomics, such as whether changes in supply or demand are to blame for price increases in the oil and automotive sectors.
Macroeconomics frequently examines the role that the government plays in promoting general economic growth or managing inflation, for instance. Because trade, investment, and capital movements connect home markets to markets abroad, macroeconomics frequently touches on the global scale.
However, microeconomics can also involve other countries. Single markets are sometimes not limited to a single nation; the world market for oil is a prime example.
From introductory classes in "principles of economics" through doctoral studies, the macro/micro divide is institutionalized in the field of economics. Most economists identify as either macro- or micro-economists. Several new scholarly publications have just been launched by the American Economic Association. The first is microeconomics. Another is named Macroeconomics, which is apart from each other.
While Consumer demand theory, production theory (also known as the theory of the firm), and related topics such as the nature of market competition, economic welfare, and the role of imperfect information in economic outcomes are divided into microeconomics, which examines the behavior of individual consumers and firms.
At its most abstract level, general equilibrium, which deals with multiple markets at once, is also a subset of microeconomics. Microeconomic analysis makes up the majority of economic analysis. It is rich with principles that are applicable in the real world and addresses topics like the impact of minimum wages, taxes, price supports, or monopolies on certain markets.
The field of commerce, industrial organization and market structure, labor economics, public finance, and welfare economics are all areas in which it is used. Microeconomic analysis sheds light on such varied endeavors as firm creation.
It is harder to understand macroeconomics. It describes the connections between large aggregates that are difficult to comprehend, such the amount of national income, savings, and prices in general. The study of long-term national economic growth, the analysis of short-term deviations from equilibrium, and the creation of policies to stabilize the national economy—that is, to reduce volatility in growth and prices—are the traditional divisions of this area.
These measures can be taken by the government through taxation and expenditure or by the central bank through monetary policy.
Fiscal policy:
Further information: Fiscal policy
Fiscal policy is the use of government's revenue and expenditure as instruments to influence the economy. Examples of such tools are expenditure, taxes, and debt.
For example, if the economy is producing less than potential output, government spending can be used to employ idle resources and boost output. Government spending does not have to make up for the entire output gap.
There is a multiplier effect that boosts the impact of government spending. For instance, when the government pays for a bridge, the project not only adds the value of the bridge to output, but also allows the bridge workers to increase their consumption and investment, which helps to close the output gap.
The effects of fiscal policy can be limited by crowding out. When the government takes on spending projects, it limits the amount of resources available for the private sector to use.
Crowding out occurs when government spending simply replaces private sector output instead of adding additional output to the economy. Crowding out also occurs when government spending raises interest rates, which limits investment. Defenders of fiscal stimulus argue that crowding out is not a concern when the economy is depressed, plenty of resources are left idle, and interest rates are low.
Fiscal policy can be implemented through automatic stabilizers. Automatic stabilizers do not suffer from the policy lags of discretionary fiscal policy. Automatic stabilizers use conventional fiscal mechanisms but take effect as soon as the economy takes a downturn: spending on unemployment benefits automatically increases when unemployment rises and, in a progressive income tax system, the effective tax rate automatically falls when incomes decline.
Comparison:
Economists usually favor monetary over fiscal policy because it has two major advantages.
First, monetary policy is generally implemented by independent central banks instead of the political institutions that control fiscal policy. Independent central banks are less likely to make decisions based on political motives.
Second, monetary policy suffers shorter inside lags and outside lags than fiscal policy.
Additionally, central banks are able to make quick decisions with rapid implementation. Whereas fiscal policy will most likely move slowly through government bureaucracy and take longer to fully implement into the economy.
See also:
- Business cycle accounting
- Dynamic stochastic general equilibrium
- Economic development
- Growth accounting
Microeconomics
Picture below: Microeconomics Definition -- Microeconomics is a ‘bottom-up’ approach where patterns from everyday life are pieced together to correlate demand and supply. The study examines how the behaviors of individuals, households, and firms have an impact on the market.
Microeconomics is entirely contradictory to macroeconomics. It is a narrower concept that focuses only on a single market or segment. This study only interprets the tiny components of the economy. The study states that the market attains equilibrium when the supply of goods controls the demand.
Click here for the Table of contents for courses about Microeconomics
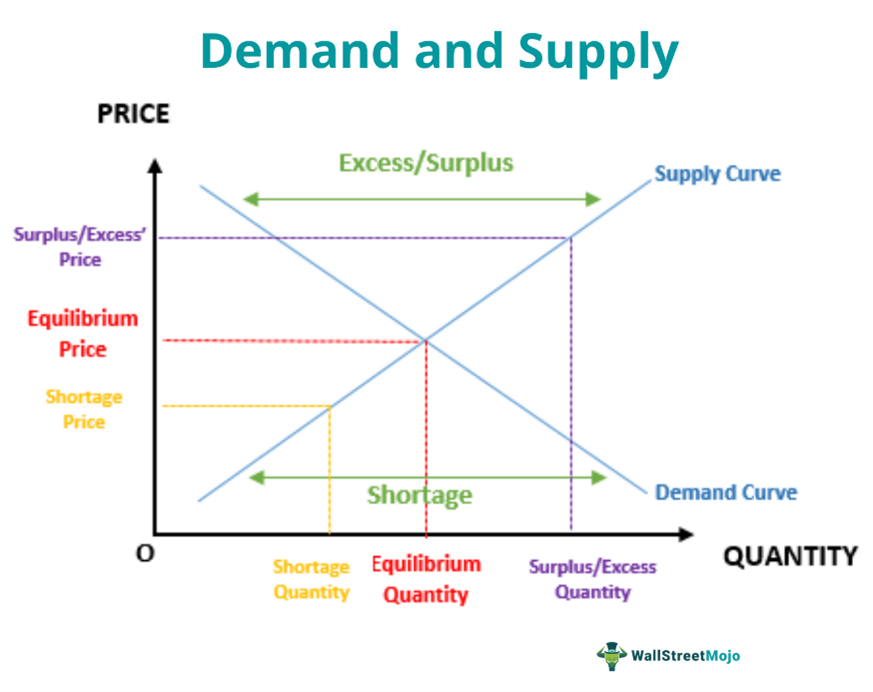
Microeconomics is a branch of mainstream economics that studies the behavior of individuals and firms in making decisions regarding the allocation of scarce resources and the interactions among these individuals and firms. Microeconomics focuses on the study of individual markets, sectors, or industries as opposed to the national economy as whole, which is studied in macroeconomics.
One goal of microeconomics is to analyze the market mechanisms that establish relative prices among goods and services and allocate limited resources among alternative uses. Microeconomics shows conditions under which free markets lead to desirable allocations. It also analyzes market failure, where markets fail to produce efficient results.
While microeconomics focuses on firms and individuals, macroeconomics focuses on the sum total of economic activity, dealing with the issues of growth, inflation, and unemployment—and with national policies relating to these issues.
Microeconomics also deals with the effects of economic policies (such as changing taxation levels) on microeconomic behavior and thus on the aforementioned aspects of the economy.
Particularly in the wake of the Lucas critique, much of modern macroeconomic theories has been built upon microfoundations—i.e., based upon basic assumptions about micro-level behavior.
Assumptions and definitions:
Microeconomic study historically has been performed according to general equilibrium theory, developed by Léon Walras in Elements of Pure Economics (1874) and partial equilibrium theory, introduced by Alfred Marshall in Principles of Economics (1890).
Microeconomic theory typically begins with the study of a single rational and utility maximizing individual. To economists, rationality means an individual possesses stable preferences that are both complete and transitive.
The technical assumption that preference relations are continuous is needed to ensure the existence of a utility function. Although microeconomic theory can continue without this assumption, it would make comparative statics impossible since there is no guarantee that the resulting utility function would be differentiable.
Microeconomic theory progresses by defining a competitive budget set which is a subset of the consumption set. It is at this point that economists make the technical assumption that preferences are locally non-satiated. Without the assumption of LNS (local non-satiation) there is no 100% guarantee but there would be a rational rise in individual utility.
With the necessary tools and assumptions in place the utility maximization problem (UMP) is developed.
The utility maximization problem is the heart of consumer theory. The utility maximization problem attempts to explain the action axiom by imposing rationality axioms on consumer preferences and then mathematically modeling and analyzing the consequences.
The utility maximization problem serves not only as the mathematical foundation of consumer theory but as a metaphysical explanation of it as well. That is, the utility maximization problem is used by economists to not only explain what or how individuals make choices but why individuals make choices as well.
The utility maximization problem is a constrained optimization problem in which an individual seeks to maximize utility subject to a budget constraint. Economists use the extreme value theorem to guarantee that a solution to the utility maximization problem exists. That is, since the budget constraint is both bounded and closed, a solution to the utility maximization problem exists. Economists call the solution to the utility maximization problem a Walrasian demand function or correspondence.
The utility maximization problem has so far been developed by taking consumer tastes (i.e. consumer utility) as the primitive. However, an alternative way to develop microeconomic theory is by taking consumer choice as the primitive. This model of microeconomic theory is referred to as revealed preference theory.
The theory of supply and demand usually assumes that markets are perfectly competitive. This implies that there are many buyers and sellers in the market and none of them have the capacity to significantly influence prices of goods and services.
In many real-life transactions, the assumption fails because some individual buyers or sellers have the ability to influence prices. Quite often, a sophisticated analysis is required to understand the demand-supply equation of a good model. However, the theory works well in situations meeting these assumptions.
Mainstream economics does not assume a priori that markets are preferable to other forms of social organization. In fact, much analysis is devoted to cases where market failures lead to resource allocation that is suboptimal and creates deadweight loss. A classic example of suboptimal resource allocation is that of a public good.
In such cases, economists may attempt to find policies that avoid waste, either directly by government control, indirectly by regulation that induces market participants to act in a manner consistent with optimal welfare, or by creating "missing markets" to enable efficient trading where none had previously existed.
This is studied in the field of collective action and public choice theory. "Optimal welfare" usually takes on a Paretian norm, which is a mathematical application of the Kaldor–Hicks method. This can diverge from the Utilitarian goal of maximizing utility because it does not consider the distribution of goods between people. Market failure in positive economics (microeconomics) is limited in implications without mixing the belief of the economist and their theory.
The demand for various commodities by individuals is generally thought of as the outcome of a utility-maximizing process, with each individual trying to maximize their own utility under a budget constraint and a given consumption set.
Allocation of scarce resources:
Individuals and firms need to allocate limited resources to ensure all agents in the economy are well off. Firms decide which goods and services to produce considering low costs involving labour, materials and capital as well as potential profit margins. Consumers choose the good and services they want that will maximize their happiness taking into account their limited wealth.
The government can make these allocation decisions or they can be independently made by the consumers and firms. For example, in the former Soviet Union, the government played a part in informing car manufacturers which cars to produce and which consumers will gain access to a car.
History:
Main article: History of microeconomics
Economists commonly consider themselves microeconomists or macroeconomists. The difference between microeconomics and macroeconomics likely was introduced in 1933 by the Norwegian economist Ragnar Frisch, the co-recipient of the first Nobel Memorial Prize in Economic Sciences in 1969.
However, Frisch did not actually use the word "microeconomics", instead drawing distinctions between "micro-dynamic" and "macro-dynamic" analysis in a way similar to how the words "microeconomics" and "macroeconomics" are used today.
The first known use of the term "microeconomics" in a published article was from Pieter de Wolff in 1941, who broadened the term "micro-dynamics" into "microeconomics".
Microeconomic theory:
Consumer demand theory:
Main article: Consumer choice
Consumer demand theory relates preferences for the consumption of both goods and services to the consumption expenditures; ultimately, this relationship between preferences and consumption expenditures is used to relate preferences to consumer demand curves.
The link between personal preferences, consumption and the demand curve is one of the most closely studied relations in economics. It is a way of analyzing how consumers may achieve equilibrium between preferences and expenditures by maximizing utility subject to consumer budget constraints.
Production theory:
Main article: Production theory
Production theory is the study of production, or the economic process of converting inputs into outputs. Production uses resources to create a good or service that is suitable for use, gift-giving in a gift economy, or exchange in a market economy. This can include manufacturing, storing, shipping, and packaging. Some economists define production broadly as all economic activity other than consumption. They see every commercial activity other than the final purchase as some form of production.
Cost-of-production theory of value:
Main article: Cost-of-production theory of value
The cost-of-production theory of value states that the price of an object or condition is determined by the sum of the cost of the resources that went into making it. The cost can comprise any of the factors of production (including labor, capital, or land) and taxation. Technology can be viewed either as a form of fixed capital (e.g. an industrial plant) or circulating capital (e.g. intermediate goods).
In the mathematical model for the cost of production, the short-run total cost is equal to fixed cost plus total variable cost. The fixed cost refers to the cost that is incurred regardless of how much the firm produces. The variable cost is a function of the quantity of an object being produced. The cost function can be used to characterize production through the duality theory in economics, developed mainly by Ronald Shephard (1953, 1970) and other scholars (Sickles & Zelenyuk, 2019, ch.2).
Fixed and variable costs:
Over a short time period (few months), most costs are fixed costs as the firm will have to pay for salaries, contracted shipment and materials used to produce various goods. Over a longer time period (2-3 years), costs can become variable. Firms can decide to reduce output, purchase fewer materials and even sell some machinery.
Over 10 years, most costs become variable as workers can be laid off or new machinery can be bought to replace the old machinery
Sunk Costs- This is a fixed cost that has already been incurred and cannot be recovered. An example of this can be in R&D development like in the pharmaceutical industry. Hundreds of millions of dollars are spent to achieve new drug breakthroughs but this is challenging as its increasingly harder to find new breakthroughs and meet tighter regulation standards. Thus many projects are written off leading to losses of millions of dollars
Opportunity cost:
Main article: Opportunity cost
Opportunity cost is closely related to the idea of time constraints. One can do only one thing at a time, which means that, inevitably, one is always giving up other things. The opportunity cost of any activity is the value of the next-best alternative thing one may have done instead.
Opportunity cost depends only on the value of the next-best alternative. It doesn't matter whether one has five alternatives or 5,000.
Opportunity costs can tell when not to do something as well as when to do something. For example, one may like waffles, but like chocolate even more. If someone offers only waffles, one would take it. But if offered waffles or chocolate, one would take the chocolate. The opportunity cost of eating waffles is sacrificing the chance to eat chocolate.
Because the cost of not eating the chocolate is higher than the benefits of eating the waffles, it makes no sense to choose waffles. Of course, if one chooses chocolate, they are still faced with the opportunity cost of giving up having waffles.
But one is willing to do that because the waffle's opportunity cost is lower than the benefits of the chocolate. Opportunity costs are unavoidable constraints on behaviour because one has to decide what's best and give up the next-best alternative.
Price Theory:
Microeconomics is also known as price theory to highlight the significance of prices in relation to buyer and sellers as these agents determine prices due to their individual actions.
Price theory is a field of economics that uses the supply and demand framework to explain and predict human behavior. It is associated with the Chicago School of Economics. Price theory studies competitive equilibrium in markets to yield testable hypotheses that can be rejected.
Price theory is not the same as microeconomics. Strategic behavior, such as the interactions among sellers in a market where they are few, is a significant part of microeconomics but is not emphasized in price theory. Price theorists focus on competition believing it to be a reasonable description of most markets that leaves room to study additional aspects of tastes and technology.
As a result, price theory tends to use less game theory than microeconomics does.
Price theory focuses on how agents respond to prices, but its framework can be applied to a wide variety of socioeconomic issues that might not seem to involve prices at first glance.
Price theorists have influenced several other fields including developing public choice theory and law and economics. Price theory has been applied to issues previously thought of as outside the purview of economics such as criminal justice, marriage, and addiction.
Microeconomic models:
Supply and demand:
Main article: Supply and demand
Supply and demand is an economic model of price determination in a perfectly competitive market. It concludes that in a perfectly competitive market with no externalities, per unit taxes, or price controls, the unit price for a particular good is the price at which the quantity demanded by consumers equals the quantity supplied by producers. This price results in a stable economic equilibrium.
Prices and quantities have been described as the most directly observable attributes of goods produced and exchanged in a market economy. The theory of supply and demand is an organizing principle for explaining how prices coordinate the amounts produced and consumed. In microeconomics, it applies to price and output determination for a market with perfect competition, which includes the condition of no buyers or sellers large enough to have price-setting power.
For a given market of a commodity, demand is the relation of the quantity that all buyers would be prepared to purchase at each unit price of the good. Demand is often represented by a table or a graph showing price and quantity demanded (as in the figure above re: "Demand and Supply").
Demand theory describes individual consumers as rationally choosing the most preferred quantity of each good, given income, prices, tastes, etc.
A term for this is "constrained utility maximization" (with income and wealth as the constraints on demand). Here, utility refers to the hypothesized relation of each individual consumer for ranking different commodity bundles as more or less preferred.
The law of demand states that, in general, price and quantity demanded in a given market are inversely related. That is, the higher the price of a product, the less of it people would be prepared to buy (other things unchanged).
As the price of a commodity falls, consumers move toward it from relatively more expensive goods (the substitution effect). In addition, purchasing power from the price decline increases ability to buy (the income effect). Other factors can change demand; for example an increase in income will shift the demand curve for a normal good outward relative to the origin, as in the figure. All determinants are predominantly taken as constant factors of demand and supply.
Supply is the relation between the price of a good and the quantity available for sale at that price. It may be represented as a table or graph relating price and quantity supplied. Producers, for example business firms, are hypothesized to be profit maximizers, meaning that they attempt to produce and supply the amount of goods that will bring them the highest profit. Supply is typically represented as a function relating price and quantity, if other factors are unchanged.
That is, the higher the price at which the good can be sold, the more of it producers will supply, as in the figure. The higher price makes it profitable to increase production. Just as on the demand side, the position of the supply can shift, say from a change in the price of a productive input or a technical improvement.
The "Law of Supply" states that, in general, a rise in price leads to an expansion in supply and a fall in price leads to a contraction in supply. Here as well, the determinants of supply, such as price of substitutes, cost of production, technology applied and various factors of inputs of production are all taken to be constant for a specific time period of evaluation of supply.
Market equilibrium occurs where quantity supplied equals quantity demanded, the intersection of the supply and demand curves in the figure above. At a price below equilibrium, there is a shortage of quantity supplied compared to quantity demanded. This is posited to bid the price up. At a price above equilibrium, there is a surplus of quantity supplied compared to quantity demanded.
This pushes the price down. The model of supply and demand predicts that for given supply and demand curves, price and quantity will stabilize at the price that makes quantity supplied equal to quantity demanded. Similarly, demand-and-supply theory predicts a new price-quantity combination from a shift in demand (as to the figure), or in supply.
For a given quantity of a consumer good, the point on the demand curve indicates the value, or marginal utility, to consumers for that unit. It measures what the consumer would be prepared to pay for that unit. The corresponding point on the supply curve measures marginal cost, the increase in total cost to the supplier for the corresponding unit of the good.
The price in equilibrium is determined by supply and demand. In a perfectly competitive market, supply and demand equate marginal cost and marginal utility at equilibrium.
On the supply side of the market, some factors of production are described as (relatively) variable in the short run, which affects the cost of changing output levels. Their usage rates can be changed easily, such as electrical power, raw-material inputs, and over-time and temp work. Other inputs are relatively fixed, such as plant and equipment and key personnel.
In the long run, all inputs may be adjusted by management. These distinctions translate to differences in the elasticity (responsiveness) of the supply curve in the short and long runs and corresponding differences in the price-quantity change from a shift on the supply or demand side of the market.
Marginalist theory, such as above, describes the consumers as attempting to reach most-preferred positions, subject to income and wealth constraints while producers attempt to maximize profits subject to their own constraints, including demand for goods produced, technology, and the price of inputs.
For the consumer, that point comes where marginal utility of a good, net of price, reaches zero, leaving no net gain from further consumption increases. Analogously, the producer compares marginal revenue (identical to price for the perfect competitor) against the marginal cost of a good, with marginal profit the difference.
At the point where marginal profit reaches zero, further increases in production of the good stop. For movement to market equilibrium and for changes in equilibrium, price and quantity also change "at the margin": more-or-less of something, rather than necessarily all-or-nothing.
Other applications of demand and supply include the distribution of income among the factors of production, including labor and capital, through factor markets. In a competitive labour market for example the quantity of labour employed and the price of labour (the wage rate) depends on the demand for labour (from employers for production) and supply of labour (from potential workers).
Labour economics examines the interaction of workers and employers through such markets to explain patterns and changes of:
Demand-and-supply analysis is used to explain the behaviour of perfectly competitive markets, but as a standard of comparison it can be extended to any type of market. It can also be generalized to explain variables across the economy, for example, total output (estimated as real GDP) and the general price level, as studied in macroeconomics (see above).
Tracing the qualitative and quantitative effects of variables that change supply and demand, whether in the short or long run, is a standard exercise in applied economics. Economic theory may also specify conditions such that supply and demand through the market is an efficient mechanism for allocating resources.
Market structure:
Main article: Market structure
Market structure refers to features of a market, including the number of firms in the market, the distribution of market shares between them, product uniformity across firms, how easy it is for firms to enter and exit the market, and forms of competition in the market. A market structure can have several types of interacting market systems.
Different forms of markets are a feature of capitalism and market socialism, with advocates of state socialism often criticizing markets and aiming to substitute or replace markets with varying degrees of government-directed economic planning.
Competition acts as a regulatory mechanism for market systems, with government providing regulations where the market cannot be expected to regulate itself. Regulations help to mitigate negative externalities of goods and services when the private equilibrium of the market does not match the social equilibrium.
One example of this is with regards to building codes, which if absent in a purely competition regulated market system, might result in several horrific injuries or deaths to be required before companies would begin improving structural safety, as consumers may at first not be as concerned or aware of safety issues to begin putting pressure on companies to provide them, and companies would be motivated not to provide proper safety features due to how it would cut into their profits.
The concept of "market type" is different from the concept of "market structure".
Nevertheless, it is worth noting here that there are a variety of types of markets.
The different market structures produce cost curves based on the type of structure present. The different curves are developed based on the costs of production, specifically the graph contains marginal cost, average total cost, average variable cost, average fixed cost, and marginal revenue, which is sometimes equal to the demand, average revenue, and price in a price-taking firm.
Perfect competition:
Main article: Perfect competition
Perfect competition is a situation in which numerous small firms producing identical products compete against each other in a given industry. Perfect competition leads to firms producing the socially optimal output level at the minimum possible cost per unit. Firms in perfect competition are "price takers" (they do not have enough market power to profitably increase the price of their goods or services).
A good example would be that of digital marketplaces, such as eBay, on which many different sellers sell similar products to many different buyers. Consumers in a perfect competitive market have perfect knowledge about the products that are being sold in this market.
Imperfect competition:
Main article: Imperfect competition
Imperfect competition is a type of market structure showing some but not all features of competitive markets. In perfect competition, market power is not achievable due to a high level of producers causing high levels of competition. Therefore, prices are brought down to a marginal cost level. In a monopoly, market power is achieved by one firm leading to prices being higher than the marginal cost level.
Between these two types of markets are firms that are neither perfectly competitive or monopolistic. Firms such as Pepsi and Coke and Sony, Nintendo and Microsoft dominate the cola and video game industry respectively. These firms are in imperfect competition.
Monopolistic competition:
Main article: Monopolistic competition
Monopolistic competition is a situation in which many firms with slightly different products compete. Production costs are above what may be achieved by perfectly competitive firms, but society benefits from the product differentiation. Examples of industries with market structures similar to monopolistic competition include restaurants, cereal, clothing, shoes, and service industries in large cities.
Monopoly:
Main article: Monopoly
A monopoly is a market structure in which a market or industry is dominated by a single supplier of a particular good or service. Because monopolies have no competition, they tend to sell goods and services at a higher price and produce below the socially optimal output level.
However, not all monopolies are a bad thing, especially in industries where multiple firms would result in more costs than benefits (i.e. natural monopolies).
Oligopoly:
Main article: Oligopoly
An oligopoly is a market structure in which a market or industry is dominated by a small number of firms (oligopolists). Oligopolies can create the incentive for firms to engage in collusion and form cartels that reduce competition leading to higher prices for consumers and less overall market output.
Alternatively, oligopolies can be fiercely competitive and engage in flamboyant advertising campaigns.
Monopsony:
Main article: Monopsony
A monopsony is a market where there is only one buyer and many sellers.
Bilateral monopoly:
Main article: Bilateral monopoly
A bilateral monopoly is a market consisting of both a monopoly (a single seller) and a monopsony (a single buyer).
Oligopsony:
Main article: Oligopsony
An oligopsony is a market where there are a few buyers and many sellers.
Game theory:
Main article: Game theory
Game theory is a major method used in mathematical economics and business for modeling competing behaviors of interacting agents. The term "game" here implies the study of any strategic interaction between people.
Applications include a wide array of economic phenomena and approaches, such as:
Information economics:
Main article: Information economics
Information economics is a branch of microeconomic theory that studies how information and information systems affect an economy and economic decisions. Information has special characteristics. It is easy to create but hard to trust. It is easy to spread but hard to control. It influences many decisions. These special characteristics (as compared with other types of goods) complicate many standard economic theories.
The economics of information has recently become of great interest to many - possibly due to the rise of information-based companies inside the technology industry. From a game theory approach, the usual constraints that agents have complete information can be loosened to further examine the consequences of having incomplete information.
This gives rise to many results which are applicable to real life situations. For example, if one does loosen this assumption, then it is possible to scrutinize the actions of agents in situations of uncertainty. It is also possible to more fully understand the impacts – both positive and negative – of agents seeking out or acquiring information.
Applied
Applied microeconomics includes a range of specialized areas of study, many of which draw on methods from other fields.
One goal of microeconomics is to analyze the market mechanisms that establish relative prices among goods and services and allocate limited resources among alternative uses. Microeconomics shows conditions under which free markets lead to desirable allocations. It also analyzes market failure, where markets fail to produce efficient results.
While microeconomics focuses on firms and individuals, macroeconomics focuses on the sum total of economic activity, dealing with the issues of growth, inflation, and unemployment—and with national policies relating to these issues.
Microeconomics also deals with the effects of economic policies (such as changing taxation levels) on microeconomic behavior and thus on the aforementioned aspects of the economy.
Particularly in the wake of the Lucas critique, much of modern macroeconomic theories has been built upon microfoundations—i.e., based upon basic assumptions about micro-level behavior.
Assumptions and definitions:
Microeconomic study historically has been performed according to general equilibrium theory, developed by Léon Walras in Elements of Pure Economics (1874) and partial equilibrium theory, introduced by Alfred Marshall in Principles of Economics (1890).
Microeconomic theory typically begins with the study of a single rational and utility maximizing individual. To economists, rationality means an individual possesses stable preferences that are both complete and transitive.
The technical assumption that preference relations are continuous is needed to ensure the existence of a utility function. Although microeconomic theory can continue without this assumption, it would make comparative statics impossible since there is no guarantee that the resulting utility function would be differentiable.
Microeconomic theory progresses by defining a competitive budget set which is a subset of the consumption set. It is at this point that economists make the technical assumption that preferences are locally non-satiated. Without the assumption of LNS (local non-satiation) there is no 100% guarantee but there would be a rational rise in individual utility.
With the necessary tools and assumptions in place the utility maximization problem (UMP) is developed.
The utility maximization problem is the heart of consumer theory. The utility maximization problem attempts to explain the action axiom by imposing rationality axioms on consumer preferences and then mathematically modeling and analyzing the consequences.
The utility maximization problem serves not only as the mathematical foundation of consumer theory but as a metaphysical explanation of it as well. That is, the utility maximization problem is used by economists to not only explain what or how individuals make choices but why individuals make choices as well.
The utility maximization problem is a constrained optimization problem in which an individual seeks to maximize utility subject to a budget constraint. Economists use the extreme value theorem to guarantee that a solution to the utility maximization problem exists. That is, since the budget constraint is both bounded and closed, a solution to the utility maximization problem exists. Economists call the solution to the utility maximization problem a Walrasian demand function or correspondence.
The utility maximization problem has so far been developed by taking consumer tastes (i.e. consumer utility) as the primitive. However, an alternative way to develop microeconomic theory is by taking consumer choice as the primitive. This model of microeconomic theory is referred to as revealed preference theory.
The theory of supply and demand usually assumes that markets are perfectly competitive. This implies that there are many buyers and sellers in the market and none of them have the capacity to significantly influence prices of goods and services.
In many real-life transactions, the assumption fails because some individual buyers or sellers have the ability to influence prices. Quite often, a sophisticated analysis is required to understand the demand-supply equation of a good model. However, the theory works well in situations meeting these assumptions.
Mainstream economics does not assume a priori that markets are preferable to other forms of social organization. In fact, much analysis is devoted to cases where market failures lead to resource allocation that is suboptimal and creates deadweight loss. A classic example of suboptimal resource allocation is that of a public good.
In such cases, economists may attempt to find policies that avoid waste, either directly by government control, indirectly by regulation that induces market participants to act in a manner consistent with optimal welfare, or by creating "missing markets" to enable efficient trading where none had previously existed.
This is studied in the field of collective action and public choice theory. "Optimal welfare" usually takes on a Paretian norm, which is a mathematical application of the Kaldor–Hicks method. This can diverge from the Utilitarian goal of maximizing utility because it does not consider the distribution of goods between people. Market failure in positive economics (microeconomics) is limited in implications without mixing the belief of the economist and their theory.
The demand for various commodities by individuals is generally thought of as the outcome of a utility-maximizing process, with each individual trying to maximize their own utility under a budget constraint and a given consumption set.
Allocation of scarce resources:
Individuals and firms need to allocate limited resources to ensure all agents in the economy are well off. Firms decide which goods and services to produce considering low costs involving labour, materials and capital as well as potential profit margins. Consumers choose the good and services they want that will maximize their happiness taking into account their limited wealth.
The government can make these allocation decisions or they can be independently made by the consumers and firms. For example, in the former Soviet Union, the government played a part in informing car manufacturers which cars to produce and which consumers will gain access to a car.
History:
Main article: History of microeconomics
Economists commonly consider themselves microeconomists or macroeconomists. The difference between microeconomics and macroeconomics likely was introduced in 1933 by the Norwegian economist Ragnar Frisch, the co-recipient of the first Nobel Memorial Prize in Economic Sciences in 1969.
However, Frisch did not actually use the word "microeconomics", instead drawing distinctions between "micro-dynamic" and "macro-dynamic" analysis in a way similar to how the words "microeconomics" and "macroeconomics" are used today.
The first known use of the term "microeconomics" in a published article was from Pieter de Wolff in 1941, who broadened the term "micro-dynamics" into "microeconomics".
Microeconomic theory:
Consumer demand theory:
Main article: Consumer choice
Consumer demand theory relates preferences for the consumption of both goods and services to the consumption expenditures; ultimately, this relationship between preferences and consumption expenditures is used to relate preferences to consumer demand curves.
The link between personal preferences, consumption and the demand curve is one of the most closely studied relations in economics. It is a way of analyzing how consumers may achieve equilibrium between preferences and expenditures by maximizing utility subject to consumer budget constraints.
Production theory:
Main article: Production theory
Production theory is the study of production, or the economic process of converting inputs into outputs. Production uses resources to create a good or service that is suitable for use, gift-giving in a gift economy, or exchange in a market economy. This can include manufacturing, storing, shipping, and packaging. Some economists define production broadly as all economic activity other than consumption. They see every commercial activity other than the final purchase as some form of production.
Cost-of-production theory of value:
Main article: Cost-of-production theory of value
The cost-of-production theory of value states that the price of an object or condition is determined by the sum of the cost of the resources that went into making it. The cost can comprise any of the factors of production (including labor, capital, or land) and taxation. Technology can be viewed either as a form of fixed capital (e.g. an industrial plant) or circulating capital (e.g. intermediate goods).
In the mathematical model for the cost of production, the short-run total cost is equal to fixed cost plus total variable cost. The fixed cost refers to the cost that is incurred regardless of how much the firm produces. The variable cost is a function of the quantity of an object being produced. The cost function can be used to characterize production through the duality theory in economics, developed mainly by Ronald Shephard (1953, 1970) and other scholars (Sickles & Zelenyuk, 2019, ch.2).
Fixed and variable costs:
- Fixed cost (FC)- This cost does not change with output. It includes business expenses such as rent, salaries and utility bills.
- Variable cost (VC)- This cost changes as output changes. This includes raw materials, delivery costs and production supplies.
Over a short time period (few months), most costs are fixed costs as the firm will have to pay for salaries, contracted shipment and materials used to produce various goods. Over a longer time period (2-3 years), costs can become variable. Firms can decide to reduce output, purchase fewer materials and even sell some machinery.
Over 10 years, most costs become variable as workers can be laid off or new machinery can be bought to replace the old machinery
Sunk Costs- This is a fixed cost that has already been incurred and cannot be recovered. An example of this can be in R&D development like in the pharmaceutical industry. Hundreds of millions of dollars are spent to achieve new drug breakthroughs but this is challenging as its increasingly harder to find new breakthroughs and meet tighter regulation standards. Thus many projects are written off leading to losses of millions of dollars
Opportunity cost:
Main article: Opportunity cost
Opportunity cost is closely related to the idea of time constraints. One can do only one thing at a time, which means that, inevitably, one is always giving up other things. The opportunity cost of any activity is the value of the next-best alternative thing one may have done instead.
Opportunity cost depends only on the value of the next-best alternative. It doesn't matter whether one has five alternatives or 5,000.
Opportunity costs can tell when not to do something as well as when to do something. For example, one may like waffles, but like chocolate even more. If someone offers only waffles, one would take it. But if offered waffles or chocolate, one would take the chocolate. The opportunity cost of eating waffles is sacrificing the chance to eat chocolate.
Because the cost of not eating the chocolate is higher than the benefits of eating the waffles, it makes no sense to choose waffles. Of course, if one chooses chocolate, they are still faced with the opportunity cost of giving up having waffles.
But one is willing to do that because the waffle's opportunity cost is lower than the benefits of the chocolate. Opportunity costs are unavoidable constraints on behaviour because one has to decide what's best and give up the next-best alternative.
Price Theory:
Microeconomics is also known as price theory to highlight the significance of prices in relation to buyer and sellers as these agents determine prices due to their individual actions.
Price theory is a field of economics that uses the supply and demand framework to explain and predict human behavior. It is associated with the Chicago School of Economics. Price theory studies competitive equilibrium in markets to yield testable hypotheses that can be rejected.
Price theory is not the same as microeconomics. Strategic behavior, such as the interactions among sellers in a market where they are few, is a significant part of microeconomics but is not emphasized in price theory. Price theorists focus on competition believing it to be a reasonable description of most markets that leaves room to study additional aspects of tastes and technology.
As a result, price theory tends to use less game theory than microeconomics does.
Price theory focuses on how agents respond to prices, but its framework can be applied to a wide variety of socioeconomic issues that might not seem to involve prices at first glance.
Price theorists have influenced several other fields including developing public choice theory and law and economics. Price theory has been applied to issues previously thought of as outside the purview of economics such as criminal justice, marriage, and addiction.
Microeconomic models:
Supply and demand:
Main article: Supply and demand
Supply and demand is an economic model of price determination in a perfectly competitive market. It concludes that in a perfectly competitive market with no externalities, per unit taxes, or price controls, the unit price for a particular good is the price at which the quantity demanded by consumers equals the quantity supplied by producers. This price results in a stable economic equilibrium.
Prices and quantities have been described as the most directly observable attributes of goods produced and exchanged in a market economy. The theory of supply and demand is an organizing principle for explaining how prices coordinate the amounts produced and consumed. In microeconomics, it applies to price and output determination for a market with perfect competition, which includes the condition of no buyers or sellers large enough to have price-setting power.
For a given market of a commodity, demand is the relation of the quantity that all buyers would be prepared to purchase at each unit price of the good. Demand is often represented by a table or a graph showing price and quantity demanded (as in the figure above re: "Demand and Supply").
Demand theory describes individual consumers as rationally choosing the most preferred quantity of each good, given income, prices, tastes, etc.
A term for this is "constrained utility maximization" (with income and wealth as the constraints on demand). Here, utility refers to the hypothesized relation of each individual consumer for ranking different commodity bundles as more or less preferred.
The law of demand states that, in general, price and quantity demanded in a given market are inversely related. That is, the higher the price of a product, the less of it people would be prepared to buy (other things unchanged).
As the price of a commodity falls, consumers move toward it from relatively more expensive goods (the substitution effect). In addition, purchasing power from the price decline increases ability to buy (the income effect). Other factors can change demand; for example an increase in income will shift the demand curve for a normal good outward relative to the origin, as in the figure. All determinants are predominantly taken as constant factors of demand and supply.
Supply is the relation between the price of a good and the quantity available for sale at that price. It may be represented as a table or graph relating price and quantity supplied. Producers, for example business firms, are hypothesized to be profit maximizers, meaning that they attempt to produce and supply the amount of goods that will bring them the highest profit. Supply is typically represented as a function relating price and quantity, if other factors are unchanged.
That is, the higher the price at which the good can be sold, the more of it producers will supply, as in the figure. The higher price makes it profitable to increase production. Just as on the demand side, the position of the supply can shift, say from a change in the price of a productive input or a technical improvement.
The "Law of Supply" states that, in general, a rise in price leads to an expansion in supply and a fall in price leads to a contraction in supply. Here as well, the determinants of supply, such as price of substitutes, cost of production, technology applied and various factors of inputs of production are all taken to be constant for a specific time period of evaluation of supply.
Market equilibrium occurs where quantity supplied equals quantity demanded, the intersection of the supply and demand curves in the figure above. At a price below equilibrium, there is a shortage of quantity supplied compared to quantity demanded. This is posited to bid the price up. At a price above equilibrium, there is a surplus of quantity supplied compared to quantity demanded.
This pushes the price down. The model of supply and demand predicts that for given supply and demand curves, price and quantity will stabilize at the price that makes quantity supplied equal to quantity demanded. Similarly, demand-and-supply theory predicts a new price-quantity combination from a shift in demand (as to the figure), or in supply.
For a given quantity of a consumer good, the point on the demand curve indicates the value, or marginal utility, to consumers for that unit. It measures what the consumer would be prepared to pay for that unit. The corresponding point on the supply curve measures marginal cost, the increase in total cost to the supplier for the corresponding unit of the good.
The price in equilibrium is determined by supply and demand. In a perfectly competitive market, supply and demand equate marginal cost and marginal utility at equilibrium.
On the supply side of the market, some factors of production are described as (relatively) variable in the short run, which affects the cost of changing output levels. Their usage rates can be changed easily, such as electrical power, raw-material inputs, and over-time and temp work. Other inputs are relatively fixed, such as plant and equipment and key personnel.
In the long run, all inputs may be adjusted by management. These distinctions translate to differences in the elasticity (responsiveness) of the supply curve in the short and long runs and corresponding differences in the price-quantity change from a shift on the supply or demand side of the market.
Marginalist theory, such as above, describes the consumers as attempting to reach most-preferred positions, subject to income and wealth constraints while producers attempt to maximize profits subject to their own constraints, including demand for goods produced, technology, and the price of inputs.
For the consumer, that point comes where marginal utility of a good, net of price, reaches zero, leaving no net gain from further consumption increases. Analogously, the producer compares marginal revenue (identical to price for the perfect competitor) against the marginal cost of a good, with marginal profit the difference.
At the point where marginal profit reaches zero, further increases in production of the good stop. For movement to market equilibrium and for changes in equilibrium, price and quantity also change "at the margin": more-or-less of something, rather than necessarily all-or-nothing.
Other applications of demand and supply include the distribution of income among the factors of production, including labor and capital, through factor markets. In a competitive labour market for example the quantity of labour employed and the price of labour (the wage rate) depends on the demand for labour (from employers for production) and supply of labour (from potential workers).
Labour economics examines the interaction of workers and employers through such markets to explain patterns and changes of:
- wages and other labour income,
- labour mobility,
- (un)employment,
- productivity through human capital,
- and related public-policy issues.
Demand-and-supply analysis is used to explain the behaviour of perfectly competitive markets, but as a standard of comparison it can be extended to any type of market. It can also be generalized to explain variables across the economy, for example, total output (estimated as real GDP) and the general price level, as studied in macroeconomics (see above).
Tracing the qualitative and quantitative effects of variables that change supply and demand, whether in the short or long run, is a standard exercise in applied economics. Economic theory may also specify conditions such that supply and demand through the market is an efficient mechanism for allocating resources.
Market structure:
Main article: Market structure
Market structure refers to features of a market, including the number of firms in the market, the distribution of market shares between them, product uniformity across firms, how easy it is for firms to enter and exit the market, and forms of competition in the market. A market structure can have several types of interacting market systems.
Different forms of markets are a feature of capitalism and market socialism, with advocates of state socialism often criticizing markets and aiming to substitute or replace markets with varying degrees of government-directed economic planning.
Competition acts as a regulatory mechanism for market systems, with government providing regulations where the market cannot be expected to regulate itself. Regulations help to mitigate negative externalities of goods and services when the private equilibrium of the market does not match the social equilibrium.
One example of this is with regards to building codes, which if absent in a purely competition regulated market system, might result in several horrific injuries or deaths to be required before companies would begin improving structural safety, as consumers may at first not be as concerned or aware of safety issues to begin putting pressure on companies to provide them, and companies would be motivated not to provide proper safety features due to how it would cut into their profits.
The concept of "market type" is different from the concept of "market structure".
Nevertheless, it is worth noting here that there are a variety of types of markets.
The different market structures produce cost curves based on the type of structure present. The different curves are developed based on the costs of production, specifically the graph contains marginal cost, average total cost, average variable cost, average fixed cost, and marginal revenue, which is sometimes equal to the demand, average revenue, and price in a price-taking firm.
Perfect competition:
Main article: Perfect competition
Perfect competition is a situation in which numerous small firms producing identical products compete against each other in a given industry. Perfect competition leads to firms producing the socially optimal output level at the minimum possible cost per unit. Firms in perfect competition are "price takers" (they do not have enough market power to profitably increase the price of their goods or services).
A good example would be that of digital marketplaces, such as eBay, on which many different sellers sell similar products to many different buyers. Consumers in a perfect competitive market have perfect knowledge about the products that are being sold in this market.
Imperfect competition:
Main article: Imperfect competition
Imperfect competition is a type of market structure showing some but not all features of competitive markets. In perfect competition, market power is not achievable due to a high level of producers causing high levels of competition. Therefore, prices are brought down to a marginal cost level. In a monopoly, market power is achieved by one firm leading to prices being higher than the marginal cost level.
Between these two types of markets are firms that are neither perfectly competitive or monopolistic. Firms such as Pepsi and Coke and Sony, Nintendo and Microsoft dominate the cola and video game industry respectively. These firms are in imperfect competition.
Monopolistic competition:
Main article: Monopolistic competition
Monopolistic competition is a situation in which many firms with slightly different products compete. Production costs are above what may be achieved by perfectly competitive firms, but society benefits from the product differentiation. Examples of industries with market structures similar to monopolistic competition include restaurants, cereal, clothing, shoes, and service industries in large cities.
Monopoly:
Main article: Monopoly
A monopoly is a market structure in which a market or industry is dominated by a single supplier of a particular good or service. Because monopolies have no competition, they tend to sell goods and services at a higher price and produce below the socially optimal output level.
However, not all monopolies are a bad thing, especially in industries where multiple firms would result in more costs than benefits (i.e. natural monopolies).
- Natural monopoly: A monopoly in an industry where one producer can produce output at a lower cost than many small producers.
Oligopoly:
Main article: Oligopoly
An oligopoly is a market structure in which a market or industry is dominated by a small number of firms (oligopolists). Oligopolies can create the incentive for firms to engage in collusion and form cartels that reduce competition leading to higher prices for consumers and less overall market output.
Alternatively, oligopolies can be fiercely competitive and engage in flamboyant advertising campaigns.
- Duopoly: A special case of an oligopoly, with only two firms. Game theory can elucidate behavior in duopolies and oligopolies.
Monopsony:
Main article: Monopsony
A monopsony is a market where there is only one buyer and many sellers.
Bilateral monopoly:
Main article: Bilateral monopoly
A bilateral monopoly is a market consisting of both a monopoly (a single seller) and a monopsony (a single buyer).
Oligopsony:
Main article: Oligopsony
An oligopsony is a market where there are a few buyers and many sellers.
Game theory:
Main article: Game theory
Game theory is a major method used in mathematical economics and business for modeling competing behaviors of interacting agents. The term "game" here implies the study of any strategic interaction between people.
Applications include a wide array of economic phenomena and approaches, such as:
- auctions,
- bargaining,
- mergers & acquisitions pricing,
- fair division,
- duopolies,
- oligopolies,
- social network formation,
- agent-based computational economics,
- general equilibrium,
- mechanism design,
- and voting systems,
- as well as across such broad areas as:
- experimental economics,
- behavioral economics,
- information economics,
- industrial organization,
- and political economy.
Information economics:
Main article: Information economics
Information economics is a branch of microeconomic theory that studies how information and information systems affect an economy and economic decisions. Information has special characteristics. It is easy to create but hard to trust. It is easy to spread but hard to control. It influences many decisions. These special characteristics (as compared with other types of goods) complicate many standard economic theories.
The economics of information has recently become of great interest to many - possibly due to the rise of information-based companies inside the technology industry. From a game theory approach, the usual constraints that agents have complete information can be loosened to further examine the consequences of having incomplete information.
This gives rise to many results which are applicable to real life situations. For example, if one does loosen this assumption, then it is possible to scrutinize the actions of agents in situations of uncertainty. It is also possible to more fully understand the impacts – both positive and negative – of agents seeking out or acquiring information.
Applied
Applied microeconomics includes a range of specialized areas of study, many of which draw on methods from other fields.
- Economic history examines the evolution of the economy and economic institutions, using methods and techniques from the fields of economics, history, geography, sociology, psychology, and political science.
- Education economics examines the organization of education provision and its implication for efficiency and equity, including the effects of education on productivity.
- Financial economics examines topics such as the structure of optimal portfolios, the rate of return to capital, econometric analysis of security returns, and corporate financial behavior.
- Health economics examines the organization of health care systems, including the role of the health care workforce and health insurance programs.
- Industrial organization examines topics such as the entry and exit of firms, innovation, and the role of trademarks.
- Law and economics applies microeconomic principles to the selection and enforcement of competing legal regimes and their relative efficiencies.
- Political economy examines the role of political institutions in determining policy outcomes.
- Public economics examines the design of government tax and expenditure policies and economic effects of these policies (e.g., social insurance programs).
- Urban economics, which examines the challenges faced by cities, such as sprawl, air and water pollution, traffic congestion, and poverty, draws on the fields of urban geography and sociology.
- Labor economics examines primarily labor markets, but comprises a large range of public policy issues such as immigration, minimum wages, or inequality.
- Economics
- Macroeconomics
- Critique of political economy
- X-Lab: A Collaborative Micro-Economics and Social Sciences Research Laboratory
- http://media.lanecc.edu/users/martinezp/201/MicroHistory.html – a brief history of microeconomics
Economic Justice
- YouTube Video about Economic Justice
- YouTube Video: What does economic justice mean to you?
- YouTube Video: Planning for Economic Justice
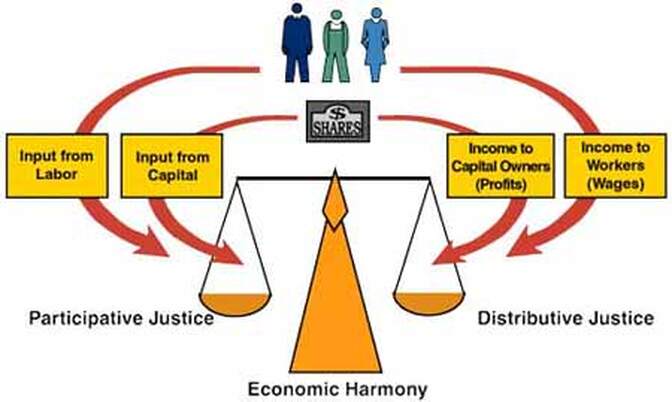
* -- Social and Economic Justice
Economic Initiative, Free Market and Private Property
Social Justice
Social justice encompasses economic justice. Social justice is the virtue which guides us in creating those organized human interactions we call institutions. Subsequently these social institutions can cater the the spiritual needs of people both in their independence and their interactions with others, as long as they are honourably carried out.
Social justice is not only for those who need it, but is also there for those who are capable of providing. Any person who can identify social justice should provide for those in less need, for it is as much a crime to socially oppress someone as to neglect them.
Economic Justice:
Economic justice is basically the economically moral values and principles that guide how social institutions should be conducted. These institutions assists the people in the economic aspects of their lives while keeping it morally good, such as how one earns a living, enters into contracts, exchanges goods and services with others and otherwise produces an independent material foundation for his or her economic sustenance. The ultimate purpose of economic justice is to free each person to engage creatively in the unlimited work beyond economics, that of the mind and the spirit.
Kelso-Adler's Three Principles
Kelso based his ideal market system on three essential and interdependent principles of economic justice:
(1) Participation, the input principle. Kelso Adler states that in a business, the participation and input of all individuals involved must be equal under all circumstances. This includes access to private property in productive assets as well as equality of opportunity to engage in productive work. This principle effectively rejects monopolies, superior opportunity and tries to remove any obstacles to economic equality.
(2) Distribution, the out-take principle. The principles can be simply translated as, "you get what you earn." This principle believes in the economic out take rights of an individual that matches that person's labour and capital input. Instead of looking to the government it relies on the free and open marketplace in order to ensure just prices, just wages, and just profits.
(3) Limitation, the feedback or, in moral terms, the anti-greed principle This principle tries to ensure that the first 2 principles are carried out as justly and as honestly as possible, to create a balanced and just way of business. it tries it's best to restrict monopolies and other types of system where a a single person or party has more control than they should.
10 Principles of Economic Justice
1. Dignity of the Human Person
Belief in the inherent dignity of the human person is the foundation of all Catholic social teaching. Human life is sacred, and the dignity of the human person is the starting point for a moral vision for society.
2. Common Good and Community
The human person is both sacred and social. Human dignity can only be realized and protected in the context of relationships with the wider society.
3. Option for the Poor
The moral test of a society is how it treats its most vulnerable members.
4. Rights and Responsibilities
Human dignity can be protected and a healthy community can be achieved only if human rights are protected and responsibilities are met .
5. Role of Government and Subsidiarity
The state has a positive moral function. It is an instrument to promote human dignity, protect human rights, and build the common good.
6. Economic Justice
The economy must serve people, not the other way around. All workers have a right to productive work, to decent and fair wages, and to safe working conditions.
7. Stewardship of God's Creation
How we treat the environment is a measure of our stewardship, a sign of our respect for the Creator.
8. Promotion of Peace and Disarmament
Catholic teaching promotes peace as a positive, action-oriented concept. In the words of Pope John Paul II, "Peace is not just the absence of war. It involves mutual respect and confidence between peoples and nations. It involves collaboration and binding agreements.”
9. Participation
All people have a right to participate in the economic, political and cultural life of society. It is a fundamental demand of justice and a requirement for human dignity that all people be assured a minimum level of participation in the community.
10. Global Solidarity and Development
We are one human family. Our responsibilities to each other cross national, racial, economic and ideological differences. We are called to work globally for justice.
___________________________________________________________________________
Economic justice (Wikipedia)
Economic justice intersects with economic prosperity as if all members of society can earn wages then they are contributing to the economic growth. These wages are then turned into the buying of goods which works to drive the economy, but it only works if everyone can "provide for themselves and maintain discretionary income."
Justice in economics is a subcategory of social justice and welfare economics. It is a "set of moral and ethical principles for building economic institutions". Economic justice aims to create opportunities for every person to have a dignified, productive and creative life that extends beyond simple economics.
Models of economic justice frequently represent the ethical-social requirements of a given theory, whether "in the large", as of a just social order, or "in the small", as in the equity of "how institutions distribute specific benefits and burdens". That theory may or may not elicit acceptance.
In the Journal of Economic Literature classification codes 'justice' is scrolled to at JEL: D63, wedged on the same line between 'Equity' and 'Inequality' along with 'Other Normative Criteria and Measurement'. Categories above and below the line are Externalities and Altruism.
Some ideas about justice and ethics overlap with the origins of economic thought, often as to distributive justice and sometimes as to Marxian analysis. The subject is a topic of normative economics and philosophy and economics.
In early welfare economics, where mentioned, 'justice' was little distinguished from maximization of all individual utility functions or a social welfare function.
As to the latter, Paul Samuelson (1947),[ expanding on work of Abram Bergson, represents a social welfare function in general terms as any ethical belief system required to order any (hypothetically feasible) social states for the entire society as "better than", "worse than", or "indifferent to" each other.
Kenneth Arrow (1963) demonstrated a difficulty of trying to extend a social welfare function consistently across different hypothetical ordinal utility functions even apart from justice.
Utility maximization survives, even with the rise of ordinal-utility/Pareto theory, as an ethical basis for economic-policy judgments in the wealth-maximization criterion invoked in law and economics.
Amartya Sen (1970), Kenneth Arrow (1983), Serge-Christophe Kolm (1969, 1996, 2000), and others have considered ways in which utilitarianism as an approach to justice is constrained or challenged by independent claims of equality in the distribution of:
Alternate approaches have treated combining concern for the worst off with economic efficiency, the notion of personal responsibility and (de)merits of leveling individual benefits downward, claims of intergenerational justice, and other non-welfarist/Pareto approaches.
Justice is a subarea of social choice theory, for example as to extended sympathy, and more generally in the work of Arrow, Sen, and others.
A broad reinterpretation of justice from the perspective of game theory, social contract theory, and evolutionary naturalism is found in the works of Ken Binmore (1994, 1998, 2004) and others.
Arguments on fairness as an aspect of justice have been invoked to explain a wide range of behavioral and theoretical applications, supplementing earlier emphasis on economic efficiency (Konow, 2003).
See also:
Economic Initiative, Free Market and Private Property
Social Justice
Social justice encompasses economic justice. Social justice is the virtue which guides us in creating those organized human interactions we call institutions. Subsequently these social institutions can cater the the spiritual needs of people both in their independence and their interactions with others, as long as they are honourably carried out.
Social justice is not only for those who need it, but is also there for those who are capable of providing. Any person who can identify social justice should provide for those in less need, for it is as much a crime to socially oppress someone as to neglect them.
Economic Justice:
Economic justice is basically the economically moral values and principles that guide how social institutions should be conducted. These institutions assists the people in the economic aspects of their lives while keeping it morally good, such as how one earns a living, enters into contracts, exchanges goods and services with others and otherwise produces an independent material foundation for his or her economic sustenance. The ultimate purpose of economic justice is to free each person to engage creatively in the unlimited work beyond economics, that of the mind and the spirit.
Kelso-Adler's Three Principles
Kelso based his ideal market system on three essential and interdependent principles of economic justice:
(1) Participation, the input principle. Kelso Adler states that in a business, the participation and input of all individuals involved must be equal under all circumstances. This includes access to private property in productive assets as well as equality of opportunity to engage in productive work. This principle effectively rejects monopolies, superior opportunity and tries to remove any obstacles to economic equality.
(2) Distribution, the out-take principle. The principles can be simply translated as, "you get what you earn." This principle believes in the economic out take rights of an individual that matches that person's labour and capital input. Instead of looking to the government it relies on the free and open marketplace in order to ensure just prices, just wages, and just profits.
(3) Limitation, the feedback or, in moral terms, the anti-greed principle This principle tries to ensure that the first 2 principles are carried out as justly and as honestly as possible, to create a balanced and just way of business. it tries it's best to restrict monopolies and other types of system where a a single person or party has more control than they should.
10 Principles of Economic Justice
1. Dignity of the Human Person
Belief in the inherent dignity of the human person is the foundation of all Catholic social teaching. Human life is sacred, and the dignity of the human person is the starting point for a moral vision for society.
2. Common Good and Community
The human person is both sacred and social. Human dignity can only be realized and protected in the context of relationships with the wider society.
3. Option for the Poor
The moral test of a society is how it treats its most vulnerable members.
4. Rights and Responsibilities
Human dignity can be protected and a healthy community can be achieved only if human rights are protected and responsibilities are met .
5. Role of Government and Subsidiarity
The state has a positive moral function. It is an instrument to promote human dignity, protect human rights, and build the common good.
6. Economic Justice
The economy must serve people, not the other way around. All workers have a right to productive work, to decent and fair wages, and to safe working conditions.
7. Stewardship of God's Creation
How we treat the environment is a measure of our stewardship, a sign of our respect for the Creator.
8. Promotion of Peace and Disarmament
Catholic teaching promotes peace as a positive, action-oriented concept. In the words of Pope John Paul II, "Peace is not just the absence of war. It involves mutual respect and confidence between peoples and nations. It involves collaboration and binding agreements.”
9. Participation
All people have a right to participate in the economic, political and cultural life of society. It is a fundamental demand of justice and a requirement for human dignity that all people be assured a minimum level of participation in the community.
10. Global Solidarity and Development
We are one human family. Our responsibilities to each other cross national, racial, economic and ideological differences. We are called to work globally for justice.
___________________________________________________________________________
Economic justice (Wikipedia)
Economic justice intersects with economic prosperity as if all members of society can earn wages then they are contributing to the economic growth. These wages are then turned into the buying of goods which works to drive the economy, but it only works if everyone can "provide for themselves and maintain discretionary income."
Justice in economics is a subcategory of social justice and welfare economics. It is a "set of moral and ethical principles for building economic institutions". Economic justice aims to create opportunities for every person to have a dignified, productive and creative life that extends beyond simple economics.
Models of economic justice frequently represent the ethical-social requirements of a given theory, whether "in the large", as of a just social order, or "in the small", as in the equity of "how institutions distribute specific benefits and burdens". That theory may or may not elicit acceptance.
In the Journal of Economic Literature classification codes 'justice' is scrolled to at JEL: D63, wedged on the same line between 'Equity' and 'Inequality' along with 'Other Normative Criteria and Measurement'. Categories above and below the line are Externalities and Altruism.
Some ideas about justice and ethics overlap with the origins of economic thought, often as to distributive justice and sometimes as to Marxian analysis. The subject is a topic of normative economics and philosophy and economics.
In early welfare economics, where mentioned, 'justice' was little distinguished from maximization of all individual utility functions or a social welfare function.
As to the latter, Paul Samuelson (1947),[ expanding on work of Abram Bergson, represents a social welfare function in general terms as any ethical belief system required to order any (hypothetically feasible) social states for the entire society as "better than", "worse than", or "indifferent to" each other.
Kenneth Arrow (1963) demonstrated a difficulty of trying to extend a social welfare function consistently across different hypothetical ordinal utility functions even apart from justice.
Utility maximization survives, even with the rise of ordinal-utility/Pareto theory, as an ethical basis for economic-policy judgments in the wealth-maximization criterion invoked in law and economics.
Amartya Sen (1970), Kenneth Arrow (1983), Serge-Christophe Kolm (1969, 1996, 2000), and others have considered ways in which utilitarianism as an approach to justice is constrained or challenged by independent claims of equality in the distribution of:
- primary goods,
- liberty,
- entitlements,
- opportunity,
- exclusion of antisocial preferences,
- possible capabilities,
- and fairness as non-envy
- plus Pareto efficiency.
Alternate approaches have treated combining concern for the worst off with economic efficiency, the notion of personal responsibility and (de)merits of leveling individual benefits downward, claims of intergenerational justice, and other non-welfarist/Pareto approaches.
Justice is a subarea of social choice theory, for example as to extended sympathy, and more generally in the work of Arrow, Sen, and others.
A broad reinterpretation of justice from the perspective of game theory, social contract theory, and evolutionary naturalism is found in the works of Ken Binmore (1994, 1998, 2004) and others.
Arguments on fairness as an aspect of justice have been invoked to explain a wide range of behavioral and theoretical applications, supplementing earlier emphasis on economic efficiency (Konow, 2003).
See also:
- Constitutional economics
- Cost-benefit analysis
- Deadweight loss
- Economic inequality
- Economic security
- Laffer curve
- Pareto efficiency
- Positive economics
- Poverty reduction
- Social equality
- Social justice
- Taxation as theft
Economics including a Glossary of Economics Terms
- YouTube Video: The Role of the Economics Profession in the Global Crisis
- YouTube Video: Inequality of the Economy: Interviewing Secretary Yellen | Jon Stewart | Apple TV+
- YouTube Video: Business PhD vs. Economics PhD: PhD In Business Administration Vs A PhD In Economics? - Thesis Help

Click here foor a Glossary of Economics Terms
Economics
Economics is a social science that studies the production, distribution, and consumption of goods and services.
Economics focuses on the behaviour and interactions of economic agents and how economies work:
Other broad distinctions within economics include those between positive economics, describing "what is", and normative economics, advocating "what ought to be"; between economic theory and applied economics; between rational and behavioural economics; and between mainstream economics and heterodox economics.
Economic analysis can be applied throughout society, including:
It is also applied to such diverse subjects as:
Definitions of economics over time
The earlier term for the discipline was 'political economy', but since the late 19th century, it has commonly been called 'economics'.
The term is ultimately derived from Ancient Greek οἰκονομία (oikonomia) which is a term for the "way (nomos) to run a household (oikos)", or in other words the know-how of an οἰκονομικός (oikonomikos), or "household or homestead manager". Derived terms such as "economy" can therefore often mean "frugal" or "thrifty". By extension then, "political economy" was the way to manage a polis or state.
There are a variety of modern definitions of economics; some reflect evolving views of the subject or different views among economists. Scottish philosopher Adam Smith (1776) defined what was then called political economy as "an inquiry into the nature and causes of the wealth of nations", in particular as a branch of the science of a statesman or legislator [with the twofold objectives of providing] a plentiful revenue or subsistence for the people ... [and] to supply the state or commonwealth with a revenue for the public services.
Jean-Baptiste Say (1803), distinguishing the subject matter from its public-policy uses, defined it as the science of production, distribution, and consumption of wealth.
On the satirical side, Thomas Carlyle (1849) coined "the dismal science" as an epithet for classical economics, in this context, commonly linked to the pessimistic analysis of Malthus (1798).
John Stuart Mill (1844) delimited the subject matter further:
"The science which traces the laws of such of the phenomena of society as arise from the combined operations of mankind for the production of wealth, in so far as those phenomena are not modified by the pursuit of any other object."
Alfred Marshall provided a still widely cited definition in his textbook Principles of Economics (1890) that extended analysis beyond wealth and from the societal to the microeconomic level: "Economics is a study of man in the ordinary business of life. It enquires how he gets his income and how he uses it. Thus, it is on the one side, the study of wealth and on the other and more important side, a part of the study of man."
Lionel Robbins (1932) developed implications of what has been termed "[p]erhaps the most commonly accepted current definition of the subject":
Economics is the science which studies human behaviour as a relationship between ends and scarce means which have alternative uses.
Robbins described the definition as not classificatory in "pick[ing] out certain kinds of behaviour" but rather analytical in "focus[ing] attention on a particular aspect of behaviour, the form imposed by the influence of scarcity." He affirmed that previous economists have usually centred their studies on the analysis of wealth: how wealth is created (production), distributed, and consumed; and how wealth can grow.
But he said that economics can be used to study other things, such as war, that are outside its usual focus. This is because war has as the goal winning it (as a sought after end), generates both cost and benefits; and, resources (human life and other costs) are used to attain the goal. If the war is not winnable or if the expected costs outweigh the benefits, the deciding actors (assuming they are rational) may never go to war (a decision) but rather explore other alternatives.
We cannot define economics as the science that studies wealth, war, crime, education, and any other field economic analysis can be applied to; but, as the science that studies a particular common aspect of each of those subjects (they all use scarce resources to attain a sought after end).
Some subsequent comments criticized the definition as overly broad in failing to limit its subject matter to analysis of markets. From the 1960s, however, such comments abated as the economic theory of maximizing behaviour and rational-choice modelling expanded the domain of the subject to areas previously treated in other fields. There are other criticisms as well, such as in scarcity not accounting for the macroeconomics of high unemployment.
Gary Becker, a contributor to the expansion of economics into new areas, described the approach he favoured as "combin[ing the] assumptions of maximizing behaviour, stable preferences, and market equilibrium, used relentlessly and unflinchingly." One commentary characterizes the remark as making economics an approach rather than a subject matter but with great specificity as to the "choice process and the type of social interaction that [such] analysis involves."
The same source reviews a range of definitions included in principles of economics textbooks and concludes that the lack of agreement need not affect the subject-matter that the texts treat. Among economists more generally, it argues that a particular definition presented may reflect the direction toward which the author believes economics is evolving, or should evolve.
Many economists including nobel prize winners James M. Buchanan and Ronald Coase reject the method-based definition of Robbins and continue to prefer definitions like those of Say, in terms of its subject matter. Ha-Joon Chang has for example argued that the definition of Robbins would make economics very peculiar because all other sciences define themselves in terms of the area of inquiry or object of inquiry rather than the methodology.
In the biology department, they do not say that all biology should be studied with DNA analysis. People study living organisms in many different ways, so some people will do DNA analysis, others might do anatomy, and still others might build game theoretic models of animal behavior. But they are all called biology because they all study living organisms.
According to Ha Joon Chang, this view that you can and should study the economy in only one way (for example by studying only rational choices), and going even one step further and basically redefining economics as a theory of everything, is very peculiar.
Profession:
Main article: Economist
The professionalization of economics, reflected in the growth of graduate programmes on the subject, has been described as "the main change in economics since around 1900". Most major universities and many colleges have a major, school, or department in which academic degrees are awarded in the subject, whether in the liberal arts, business, or for professional study. See Bachelor of Economics and Master of Economics.
In the private sector, professional economists are employed as consultants and in industry, including banking and finance. Economists also work for various government departments and agencies, for example, the national treasury, central bank or National Bureau of Statistics. See Economic analyst.
There are dozens of prizes awarded to economists each year for outstanding intellectual contributions to the field, the most prominent of which is the Nobel Memorial Prize in Economic Sciences, though it is not a Nobel Prize.
Contemporary economics uses mathematics. Economists draw on the tools of calculus, linear algebra, statistics, game theory, and computer science. Professional economists are expected to be familiar with these tools, while a minority specialize in econometrics and mathematical methods.
Women in economics:
Harriet Martineau (1802–1876) was a widely-read populariser of classical economic thought.
Mary Paley Marshall (1850–1944), the first women lecturer at a British economics faculty, wrote The Economics of Industry with her husband Alfred Marshall.
Joan Robinson (1903–1983) was an important post-Keynesian economist.
The economic historian Anna Schwartz (1915–2012) coauthored A Monetary History of the United States, 1867–1960 with Milton Friedman.
Two women have received the Nobel Prize in Economics: Elinor Ostrom (2009) and Esther Duflo (2019). Five have received the John Bates Clark Medal:
Women's authorship share in prominent economic journals reduced from 1940 to the 1970s, but has subsequently risen, with different patterns of gendered co-authorship. Women remain globally under-represented in the profession (19% of authors in the RePEc database in 2018), with national variation.
Click on any of the following blue hyperlinks for more about Economics:
Economics
Economics is a social science that studies the production, distribution, and consumption of goods and services.
Economics focuses on the behaviour and interactions of economic agents and how economies work:
- Microeconomics analyzes what's viewed as basic elements in the economy, including individual agents and markets, their interactions, and the outcomes of interactions. Individual agents may include, for example, households, firms, buyers, and sellers.
- Macroeconomics analyzes the economy as a system where production, consumption, saving, and investment interact, and factors affecting it: employment of the resources of labour, capital, and land, currency inflation, economic growth, and public policies that have impact on these elements.
Other broad distinctions within economics include those between positive economics, describing "what is", and normative economics, advocating "what ought to be"; between economic theory and applied economics; between rational and behavioural economics; and between mainstream economics and heterodox economics.
Economic analysis can be applied throughout society, including:
It is also applied to such diverse subjects as:
- crime,
- education,
- the family,
- feminism,
- law,
- philosophy,
- politics,
- religion,
- social institutions,
- war,
- science,
- and the environment.
Definitions of economics over time
The earlier term for the discipline was 'political economy', but since the late 19th century, it has commonly been called 'economics'.
The term is ultimately derived from Ancient Greek οἰκονομία (oikonomia) which is a term for the "way (nomos) to run a household (oikos)", or in other words the know-how of an οἰκονομικός (oikonomikos), or "household or homestead manager". Derived terms such as "economy" can therefore often mean "frugal" or "thrifty". By extension then, "political economy" was the way to manage a polis or state.
There are a variety of modern definitions of economics; some reflect evolving views of the subject or different views among economists. Scottish philosopher Adam Smith (1776) defined what was then called political economy as "an inquiry into the nature and causes of the wealth of nations", in particular as a branch of the science of a statesman or legislator [with the twofold objectives of providing] a plentiful revenue or subsistence for the people ... [and] to supply the state or commonwealth with a revenue for the public services.
Jean-Baptiste Say (1803), distinguishing the subject matter from its public-policy uses, defined it as the science of production, distribution, and consumption of wealth.
On the satirical side, Thomas Carlyle (1849) coined "the dismal science" as an epithet for classical economics, in this context, commonly linked to the pessimistic analysis of Malthus (1798).
John Stuart Mill (1844) delimited the subject matter further:
"The science which traces the laws of such of the phenomena of society as arise from the combined operations of mankind for the production of wealth, in so far as those phenomena are not modified by the pursuit of any other object."
Alfred Marshall provided a still widely cited definition in his textbook Principles of Economics (1890) that extended analysis beyond wealth and from the societal to the microeconomic level: "Economics is a study of man in the ordinary business of life. It enquires how he gets his income and how he uses it. Thus, it is on the one side, the study of wealth and on the other and more important side, a part of the study of man."
Lionel Robbins (1932) developed implications of what has been termed "[p]erhaps the most commonly accepted current definition of the subject":
Economics is the science which studies human behaviour as a relationship between ends and scarce means which have alternative uses.
Robbins described the definition as not classificatory in "pick[ing] out certain kinds of behaviour" but rather analytical in "focus[ing] attention on a particular aspect of behaviour, the form imposed by the influence of scarcity." He affirmed that previous economists have usually centred their studies on the analysis of wealth: how wealth is created (production), distributed, and consumed; and how wealth can grow.
But he said that economics can be used to study other things, such as war, that are outside its usual focus. This is because war has as the goal winning it (as a sought after end), generates both cost and benefits; and, resources (human life and other costs) are used to attain the goal. If the war is not winnable or if the expected costs outweigh the benefits, the deciding actors (assuming they are rational) may never go to war (a decision) but rather explore other alternatives.
We cannot define economics as the science that studies wealth, war, crime, education, and any other field economic analysis can be applied to; but, as the science that studies a particular common aspect of each of those subjects (they all use scarce resources to attain a sought after end).
Some subsequent comments criticized the definition as overly broad in failing to limit its subject matter to analysis of markets. From the 1960s, however, such comments abated as the economic theory of maximizing behaviour and rational-choice modelling expanded the domain of the subject to areas previously treated in other fields. There are other criticisms as well, such as in scarcity not accounting for the macroeconomics of high unemployment.
Gary Becker, a contributor to the expansion of economics into new areas, described the approach he favoured as "combin[ing the] assumptions of maximizing behaviour, stable preferences, and market equilibrium, used relentlessly and unflinchingly." One commentary characterizes the remark as making economics an approach rather than a subject matter but with great specificity as to the "choice process and the type of social interaction that [such] analysis involves."
The same source reviews a range of definitions included in principles of economics textbooks and concludes that the lack of agreement need not affect the subject-matter that the texts treat. Among economists more generally, it argues that a particular definition presented may reflect the direction toward which the author believes economics is evolving, or should evolve.
Many economists including nobel prize winners James M. Buchanan and Ronald Coase reject the method-based definition of Robbins and continue to prefer definitions like those of Say, in terms of its subject matter. Ha-Joon Chang has for example argued that the definition of Robbins would make economics very peculiar because all other sciences define themselves in terms of the area of inquiry or object of inquiry rather than the methodology.
In the biology department, they do not say that all biology should be studied with DNA analysis. People study living organisms in many different ways, so some people will do DNA analysis, others might do anatomy, and still others might build game theoretic models of animal behavior. But they are all called biology because they all study living organisms.
According to Ha Joon Chang, this view that you can and should study the economy in only one way (for example by studying only rational choices), and going even one step further and basically redefining economics as a theory of everything, is very peculiar.
Profession:
Main article: Economist
The professionalization of economics, reflected in the growth of graduate programmes on the subject, has been described as "the main change in economics since around 1900". Most major universities and many colleges have a major, school, or department in which academic degrees are awarded in the subject, whether in the liberal arts, business, or for professional study. See Bachelor of Economics and Master of Economics.
In the private sector, professional economists are employed as consultants and in industry, including banking and finance. Economists also work for various government departments and agencies, for example, the national treasury, central bank or National Bureau of Statistics. See Economic analyst.
There are dozens of prizes awarded to economists each year for outstanding intellectual contributions to the field, the most prominent of which is the Nobel Memorial Prize in Economic Sciences, though it is not a Nobel Prize.
Contemporary economics uses mathematics. Economists draw on the tools of calculus, linear algebra, statistics, game theory, and computer science. Professional economists are expected to be familiar with these tools, while a minority specialize in econometrics and mathematical methods.
Women in economics:
Harriet Martineau (1802–1876) was a widely-read populariser of classical economic thought.
Mary Paley Marshall (1850–1944), the first women lecturer at a British economics faculty, wrote The Economics of Industry with her husband Alfred Marshall.
Joan Robinson (1903–1983) was an important post-Keynesian economist.
The economic historian Anna Schwartz (1915–2012) coauthored A Monetary History of the United States, 1867–1960 with Milton Friedman.
Two women have received the Nobel Prize in Economics: Elinor Ostrom (2009) and Esther Duflo (2019). Five have received the John Bates Clark Medal:
- Susan Athey (2007),
- Esther Duflo (2010),
- Amy Finkelstein (2012),
- Emi Nakamura (2019)
- and Melissa Dell (2020).
Women's authorship share in prominent economic journals reduced from 1940 to the 1970s, but has subsequently risen, with different patterns of gendered co-authorship. Women remain globally under-represented in the profession (19% of authors in the RePEc database in 2018), with national variation.
Click on any of the following blue hyperlinks for more about Economics:
- History of economic thought
- Methodology
- Microeconomics
- Macroeconomics
- Other branches of economics
- Criticism
- Related subjects
- See also:
- Critical juncture theory
- Economic democracy
- Economic ideology
- Economic policy
- Economic union
- Economics terminology that differs from common usage
- Free trade
- Happiness economics
- Humanistic economics
- List of academic fields § Economics
- List of economics awards
- List of economics films
- Socioeconomics
- Solidarity economy
- General
- Index of economics articles
- JEL classification codes for classifying articles in economics journals and books on economics by subject matter from 1886 to the present.
- Outline of economics
Economists, including a List of Nobel Memorial Prize Laureates in Economics
- YouTube Video: What is economics and what do economists do?
- YouTube Video: Nobel Prize 2022 LIVE: Economic Sciences Prize Announcement | Nobel Memorial Prize
- YouTube Video: What's the best thing about a career in economics?
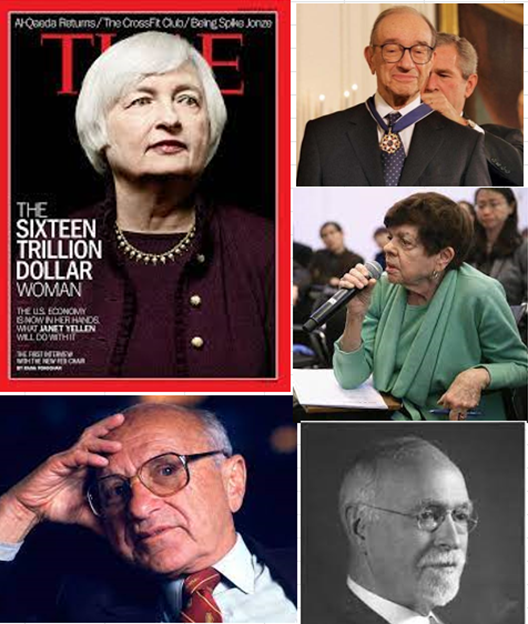
Click here for List of Nobel Memorial Prize laureates in Economics.
An Economist is a professional and practitioner in the social science discipline of economics.
The individual may also study, develop, and apply theories and concepts from economics and write about economic policy. Within this field there are many sub-fields, ranging from the broad philosophical theories to the focused study of minutiae within specific:
Professions:
Economists work in many fields including academia, government and in the private sector, where they may also "study data and statistics in order to spot trends in economic activity, economic confidence levels, and consumer attitudes.
They assess this information using advanced methods in statistical analysis, mathematics, computer programming [and] they make recommendations about ways to improve the efficiency of a system or take advantage of trends as they begin." In addition to government and academia, economists are also employed in:
In many organizations, an "Economic Analyst" is a formalized role. Professionals here are employed (or engaged as consultants) to conduct research, prepare reports, or formulate plans and strategies to address economic problems.
Here, as outlined, the analyst provides forecasts, analysis and advice, based upon observed trends and economic principles; this entails also collecting and processing economic and statistical data using econometric methods and statistical techniques.
In contrast to regulated professions such as engineering, law or medicine, there is not a legally required educational requirement or license for economists. In academia, most economists have a Ph.D. degree in Economics. In the U.S. Government, on the other hand, a person can be hired as an economist provided that they have a degree that included or was supplemented by 21 semester hours in economics and three hours in statistics, accounting, or calculus.
In fact, a professional working inside of one of many fields of economics or having an academic degree in this subject is often considered to be an economist; see Bachelor of Economics and Master of Economics.
By country:
Economics graduates are employable in varying degrees depending on the regional economic scenario and labour market conditions at the time for a given country. Apart from the specific understanding of the subject, employers value the skills of numeracy and analysis, the ability to communicate and the capacity to grasp broad issues which the graduates acquire at the university or college.
While only a few economics graduates may be expected to become professional economists, many find it a base for entry into a career in finance – including accounting, insurance, tax and banking, or management; see financial analyst.
A number of economics graduates from around the world have been successful in obtaining employment in a variety of major national and international firms in the financial and commercial sectors, and in manufacturing, retailing and IT, as well as in the public sector – for example, in the health and education sectors, or in government and politics.
Small numbers go on to undertake postgraduate studies, either in economics, research, teacher training or further qualifications in specialist areas.
Brazil:
In Brazil, unlike most countries in the world where the profession is not regulated, the profession of Economist is regulated by Law. 1411 of August 13, 1951. The professional designation of economist, according to the said law, is exclusive to the bachelors in economics graduates in Brazil.
United States:
According to the United States Department of Labor, there were about 15,000 non-academic economists in the United States in 2008, with a median salary of roughly $83,000, and the top ten percent earning more than $147,040 annually.
Nearly 135 colleges and universities grant around 900 new Ph.D.s every year. Incomes are highest for those in the private sector, followed by the federal government, with academia paying the lowest incomes.
As of January 2013, PayScale.com showed Ph.D. economists' salary ranges as follows:
United Kingdom:
The largest single professional grouping of economists in the UK are the more than 3500 members of the Government Economic Service.
Analysis of destination surveys for economics graduates from a number of selected top schools of economics in the United Kingdom (ranging from Newcastle University to the London School of Economics), shows nearly 80 percent in employment six months after graduation – with a wide range of roles and employers, including regional, national and international organisations, across many sectors. This figure compares very favourably with the national picture, with 64 percent of economics graduates in employment.
Click on any of the following blue hyperlinks for more about Economists:
An Economist is a professional and practitioner in the social science discipline of economics.
The individual may also study, develop, and apply theories and concepts from economics and write about economic policy. Within this field there are many sub-fields, ranging from the broad philosophical theories to the focused study of minutiae within specific:
- markets,
- macroeconomic analysis,
- microeconomic analysis
- or financial statement analysis,
- involving analytical methods and tools such as
Professions:
Economists work in many fields including academia, government and in the private sector, where they may also "study data and statistics in order to spot trends in economic activity, economic confidence levels, and consumer attitudes.
They assess this information using advanced methods in statistical analysis, mathematics, computer programming [and] they make recommendations about ways to improve the efficiency of a system or take advantage of trends as they begin." In addition to government and academia, economists are also employed in:
- banking,
- finance,
- accountancy,
- commerce,
- marketing,
- business administration,
- lobbying and
- non- or not-for profit organizations.
In many organizations, an "Economic Analyst" is a formalized role. Professionals here are employed (or engaged as consultants) to conduct research, prepare reports, or formulate plans and strategies to address economic problems.
Here, as outlined, the analyst provides forecasts, analysis and advice, based upon observed trends and economic principles; this entails also collecting and processing economic and statistical data using econometric methods and statistical techniques.
- Economic analysts employed in financial institutions and in other large corporates, provide the (long term) economic forecasts used within their organizations; here, they also advise fund managers, risk managers, and corporate analysts re their investment / capital budgeting decisions; they may also be involved in strategy formulation.
- In the public sector:
- analysts advise legislators and executives on economic policy, public works, and related;
- politicians often consult economists before enacting economic policy;
- and many statesmen have academic degrees in economics.
- A Federal Government Economic Analyst conducts economic analysis of issues directly related to the function of their federal government agency.
In contrast to regulated professions such as engineering, law or medicine, there is not a legally required educational requirement or license for economists. In academia, most economists have a Ph.D. degree in Economics. In the U.S. Government, on the other hand, a person can be hired as an economist provided that they have a degree that included or was supplemented by 21 semester hours in economics and three hours in statistics, accounting, or calculus.
In fact, a professional working inside of one of many fields of economics or having an academic degree in this subject is often considered to be an economist; see Bachelor of Economics and Master of Economics.
By country:
Economics graduates are employable in varying degrees depending on the regional economic scenario and labour market conditions at the time for a given country. Apart from the specific understanding of the subject, employers value the skills of numeracy and analysis, the ability to communicate and the capacity to grasp broad issues which the graduates acquire at the university or college.
While only a few economics graduates may be expected to become professional economists, many find it a base for entry into a career in finance – including accounting, insurance, tax and banking, or management; see financial analyst.
A number of economics graduates from around the world have been successful in obtaining employment in a variety of major national and international firms in the financial and commercial sectors, and in manufacturing, retailing and IT, as well as in the public sector – for example, in the health and education sectors, or in government and politics.
Small numbers go on to undertake postgraduate studies, either in economics, research, teacher training or further qualifications in specialist areas.
Brazil:
In Brazil, unlike most countries in the world where the profession is not regulated, the profession of Economist is regulated by Law. 1411 of August 13, 1951. The professional designation of economist, according to the said law, is exclusive to the bachelors in economics graduates in Brazil.
United States:
According to the United States Department of Labor, there were about 15,000 non-academic economists in the United States in 2008, with a median salary of roughly $83,000, and the top ten percent earning more than $147,040 annually.
Nearly 135 colleges and universities grant around 900 new Ph.D.s every year. Incomes are highest for those in the private sector, followed by the federal government, with academia paying the lowest incomes.
As of January 2013, PayScale.com showed Ph.D. economists' salary ranges as follows:
- all Ph.D. economists,
- $61,000 to $160,000;
- Ph.D. corporate economists, $71,000 to $207,000;
- economics full professors, $89,000 to $137,000;
- economics associate professors, $59,000 to $156,000,
- and economics assistant professors, $72,000 to $100,000.
United Kingdom:
The largest single professional grouping of economists in the UK are the more than 3500 members of the Government Economic Service.
Analysis of destination surveys for economics graduates from a number of selected top schools of economics in the United Kingdom (ranging from Newcastle University to the London School of Economics), shows nearly 80 percent in employment six months after graduation – with a wide range of roles and employers, including regional, national and international organisations, across many sectors. This figure compares very favourably with the national picture, with 64 percent of economics graduates in employment.
Click on any of the following blue hyperlinks for more about Economists:
Economic Systems, including a List of Economic Systems
- YouTube Video: Types of Goods and the Four Main Economic Systems
- YouTube Video: The 4 Types of Economies | Economics Concepts Explained
- YouTube Video: What is a Command Economy?
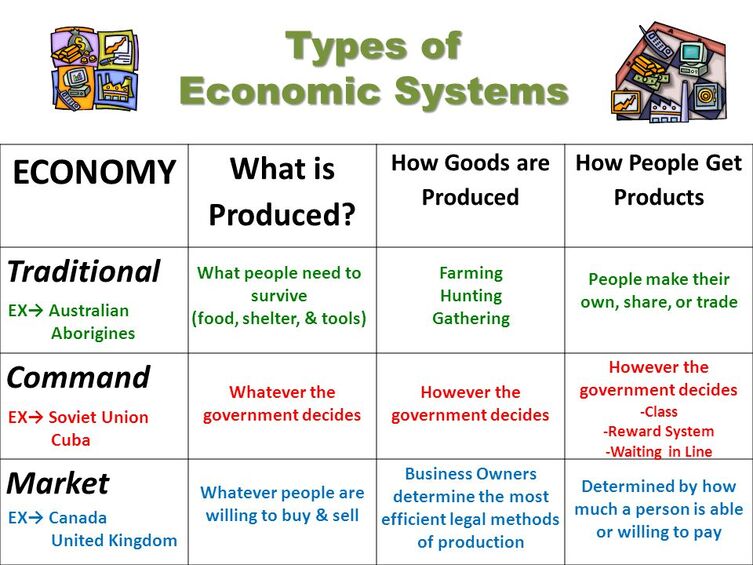
Click here for a List of Economic Systems.
An economic system, or economic order, is a system of production, resource allocation and distribution of goods and services within a society. It includes the combination of the various institutions, agencies, entities, decision-making processes, and patterns of consumption that comprise the economic structure of a given community.
An economic system is a type of social system. The mode of production is a related concept.
All economic systems must confront and solve the four fundamental economic problems:
The study of economic systems includes how these various agencies and institutions are linked to one another, how information flows between them, and the social relations within the system (including property rights and the structure of management). The analysis of economic systems traditionally focused on the dichotomies and comparisons between market economies and planned economies and on the distinctions between capitalism and socialism.
Subsequently, the categorization of economic systems expanded to include other topics and models that do not conform to the traditional dichotomy.
Today the dominant form of economic organization at the world level is based on market-oriented mixed economies. An economic system can be considered a part of the social system and hierarchically equal to the law system, political system, cultural and so on.
There is often a strong correlation between certain ideologies, political systems and certain economic systems (for example, consider the meanings of the term "communism"). Many economic systems overlap each other in various areas (for example, the term "mixed economy" can be argued to include elements from various systems).
There are also various mutually exclusive hierarchical categorizations.
List of economic systems:
Academic field of study:
Economic systems is the category in the Journal of Economic Literature classification codes that includes the study of such systems. One field that cuts across them is comparative economic systems, which includes the study of the following aspects of different systems:
Main types:
Capitalism:
Capitalism generally features the private ownership of the means of production (capital) and a market economy for coordination. Corporate capitalism refers to a capitalist marketplace characterized by the dominance of hierarchical, bureaucratic corporations.
Mercantilism was the dominant model in Western Europe from the 16th to 18th century. This encouraged imperialism and colonialism until economic and political changes resulted in global decolonization.
Modern capitalism has favored free trade to take advantage of increased efficiency due to national comparative advantage and economies of scale in a larger, more universal market.
Some critics have applied the term neo-colonialism to the power imbalance between multi-national corporations operating in a free market vs. seemingly impoverished people in developing countries.
Mixed economy:
There is no precise definition of a "mixed economy". Theoretically, it may refer to an economic system that combines one of three characteristics: public and private ownership of industry, market-based allocation with economic planning, or free markets with state interventionism.
In practice, "mixed economy" generally refers to market economies with substantial state interventionism and/or sizable public sector alongside a dominant private sector. Actually, mixed economies gravitate more heavily to one end of the spectrum. Notable economic models and theories that have been described as a "mixed economy" include the following:
Socialist economy:
Socialist economic systems (all of which feature social ownership of the means of production) can be subdivided by their coordinating mechanism (planning and markets) into planned socialist and market socialist systems. Additionally, socialism can be divided based on their property structures between those that are based on public ownership, worker or consumer cooperatives and common ownership (i.e. non-ownership).
Communism is a hypothetical stage of socialist development articulated by Karl Marx as "second stage socialism" in Critique of the Gotha Program, whereby the economic output is distributed based on need and not simply on the basis of labor contribution.
The original conception of socialism involved the substitution of money as a unit of calculation and monetary prices as a whole with calculation in kind (or a valuation based on natural units), with business and financial decisions replaced by engineering and technical criteria for managing the economy. Fundamentally, this meant that socialism would operate under different economic dynamics than those of capitalism and the price system.
Later models of socialism developed by neoclassical economists (most notably Oskar Lange and Abba Lerner) were based on the use of notional prices derived from a trial-and-error approach to achieve market clearing prices on the part of a planning agency. These models of socialism were called "market socialism" because they included a role for markets, money, and prices.
The primary emphasis of socialist planned economies is to coordinate production to produce economic output to directly satisfy economic demand as opposed to the indirect mechanism of the profit system where satisfying needs is subordinate to the pursuit of profit; and to advance the productive forces of the economy in a more efficient manner while being immune to the perceived systemic inefficiencies (cyclical processes) and crisis of overproduction so that production would be subject to the needs of society as opposed to being ordered around capital accumulation.
In a pure socialist planned economy that involves different processes of resource allocation, production and means of quantifying value, the use of money would be replaced with a different measure of value and accounting tool that would embody more accurate information about an object or resource. In practice, the economic system of the former Soviet Union and Eastern Bloc operated as a command economy, featuring a combination of state-owned enterprises and central planning using the material balances method.
The extent to which these economic systems achieved socialism or represented a viable alternative to capitalism is subject to debate.
In orthodox Marxism, the mode of production is tantamount to the subject of this article, determining with a superstructure of relations the entirety of a given culture or stage of human development.
Components:
There are multiple components of an economic system. Decision-making structures of an economy determine the use of economic inputs (the factors of production), distribution of output, the level of centralization in decision-making and who makes these decisions.
Decisions might be carried out by industrial councils, by a government agency, or by private owners.
An economic system is a system of production, resource allocation, exchange and distribution of goods and services in a society or a given geographic area. In one view, every economic system represents an attempt to solve three fundamental and interdependent problems:
Every economy is thus a system that allocates resources for exchange, production, distribution and consumption. The system is stabilized through a combination of threat and trust, which are the outcome of institutional arrangements.
An economic system possesses the following institutions:
There are several basic questions that must be answered in order for an economy to run satisfactorily. The scarcity problem, for example, requires answers to basic questions, such as what to produce, how to produce it and who gets what is produced. An economic system is a way of answering these basic questions and different economic systems answer them differently. Many different objectives may be seen as desirable for an economy, like efficiency, growth, liberty and equality.
Economic systems are commonly segmented by their property rights regime for the means of production and by their dominant resource allocation mechanism. Economies that combine private ownership with market allocation are called "market capitalism" and economies that combine private ownership with economic planning are labelled "command capitalism" or dirigisme.
Likewise, systems that mix public or cooperative ownership of the means of production with economic planning are called "socialist planned economies" and systems that combine public or cooperative ownership with markets are called "market socialism".
Some perspectives build upon this basic nomenclature to take other variables into account, such as class processes within an economy. This leads some economists to categorize, for example, the Soviet Union's economy as state capitalism based on the analysis that the working class was exploited by the party leadership.
Instead of looking at nominal ownership, this perspective takes into account the organizational form within economic enterprises.
In a capitalist economic system, production is carried out for private profit and decisions regarding investment and allocation of factor inputs are determined by business owners in factor markets. The means of production are primarily owned by private enterprises and decisions regarding production and investment are determined by private owners in capital markets.
Capitalist systems range from laissez-faire, with minimal government regulation and state enterprise, to regulated and social market systems, with the aims of ameliorating market failures (see economic intervention) or supplementing the private marketplace with social policies to promote equal opportunities (see welfare state), respectively.
In socialist economic systems (socialism), production for use is carried out; decisions regarding the use of the means of production are adjusted to satisfy economic demand; and investment is determined through economic planning procedures. There is a wide range of proposed planning procedures and ownership structures for socialist systems, with the common feature among them being the social ownership of the means of production.
This might take the form of public ownership by all of the society, or ownership cooperatively by their employees. A socialist economic system that features social ownership, but that it is based on the process of capital accumulation and utilization of capital markets for the allocation of capital goods between socially owned enterprises falls under the subcategory of market socialism.
By resource allocation mechanism:
The basic and general "modern" economic systems segmented by the criterium of resource allocation mechanism are:
Other types:
By ownership of the means of production:
By political ideologies:
Various strains of anarchism and libertarianism advocate different economic systems, all of which have very small or no government involvement. These include:
By other criteria:
Corporatism refers to economic tripartite involving negotiations between business, labor and state interest groups to establish economic policy, or more generally to assigning people to political groups based on their occupational affiliation.
Certain subsets of an economy, or the particular goods, services, techniques of production, or moral rules can also be described as an "economy". For example, some terms emphasize specific sectors or externalizes:
Others emphasize a particular religion:
The type of labour power:
Or the means of production:
Evolutionary economics:
See also: Evolutionary economics
Karl Marx's theory of economic development was based on the premise of evolving economic systems. Specifically, in his view over the course of history superior economic systems would replace inferior ones. Inferior systems were beset by internal contradictions and inefficiencies that would make it impossible for them to survive long-term.
In Marx's scheme, feudalism was replaced by capitalism, which would eventually be superseded by socialism. Joseph Schumpeter had an evolutionary conception of economic development, but unlike Marx he de-emphasized the role of class struggle in contributing to qualitative change in the economic mode of production.
In subsequent world history, many communist states run according to Marxist–Leninist ideologies arose during the 20th century, but by the 1990s they had either ceased to exist or gradually reformed their centrally planned economies toward market-based economies, for example with perestroika and the dissolution of the Soviet Union, Chinese economic reform and Đổi Mới in Vietnam.
Mainstream evolutionary economics continues to study economic change in modern times. There has also been renewed interest in understanding economic systems as evolutionary systems in the emerging field of complexity economics.
See also:
An economic system, or economic order, is a system of production, resource allocation and distribution of goods and services within a society. It includes the combination of the various institutions, agencies, entities, decision-making processes, and patterns of consumption that comprise the economic structure of a given community.
An economic system is a type of social system. The mode of production is a related concept.
All economic systems must confront and solve the four fundamental economic problems:
- What kinds and quantities of goods shall be produced: This fundamental economic problem is anchored on the theory of pricing. The theory of pricing, in this context, has to do with the economic decision-making between the production of capital goods and consumer goods in the economy in the face of scarce resources. In this regard, the critical evaluation of the needs of the society based on population distribution in terms of age, sex, occupation, and geography is very pertinent.
- How goods shall be produced: The fundamental problem of how goods shall be produced is largely hinged on the least-cost method of production to be adopted as gainfully peculiar to the economically decided goods and services to be produced. On a broad note, the possible production method includes labor-intensive and capital-intensive methods.
- How the output will be distributed: Production is said to be completed when the goods get to the final consumers. This fundamental problem of how the output will be distributed seeks to identify the best possible medium through which bottlenecks and the clogs in the wheel of the chain of economic resources distributions can reduce to the barest minimum and optimize consumers' satisfaction.
- When to produce: Consumer satisfaction is partly a function of seasonal analysis as the forces of demand and supply have a lot to do with time. This fundamental economic problem requires an intensive study of time dynamics and seasonal variation vis-a-vis the satisfaction of consumers' needs. It is noteworthy to state that solutions to these fundamental problems can be determined by the type of economic system.
The study of economic systems includes how these various agencies and institutions are linked to one another, how information flows between them, and the social relations within the system (including property rights and the structure of management). The analysis of economic systems traditionally focused on the dichotomies and comparisons between market economies and planned economies and on the distinctions between capitalism and socialism.
Subsequently, the categorization of economic systems expanded to include other topics and models that do not conform to the traditional dichotomy.
Today the dominant form of economic organization at the world level is based on market-oriented mixed economies. An economic system can be considered a part of the social system and hierarchically equal to the law system, political system, cultural and so on.
There is often a strong correlation between certain ideologies, political systems and certain economic systems (for example, consider the meanings of the term "communism"). Many economic systems overlap each other in various areas (for example, the term "mixed economy" can be argued to include elements from various systems).
There are also various mutually exclusive hierarchical categorizations.
List of economic systems:
- Anarchy
- Capitalism
- Communism
- Dirigisme
- Distributism
- Feudalism
- Hydraulic despotism
- Inclusive democracy
- Market economy
- Mercantilism
- Mutualism
- Network economy
- Non-property system
- Palace economy
- Participatory economy
- Potlatch
- Progressive utilization theory (PROUTist economy)
- Proprietism
- Resource-based economy
- Social Credit
- Socialism
- Statism
- Workers' self-management
Academic field of study:
Economic systems is the category in the Journal of Economic Literature classification codes that includes the study of such systems. One field that cuts across them is comparative economic systems, which includes the study of the following aspects of different systems:
- Planning, coordination and reform.
- Productive enterprises; factor and product markets; prices; population.
- National income, product and expenditure; money; inflation.
- International trade, finance, investment and aid.
- Consumer economics; welfare and poverty.
- Performance and prospects.
- Natural resources; energy; environment; regional studies.
- Political economy; legal institutions; property rights.
Main types:
Capitalism:
Capitalism generally features the private ownership of the means of production (capital) and a market economy for coordination. Corporate capitalism refers to a capitalist marketplace characterized by the dominance of hierarchical, bureaucratic corporations.
Mercantilism was the dominant model in Western Europe from the 16th to 18th century. This encouraged imperialism and colonialism until economic and political changes resulted in global decolonization.
Modern capitalism has favored free trade to take advantage of increased efficiency due to national comparative advantage and economies of scale in a larger, more universal market.
Some critics have applied the term neo-colonialism to the power imbalance between multi-national corporations operating in a free market vs. seemingly impoverished people in developing countries.
Mixed economy:
There is no precise definition of a "mixed economy". Theoretically, it may refer to an economic system that combines one of three characteristics: public and private ownership of industry, market-based allocation with economic planning, or free markets with state interventionism.
In practice, "mixed economy" generally refers to market economies with substantial state interventionism and/or sizable public sector alongside a dominant private sector. Actually, mixed economies gravitate more heavily to one end of the spectrum. Notable economic models and theories that have been described as a "mixed economy" include the following:
- Georgism – socialized rents on land
- Mixed economy (It can be categorized under many titles)
- American School
- Dirigisme (Government-directed capitalist economy)
- Indicative planning, also known as a planned market economy
- Japanese system
- Nordic model (Social democrat economics of Nordic countries)
- Progressive utilization theory
- Corporatism (economies based on tripartite negotiation between labor, capital, and the state)
- Social market economy, also known as Soziale Marktwirtschaft (Mixed capitalist)
- New Economic Policy (Mixed socialist)
- State capitalism (Government-dominated capitalist economy)
- Socialist Market Economy (Mixed socialist)
Socialist economy:
Socialist economic systems (all of which feature social ownership of the means of production) can be subdivided by their coordinating mechanism (planning and markets) into planned socialist and market socialist systems. Additionally, socialism can be divided based on their property structures between those that are based on public ownership, worker or consumer cooperatives and common ownership (i.e. non-ownership).
Communism is a hypothetical stage of socialist development articulated by Karl Marx as "second stage socialism" in Critique of the Gotha Program, whereby the economic output is distributed based on need and not simply on the basis of labor contribution.
The original conception of socialism involved the substitution of money as a unit of calculation and monetary prices as a whole with calculation in kind (or a valuation based on natural units), with business and financial decisions replaced by engineering and technical criteria for managing the economy. Fundamentally, this meant that socialism would operate under different economic dynamics than those of capitalism and the price system.
Later models of socialism developed by neoclassical economists (most notably Oskar Lange and Abba Lerner) were based on the use of notional prices derived from a trial-and-error approach to achieve market clearing prices on the part of a planning agency. These models of socialism were called "market socialism" because they included a role for markets, money, and prices.
The primary emphasis of socialist planned economies is to coordinate production to produce economic output to directly satisfy economic demand as opposed to the indirect mechanism of the profit system where satisfying needs is subordinate to the pursuit of profit; and to advance the productive forces of the economy in a more efficient manner while being immune to the perceived systemic inefficiencies (cyclical processes) and crisis of overproduction so that production would be subject to the needs of society as opposed to being ordered around capital accumulation.
In a pure socialist planned economy that involves different processes of resource allocation, production and means of quantifying value, the use of money would be replaced with a different measure of value and accounting tool that would embody more accurate information about an object or resource. In practice, the economic system of the former Soviet Union and Eastern Bloc operated as a command economy, featuring a combination of state-owned enterprises and central planning using the material balances method.
The extent to which these economic systems achieved socialism or represented a viable alternative to capitalism is subject to debate.
In orthodox Marxism, the mode of production is tantamount to the subject of this article, determining with a superstructure of relations the entirety of a given culture or stage of human development.
Components:
There are multiple components of an economic system. Decision-making structures of an economy determine the use of economic inputs (the factors of production), distribution of output, the level of centralization in decision-making and who makes these decisions.
Decisions might be carried out by industrial councils, by a government agency, or by private owners.
An economic system is a system of production, resource allocation, exchange and distribution of goods and services in a society or a given geographic area. In one view, every economic system represents an attempt to solve three fundamental and interdependent problems:
- What goods and services shall be produced and in what quantities?
- How shall goods and services be produced? That is, by whom and with what resources and technologies?
- For whom shall goods and services be produced? That is, who is to enjoy the benefits of the goods and services and how is the total product to be distributed among individuals and groups in the society?
Every economy is thus a system that allocates resources for exchange, production, distribution and consumption. The system is stabilized through a combination of threat and trust, which are the outcome of institutional arrangements.
An economic system possesses the following institutions:
- Methods of control over the factors or means of production: this may include ownership of, or property rights to, the means of production and therefore may give rise to claims to the proceeds from production. The means of production may be owned privately, by the state, by those who use them, or be held in common.
- A decision-making system: this determines who is eligible to make decisions over economic activities. Economic agents with decision-making powers can enter into binding contracts with one another.
- A coordination mechanism: this determines how information is obtained and used in decision-making. The two dominant forms of coordination are planning and markets; planning can be either decentralized or centralized, and the two coordination mechanisms are not mutually exclusive and often co-exist.
- An incentive system: this induces and motivates economic agents to engage in productive activities. It can be based on either material reward (compensation or self-interest) or moral suasion (for instance, social prestige or through a democratic decision-making process that binds those involved). The incentive system may encourage specialization and the division of labor.
- Organizational form: there are two basic forms of organization: actors and regulators. Economic actors include households, work gangs and production teams, firms, joint-ventures and cartels. Economically regulative organizations are represented by the state and market authorities; the latter may be private or public entities.
- A distribution system: this allocates the proceeds from productive activity, which is distributed as income among the economic organizations, individuals and groups within society, such as property owners, workers and non-workers, or the state (from taxes).
- A public choice mechanism for law-making, establishing rules, norms and standards and levying taxes. Usually, this is the responsibility of the state, but other means of collective decision-making are possible, such as chambers of commerce or workers' councils.
There are several basic questions that must be answered in order for an economy to run satisfactorily. The scarcity problem, for example, requires answers to basic questions, such as what to produce, how to produce it and who gets what is produced. An economic system is a way of answering these basic questions and different economic systems answer them differently. Many different objectives may be seen as desirable for an economy, like efficiency, growth, liberty and equality.
Economic systems are commonly segmented by their property rights regime for the means of production and by their dominant resource allocation mechanism. Economies that combine private ownership with market allocation are called "market capitalism" and economies that combine private ownership with economic planning are labelled "command capitalism" or dirigisme.
Likewise, systems that mix public or cooperative ownership of the means of production with economic planning are called "socialist planned economies" and systems that combine public or cooperative ownership with markets are called "market socialism".
Some perspectives build upon this basic nomenclature to take other variables into account, such as class processes within an economy. This leads some economists to categorize, for example, the Soviet Union's economy as state capitalism based on the analysis that the working class was exploited by the party leadership.
Instead of looking at nominal ownership, this perspective takes into account the organizational form within economic enterprises.
In a capitalist economic system, production is carried out for private profit and decisions regarding investment and allocation of factor inputs are determined by business owners in factor markets. The means of production are primarily owned by private enterprises and decisions regarding production and investment are determined by private owners in capital markets.
Capitalist systems range from laissez-faire, with minimal government regulation and state enterprise, to regulated and social market systems, with the aims of ameliorating market failures (see economic intervention) or supplementing the private marketplace with social policies to promote equal opportunities (see welfare state), respectively.
In socialist economic systems (socialism), production for use is carried out; decisions regarding the use of the means of production are adjusted to satisfy economic demand; and investment is determined through economic planning procedures. There is a wide range of proposed planning procedures and ownership structures for socialist systems, with the common feature among them being the social ownership of the means of production.
This might take the form of public ownership by all of the society, or ownership cooperatively by their employees. A socialist economic system that features social ownership, but that it is based on the process of capital accumulation and utilization of capital markets for the allocation of capital goods between socially owned enterprises falls under the subcategory of market socialism.
By resource allocation mechanism:
The basic and general "modern" economic systems segmented by the criterium of resource allocation mechanism are:
- Market economy ("hands off" systems, such as laissez-faire capitalism)
- Mixed economy (a hybrid that blends some aspects of both market and planned economies)
- Planned economy ("hands on" systems, such as state socialism, also known as "command economy" when referring to the Soviet model)
Other types:
- Traditional economy (a generic term for older economic systems, opposed to modern economic systems)
- Non-monetary economy (without the use of money, opposed to monetary economy )
- Subsistence economy (without surplus, exchange or market trade )
- Gift economy (where an exchange is made without any explicit agreement for immediate or future rewards and profits )
- Barter economy (where goods and services are directly exchanged for other goods or services)
- Participatory economics (a decentralized economic planning system where the production and distribution of goods is guided by public participation )
- Post-scarcity economy (a hypothetical form where resources are not scarce)
By ownership of the means of production:
- Capitalism (private ownership of the means of production )
- Mixed economy
- Socialist economy (social ownership of the means of production)
By political ideologies:
Various strains of anarchism and libertarianism advocate different economic systems, all of which have very small or no government involvement. These include:
By other criteria:
Corporatism refers to economic tripartite involving negotiations between business, labor and state interest groups to establish economic policy, or more generally to assigning people to political groups based on their occupational affiliation.
Certain subsets of an economy, or the particular goods, services, techniques of production, or moral rules can also be described as an "economy". For example, some terms emphasize specific sectors or externalizes:
- Circular economy
- Collectivist economy
- Digital economy
- Green economy
- Information economy
- Internet economy
- Knowledge economy
- Natural economy
- Virtual economy
Others emphasize a particular religion:
- Arthashastra – Hindu economics
- Buddhist economics
- Distributism – Catholic ideal of a "third way" economy, featuring more distributed ownership in a mixed economy
- Islamic economics
The type of labour power:
- Slave – and serf -based economy
- Wage labour -based economy
Or the means of production:
Evolutionary economics:
See also: Evolutionary economics
Karl Marx's theory of economic development was based on the premise of evolving economic systems. Specifically, in his view over the course of history superior economic systems would replace inferior ones. Inferior systems were beset by internal contradictions and inefficiencies that would make it impossible for them to survive long-term.
In Marx's scheme, feudalism was replaced by capitalism, which would eventually be superseded by socialism. Joseph Schumpeter had an evolutionary conception of economic development, but unlike Marx he de-emphasized the role of class struggle in contributing to qualitative change in the economic mode of production.
In subsequent world history, many communist states run according to Marxist–Leninist ideologies arose during the 20th century, but by the 1990s they had either ceased to exist or gradually reformed their centrally planned economies toward market-based economies, for example with perestroika and the dissolution of the Soviet Union, Chinese economic reform and Đổi Mới in Vietnam.
Mainstream evolutionary economics continues to study economic change in modern times. There has also been renewed interest in understanding economic systems as evolutionary systems in the emerging field of complexity economics.
See also:
- Capitalism
- Communism
- Economic ideology
- Economy
- Factors of production
- History of economic thought
- Mode of production
- Participatory economics
- Political economy
- Socialism
- Social relations of production
- Socialist calculation debate
- Superstructure
- Economic system at Encyclopædia Britannica entry.
- "Social Studies VSC Glossary".
- Glossary-Cultural "Anthropology".
- "Economic Systems", a refereed journal for the analysis of market and non-market solution by Elsevier since 2001.
- "Economic Systems" by WebEc, 2007.
Economic Model
- YouTube Video: Introduction to the Solow–Swan model of economic growth
- YouTube Video: The Aggregate Demand Aggregate Supply (AD-AS) Model
- YouTube Video: Ulrik Franke - Curtain talk: The Gordon-Loeb model for optimal investment in information security
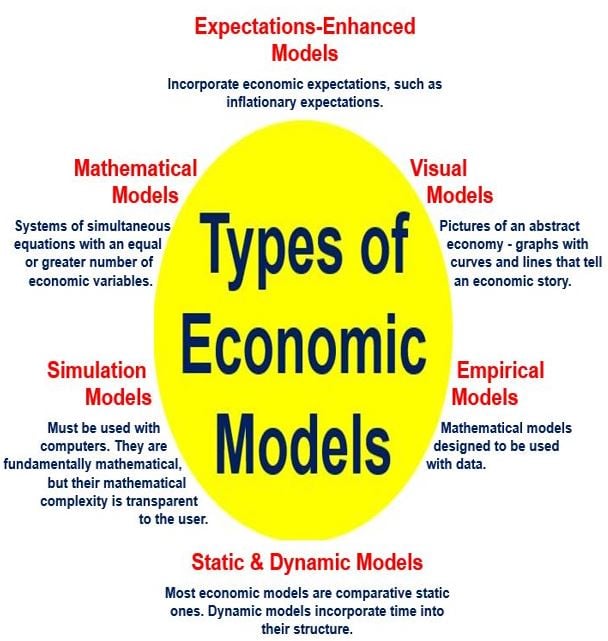
Economic model:
In economics, a model is a theoretical construct representing economic processes by a set of variables and a set of logical and/or quantitative relationships between them. The economic model is a simplified, often mathematical, framework designed to illustrate complex processes.
Frequently, economic models posit structural parameters. A model may have various exogenous variables, and those variables may change to create various responses by economic variables. Methodological uses of models include investigation, theorizing, and fitting theories to the world.
Overview:
In general terms, economic models have two functions: first as a simplification of and abstraction from observed data, and second as a means of selection of data based on a paradigm of econometric study.
Simplification is particularly important for economics given the enormous complexity of economic processes. This complexity can be attributed to the diversity of factors that determine economic activity; these factors include:
Economists therefore must make a reasoned choice of which variables and which relationships between these variables are relevant and which ways of analyzing and presenting this information are useful.
Selection is important because the nature of an economic model will often determine what facts will be looked at and how they will be compiled. For example, inflation is a general economic concept, but to measure inflation requires a model of behavior, so that an economist can differentiate between changes in relative prices and changes in price that are to be attributed to inflation.
In addition to their professional academic interest, uses of models include:
A model establishes an argumentative framework for applying logic and mathematics that can be independently discussed and tested and that can be applied in various instances.
Policies and arguments that rely on economic models have a clear basis for soundness, namely the validity of the supporting model.
Economic models in current use do not pretend to be theories of everything economic; any such pretensions would immediately be thwarted by computational infeasibility and the incompleteness or lack of theories for various types of economic behavior. Therefore, conclusions drawn from models will be approximate representations of economic facts.
However, properly constructed models can remove extraneous information and isolate useful approximations of key relationships. In this way more can be understood about the relationships in question than by trying to understand the entire economic process.
The details of model construction vary with type of model and its application, but a generic process can be identified. Generally, any modelling process has two steps: generating a model, then checking the model for accuracy (sometimes called diagnostics). The diagnostic step is important because a model is only useful to the extent that it accurately mirrors the relationships that it purports to describe.
Creating and diagnosing a model is frequently an iterative process in which the model is modified (and hopefully improved) with each iteration of diagnosis and respecification. Once a satisfactory model is found, it should be double checked by applying it to a different data set.
Types of models:
According to whether all the model variables are deterministic, economic models can be classified as stochastic or non-stochastic models;
At a more practical level, quantitative modelling is applied to many areas of economics and several methodologies have evolved more or less independently of each other. As a result, no overall model taxonomy is naturally available.
We can nonetheless provide a few examples that illustrate some particularly relevant points of model construction.
In economics, a model is a theoretical construct representing economic processes by a set of variables and a set of logical and/or quantitative relationships between them. The economic model is a simplified, often mathematical, framework designed to illustrate complex processes.
Frequently, economic models posit structural parameters. A model may have various exogenous variables, and those variables may change to create various responses by economic variables. Methodological uses of models include investigation, theorizing, and fitting theories to the world.
Overview:
In general terms, economic models have two functions: first as a simplification of and abstraction from observed data, and second as a means of selection of data based on a paradigm of econometric study.
Simplification is particularly important for economics given the enormous complexity of economic processes. This complexity can be attributed to the diversity of factors that determine economic activity; these factors include:
- individual and cooperative decision processes,
- resource limitations,
- environmental and geographical constraints,
- institutional and legal requirements
- and purely random fluctuations.
Economists therefore must make a reasoned choice of which variables and which relationships between these variables are relevant and which ways of analyzing and presenting this information are useful.
Selection is important because the nature of an economic model will often determine what facts will be looked at and how they will be compiled. For example, inflation is a general economic concept, but to measure inflation requires a model of behavior, so that an economist can differentiate between changes in relative prices and changes in price that are to be attributed to inflation.
In addition to their professional academic interest, uses of models include:
- Forecasting economic activity in a way in which conclusions are logically related to assumptions;
- Proposing economic policy to modify future economic activity;
- Presenting reasoned arguments to politically justify economic policy at the national level, to explain and influence company strategy at the level of the firm, or to provide intelligent advice for household economic decisions at the level of households.
- Planning and allocation, in the case of centrally planned economies, and on a smaller scale in logistics and management of businesses.
- In finance, predictive models have been used since the 1980s for trading (investment and speculation). For example, emerging market bonds were often traded based on economic models predicting the growth of the developing nation issuing them. Since the 1990s many long-term risk management models have incorporated economic relationships between simulated variables in an attempt to detect high-exposure future scenarios (often through a Monte Carlo method).
A model establishes an argumentative framework for applying logic and mathematics that can be independently discussed and tested and that can be applied in various instances.
Policies and arguments that rely on economic models have a clear basis for soundness, namely the validity of the supporting model.
Economic models in current use do not pretend to be theories of everything economic; any such pretensions would immediately be thwarted by computational infeasibility and the incompleteness or lack of theories for various types of economic behavior. Therefore, conclusions drawn from models will be approximate representations of economic facts.
However, properly constructed models can remove extraneous information and isolate useful approximations of key relationships. In this way more can be understood about the relationships in question than by trying to understand the entire economic process.
The details of model construction vary with type of model and its application, but a generic process can be identified. Generally, any modelling process has two steps: generating a model, then checking the model for accuracy (sometimes called diagnostics). The diagnostic step is important because a model is only useful to the extent that it accurately mirrors the relationships that it purports to describe.
Creating and diagnosing a model is frequently an iterative process in which the model is modified (and hopefully improved) with each iteration of diagnosis and respecification. Once a satisfactory model is found, it should be double checked by applying it to a different data set.
Types of models:
According to whether all the model variables are deterministic, economic models can be classified as stochastic or non-stochastic models;
- according to whether all the variables are quantitative, economic models are classified as discrete or continuous choice model;
- according to the model's intended purpose/function, it can be classified as quantitative or qualitative;
- according to the model's ambit, it can be classified as a general equilibrium model, a partial equilibrium model, or even a non-equilibrium model; according to the economic agent's characteristics, models can be classified as rational agent models, representative agent models etc.
- Stochastic models are formulated using stochastic processes. They model economically observable values over time. Most of econometrics is based on statistics to formulate and test hypotheses about these processes or estimate parameters for them. A widely used bargaining class of simple econometric models popularized by Tinbergen and later Wold are autoregressive models, in which the stochastic process satisfies some relation between current and past values. Examples of these are autoregressive moving average models and related ones such as autoregressive conditional heteroskedasticity (ARCH) and GARCH models for the modelling of heteroskedasticity.
- Non-stochastic models may be purely qualitative (for example, relating to social choice theory) or quantitative (involving rationalization of financial variables, for example with hyperbolic coordinates, and/or specific forms of functional relationships between variables). In some cases economic predictions in a coincidence of a model merely assert the direction of movement of economic variables, and so the functional relationships are used only stoical in a qualitative sense: for example, if the price of an item increases, then the demand for that item will decrease. For such models, economists often use two-dimensional graphs instead of functions.
- Qualitative models – although almost all economic models involve some form of mathematical or quantitative analysis, qualitative models are occasionally used. One example is qualitative scenario planning in which possible future events are played out. Another example is non-numerical decision tree analysis. Qualitative models often suffer from lack of precision.
At a more practical level, quantitative modelling is applied to many areas of economics and several methodologies have evolved more or less independently of each other. As a result, no overall model taxonomy is naturally available.
We can nonetheless provide a few examples that illustrate some particularly relevant points of model construction.
- An accounting model is one based on the premise that for every credit there is a debit. More symbolically, an accounting model expresses some principle of conservation in the form "algebraic sum of inflows = sinks − sources"
- This principle is certainly true for money and it is the basis for national income accounting. Accounting models are true by convention, that is any experimental failure to confirm them, would be attributed to fraud, arithmetic error or an extraneous injection (or destruction) of cash, which we would interpret as showing the experiment was conducted improperly.
- Optimality and constrained optimization models – Other examples of quantitative models are based on principles such as profit or utility maximization. An example of such a model is given by the comparative statics of taxation on the profit-maximizing firm. The profit of a firm is given by:
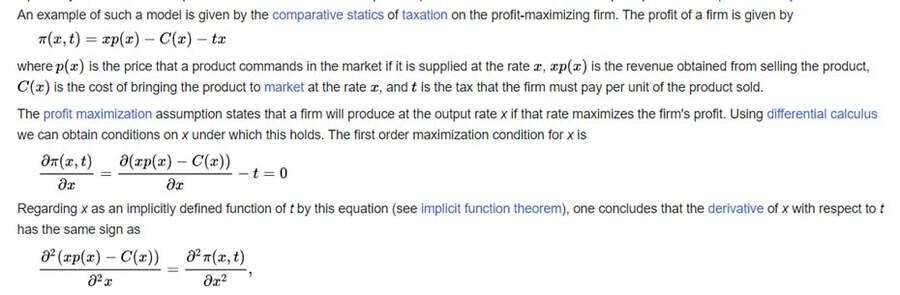
which is negative if the second order conditions for a local maximum are satisfied.
Thus the profit maximization model predicts something about the effect of taxation on output, namely that output decreases with increased taxation. If the predictions of the model fail, we conclude that the profit maximization hypothesis was false; this should lead to alternate theories of the firm, for example based on bounded rationality.
Borrowing a notion apparently first used in economics by Paul Samuelson, this model of taxation and the predicted dependency of output on the tax rate, illustrates an operationally meaningful theorem; that is one requiring some economically meaningful assumption that is falsifiable under certain conditions.
Problems with economic models:
Most economic models rest on a number of assumptions that are not entirely realistic. For example, agents are often assumed to have perfect information, and markets are often assumed to clear without friction. Or, the model may omit issues that are important to the question being considered, such as externalities.
Any analysis of the results of an economic model must therefore consider the extent to which these results may be compromised by inaccuracies in these assumptions, and a large literature has grown up discussing problems with economic models, or at least asserting that their results are unreliable.
History:
One of the major problems addressed by economic models has been understanding economic growth. An early attempt to provide a technique to approach this came from the French physiocratic school in the Eighteenth century. Among these economists, François Quesnay was known particularly for his development and use of tables he called Tableaux économiques.
These tables have in fact been interpreted in more modern terminology as a Leontiev model, see the Phillips reference below.
All through the 18th century (that is, well before the founding of modern political economy, conventionally marked by Adam Smith's 1776 Wealth of Nations), simple probabilistic models were used to understand the economics of insurance. This was a natural extrapolation of the theory of gambling, and played an important role both in the development of probability theory itself and in the development of actuarial science.
Many of the giants of 18th century mathematics contributed to this field. Around 1730, De Moivre addressed some of these problems in the 3rd edition of The Doctrine of Chances.
Even earlier (1709), Nicolas Bernoulli studies problems related to savings and interest in the Ars Conjectandi. In 1730, Daniel Bernoulli studied "moral probability" in his book Mensura Sortis, where he introduced what would today be called "logarithmic utility of money" and applied it to gambling and insurance problems, including a solution of the paradoxical Saint Petersburg problem. All of these developments were summarized by Laplace in his Analytical Theory of Probabilities (1812).
Clearly, by the time David Ricardo came along he had a lot of well-established math to draw from.
Tests of macroeconomic predictions:
In the late 1980s, the Brookings Institution compared 12 leading macroeconomic models available at the time. They compared the models' predictions for how the economy would respond to specific economic shocks (allowing the models to control for all the variability in the real world; this was a test of model vs. model, not a test against the actual outcome).
Although the models simplified the world and started from a stable, known common parameters the various models gave significantly different answers. For instance, in calculating the impact of a monetary loosening on output some models estimated a 3% change in GDP after one year, and one gave almost no change, with the rest spread between.
Partly as a result of such experiments, modern central bankers no longer have as much confidence that it is possible to 'fine-tune' the economy as they had in the 1960s and early 1970s.
Modern policy makers tend to use a less activist approach, explicitly because they lack confidence that their models will actually predict where the economy is going, or the effect of any shock upon it.
The new, more humble, approach sees danger in dramatic policy changes based on model predictions, because of several practical and theoretical limitations in current macroeconomic models; in addition to the theoretical pitfalls, (listed above) some problems specific to aggregate modelling are:
Comparison with models in other sciences:
Complex systems specialist and mathematician David Orrell wrote on this issue in his book Apollo's Arrow and explained that the weather, human health and economics use similar methods of prediction (mathematical models). Their systems—the atmosphere, the human body and the economy—also have similar levels of complexity.
He found that forecasts fail because the models suffer from two problems: (i) they cannot capture the full detail of the underlying system, so rely on approximate equations; (ii) they are sensitive to small changes in the exact form of these equations. This is because complex systems like the economy or the climate consist of a delicate balance of opposing forces, so a slight imbalance in their representation has big effects.
Thus, predictions of things like economic recessions are still highly inaccurate, despite the use of enormous models running on fast computers. See Unreasonable ineffectiveness of mathematics § Economics and finance.
Effects of deterministic chaos on economic models:
Economic and meteorological simulations may share a fundamental limit to their predictive powers: chaos. Although the modern mathematical work on chaotic systems began in the 1970s the danger of chaos had been identified and defined in Econometrica as early as 1958:
"Good theorising consists to a large extent in avoiding assumptions ... [with the property that] a small change in what is posited will seriously affect the conclusions."
(William Baumol, Econometrica, 26 see: Economics on the Edge of Chaos).
It is straightforward to design economic models susceptible to butterfly effects of initial-condition sensitivity.
However, the econometric research program to identify which variables are chaotic (if any) has largely concluded that aggregate macroeconomic variables probably do not behave chaotically. This would mean that refinements to the models could ultimately produce reliable long-term forecasts. However, the validity of this conclusion has generated two challenges:
More recently, chaos (or the butterfly effect) has been identified as less significant than previously thought to explain prediction errors. Rather, the predictive power of economics and meteorology would mostly be limited by the models themselves and the nature of their underlying systems (see Comparison with models in other sciences above).
Critique of hubris in planning:
A key strand of free market economic thinking is that the market's invisible hand guides an economy to prosperity more efficiently than central planning using an economic model. One reason, emphasized by Friedrich Hayek, is the claim that many of the true forces shaping the economy can never be captured in a single plan.
This is an argument that cannot be made through a conventional (mathematical) economic model because it says that there are critical systemic-elements that will always be omitted from any top-down analysis of the economy.
Examples of economic models:
See also:
Thus the profit maximization model predicts something about the effect of taxation on output, namely that output decreases with increased taxation. If the predictions of the model fail, we conclude that the profit maximization hypothesis was false; this should lead to alternate theories of the firm, for example based on bounded rationality.
Borrowing a notion apparently first used in economics by Paul Samuelson, this model of taxation and the predicted dependency of output on the tax rate, illustrates an operationally meaningful theorem; that is one requiring some economically meaningful assumption that is falsifiable under certain conditions.
- Aggregate models. Macroeconomics needs to deal with aggregate quantities such as output, the price level, the interest rate and so on. Now real output is actually a vector of goods and services, such as:
- cars,
- passenger airplanes,
- computers,
- food items,
- secretarial services,
- home repair services etc.
- Similarly. price is the vector of individual prices of goods and services. Models in which the vector nature of the quantities is maintained are used in practice, for example Leontief input–output models are of this kind. However, for the most part, these models are computationally much harder to deal with and harder to use as tools for qualitative analysis. For this reason, macroeconomic models usually lump together different variables into a single quantity such as output or price. Moreover, quantitative relationships between these aggregate variables are often parts of important macroeconomic theories. This process of aggregation and functional dependency between various aggregates usually is interpreted statistically and validated by econometrics. For instance, one ingredient of the Keynesian model is a functional relationship between consumption and national income: C = C(Y). This relationship plays an important role in Keynesian analysis.
Problems with economic models:
Most economic models rest on a number of assumptions that are not entirely realistic. For example, agents are often assumed to have perfect information, and markets are often assumed to clear without friction. Or, the model may omit issues that are important to the question being considered, such as externalities.
Any analysis of the results of an economic model must therefore consider the extent to which these results may be compromised by inaccuracies in these assumptions, and a large literature has grown up discussing problems with economic models, or at least asserting that their results are unreliable.
History:
One of the major problems addressed by economic models has been understanding economic growth. An early attempt to provide a technique to approach this came from the French physiocratic school in the Eighteenth century. Among these economists, François Quesnay was known particularly for his development and use of tables he called Tableaux économiques.
These tables have in fact been interpreted in more modern terminology as a Leontiev model, see the Phillips reference below.
All through the 18th century (that is, well before the founding of modern political economy, conventionally marked by Adam Smith's 1776 Wealth of Nations), simple probabilistic models were used to understand the economics of insurance. This was a natural extrapolation of the theory of gambling, and played an important role both in the development of probability theory itself and in the development of actuarial science.
Many of the giants of 18th century mathematics contributed to this field. Around 1730, De Moivre addressed some of these problems in the 3rd edition of The Doctrine of Chances.
Even earlier (1709), Nicolas Bernoulli studies problems related to savings and interest in the Ars Conjectandi. In 1730, Daniel Bernoulli studied "moral probability" in his book Mensura Sortis, where he introduced what would today be called "logarithmic utility of money" and applied it to gambling and insurance problems, including a solution of the paradoxical Saint Petersburg problem. All of these developments were summarized by Laplace in his Analytical Theory of Probabilities (1812).
Clearly, by the time David Ricardo came along he had a lot of well-established math to draw from.
Tests of macroeconomic predictions:
In the late 1980s, the Brookings Institution compared 12 leading macroeconomic models available at the time. They compared the models' predictions for how the economy would respond to specific economic shocks (allowing the models to control for all the variability in the real world; this was a test of model vs. model, not a test against the actual outcome).
Although the models simplified the world and started from a stable, known common parameters the various models gave significantly different answers. For instance, in calculating the impact of a monetary loosening on output some models estimated a 3% change in GDP after one year, and one gave almost no change, with the rest spread between.
Partly as a result of such experiments, modern central bankers no longer have as much confidence that it is possible to 'fine-tune' the economy as they had in the 1960s and early 1970s.
Modern policy makers tend to use a less activist approach, explicitly because they lack confidence that their models will actually predict where the economy is going, or the effect of any shock upon it.
The new, more humble, approach sees danger in dramatic policy changes based on model predictions, because of several practical and theoretical limitations in current macroeconomic models; in addition to the theoretical pitfalls, (listed above) some problems specific to aggregate modelling are:
- Limitations in model construction caused by difficulties in understanding the underlying mechanisms of the real economy. (Hence the profusion of separate models.)
- The law of unintended consequences, on elements of the real economy not yet included in the model.
- The time lag in both receiving data and the reaction of economic variables to policy makers attempts to 'steer' them (mostly through monetary policy) in the direction that central bankers want them to move. Milton Friedman has vigorously argued that these lags are so long and unpredictably variable that effective management of the macroeconomy is impossible.
- The difficulty in correctly specifying all of the parameters (through econometric measurements) even if the structural model and data were perfect.
- The fact that all the model's relationships and coefficients are stochastic, so that the error term becomes very large quickly, and the available snapshot of the input parameters is already out of date.
- Modern economic models incorporate the reaction of the public and market to the policy maker's actions (through game theory), and this feedback is included in modern models (following the rational expectations revolution and Robert Lucas, Jr.'s Lucas critique of non-microfounded models). If the response to the decision maker's actions (and their credibility) must be included in the model then it becomes much harder to influence some of the variables simulated.
Comparison with models in other sciences:
Complex systems specialist and mathematician David Orrell wrote on this issue in his book Apollo's Arrow and explained that the weather, human health and economics use similar methods of prediction (mathematical models). Their systems—the atmosphere, the human body and the economy—also have similar levels of complexity.
He found that forecasts fail because the models suffer from two problems: (i) they cannot capture the full detail of the underlying system, so rely on approximate equations; (ii) they are sensitive to small changes in the exact form of these equations. This is because complex systems like the economy or the climate consist of a delicate balance of opposing forces, so a slight imbalance in their representation has big effects.
Thus, predictions of things like economic recessions are still highly inaccurate, despite the use of enormous models running on fast computers. See Unreasonable ineffectiveness of mathematics § Economics and finance.
Effects of deterministic chaos on economic models:
Economic and meteorological simulations may share a fundamental limit to their predictive powers: chaos. Although the modern mathematical work on chaotic systems began in the 1970s the danger of chaos had been identified and defined in Econometrica as early as 1958:
"Good theorising consists to a large extent in avoiding assumptions ... [with the property that] a small change in what is posited will seriously affect the conclusions."
(William Baumol, Econometrica, 26 see: Economics on the Edge of Chaos).
It is straightforward to design economic models susceptible to butterfly effects of initial-condition sensitivity.
However, the econometric research program to identify which variables are chaotic (if any) has largely concluded that aggregate macroeconomic variables probably do not behave chaotically. This would mean that refinements to the models could ultimately produce reliable long-term forecasts. However, the validity of this conclusion has generated two challenges:
- In 2004 Philip Mirowski challenged this view and those who hold it, saying that chaos in economics is suffering from a biased "crusade" against it by neo-classical economics in order to preserve their mathematical models.
- The variables in finance may well be subject to chaos. Also in 2004, the University of Canterbury study Economics on the Edge of Chaos concludes that after noise is removed from S&P 500 returns, evidence of deterministic chaos is found.
More recently, chaos (or the butterfly effect) has been identified as less significant than previously thought to explain prediction errors. Rather, the predictive power of economics and meteorology would mostly be limited by the models themselves and the nature of their underlying systems (see Comparison with models in other sciences above).
Critique of hubris in planning:
A key strand of free market economic thinking is that the market's invisible hand guides an economy to prosperity more efficiently than central planning using an economic model. One reason, emphasized by Friedrich Hayek, is the claim that many of the true forces shaping the economy can never be captured in a single plan.
This is an argument that cannot be made through a conventional (mathematical) economic model because it says that there are critical systemic-elements that will always be omitted from any top-down analysis of the economy.
Examples of economic models:
- Cobb–Douglas model of production
- Solow–Swan model of economic growth
- Lucas islands model of money supply
- Heckscher–Ohlin model of international trade
- Black–Scholes model of option pricing
- AD–AS model a macroeconomic model of aggregate demand– and supply
- IS–LM model the relationship between interest rates and assets markets
- Ramsey–Cass–Koopmans model of economic growth
- Gordon–Loeb model for cyber security investments
See also:
- Economic methodology
- Computational economics
- Agent-based computational economics
- Endogeneity
- Financial model
- R. Frigg and S. Hartmann, Models in Science. Entry in the Stanford Encyclopedia of Philosophy.
- H. Varian How to build a model in your spare time The author makes several unexpected suggestions: Look for a model in the real world, not in journals. Look at the literature later, not sooner.
- Elmer G. Wiens: Classical & Keynesian AD-AS Model – An on-line, interactive model of the Canadian Economy.
- IFs Economic Sub-Model: Online Global Model
- Economic attractor
Office of Management and Budget (OMB)
- YouTube Video: Grassley Questions Office of Management and Budget (OMB) Director Shalanda Young on POTUS's Budget
- YouTube Video: How Will the Office of Management and Budget Shape Policy in the Biden White House?
- YouTube Video: Finance Foundations Division of Budgets (Office of Management & Budget) - Where the Money Comes From
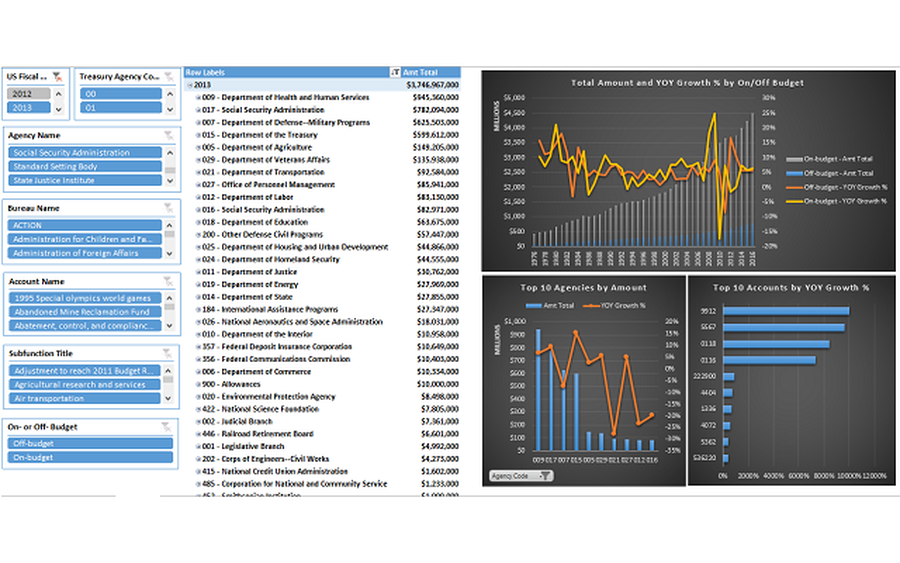
The Office of Management and Budget (OMB) is the largest office within the Executive Office of the President of the United States (EOP). OMB's most prominent function is to produce the president's budget, but it also examines agency programs, policies, and procedures to see whether they comply with the president's policies and coordinates inter-agency policy initiatives.
Shalanda Young became OMB's acting director in March 2021, and was confirmed by the Senate in March 2022.
History:
The Bureau of the Budget, OMB's predecessor, was established in 1921 as a part of the Department of the Treasury by the Budget and Accounting Act of 1921, which President Warren G. Harding signed into law.
The Bureau of the Budget was moved to the Executive Office of the President in 1939 and was run by Harold D. Smith during the government's rapid expansion of spending during World War II. James L. Sundquist, a staffer at the Bureau of the Budget, called the relationship between the president and the bureau extremely close and subsequent bureau directors politicians, not public administrators.
The bureau was reorganized into the Office of Management and Budget in 1970 during the Nixon administration. The first OMB included Roy Ash (head), Paul O'Neill (assistant director), Fred Malek (deputy director), Frank Zarb (associate director) and two dozen others.
In the 1990s, OMB was reorganized to remove the distinction between management staff and budgetary staff by combining the dual roles into each given program examiner within the Resource Management Offices.
Purpose:
OMB prepares the president's budget proposal to Congress and supervises the administration of the executive branch agencies. It evaluates the effectiveness of agency programs, policies, and procedures, assesses competing funding demands among agencies, and sets funding priorities. OMB ensures that agency reports, rules, testimony, and proposed legislation are consistent with the president's budget and administration policies.
OMB also oversees and coordinates the administration's procurement, financial management, information, and regulatory policies. In each of these areas, OMB's role is to help improve administrative management, develop better performance measures and coordinating mechanisms, and reduce unnecessary burdens on the public.
OMB's critical missions are:
Structure:
Overview:
OMB is made up mainly of career appointed staff who provide continuity across changes of party and administration in the White House. Six positions within OMB – the Director, the Deputy Director, the Deputy Director for Management, and the administrators of the Office of Information and Regulatory Affairs, the Office of Federal Procurement Policy, and the Office of Federal Financial Management – are presidentially appointed and Senate-confirmed positions.
OMB's largest components are the five Resource Management Offices, which are organized along functional lines mirroring the federal government, each led by an OMB associate director. Approximately half of all OMB staff are assigned to these offices, the majority of whom are designated as program examiners.
Program examiners can be assigned to monitor one or more federal agencies or may be deployed by a topical area, such as monitoring issues relating to U.S. Navy warships. These staff have dual responsibility for both management and budgetary issues, as well as for giving expert advice on all aspects relating to their programs. Each year they review federal agency budget requests and help decide what resource requests will be sent to Congress as part of the president's budget.
They perform in-depth program evaluations with the Program Assessment Rating Tool, review proposed regulations and agency testimony, analyze pending legislation, and oversee the aspects of the president's management agenda including agency management scorecards.
They are often called upon to provide analysis information to EOP staff. They also provide important information to those assigned to the statutory offices within OMB: the Office of Information and Regulatory Affairs, the Office of Federal Procurement Policy, the Office of Federal Financial Management, and the Office of E-Government & Information Technology, which specializes in issues such as federal regulations and procurement policy and law.
Other components are OMB-wide support offices, including the Office of General Counsel, the Office of Legislative Affairs, the Budget Review Division (BRD), and the Legislative Reference Division. The BRD performs government-wide budget coordination and is largely responsible for the technical aspects relating to the release of the president's budget each February.
With respect to the estimation of spending for the executive branch, the BRD serves a purpose parallel to that of the Congressional Budget Office (which was created in response to the OMB) for estimating Congressional spending, the Department of the Treasury for estimating executive branch revenue, and the Joint Committee on Taxation for estimating Congressional revenue.
The Legislative Reference Division is the federal government's central clearing house for proposed legislation or testimony by federal officials. It distributes proposed legislation and testimony to all relevant federal reviewers and distills the comments into a consensus opinion of the administration about the proposal. It is also responsible for writing an Enrolled Bill Memorandum to the president once a bill is presented by both chambers of Congress for the president's signature.
The Enrolled Bill Memorandum details the bill's particulars, opinions on the bill from relevant federal departments, and an overall opinion about whether it should be signed into law or vetoed. It also issues Statements of Administration Policy that let Congress know the White House's official position on proposed legislation.
Role in the executive budget process:
In practice, the president has assigned the OMB certain responsibilities when it comes to the budget and hiring authorities who play key roles in developing it. OMB coordinates the development of the president's budget proposal by issuing circulars, memoranda, and guidance documents to the heads of executive agencies.
The OMB works very closely with executive agencies in making sure the budget process and proposal is smooth.
The development of the budget within the executive branch has many steps and takes nearly a year to complete. The first step is the OMB informing the president of the country's economic situation.
The next step is known as the Spring Guidance: the OMB gives executive agencies instructions on policy guidance to use when coming up with their budget requests along with due dates for them to submit their requests.
The OMB then works with the agencies to discuss issues in the upcoming budget. In July, the OMB issues circular A-11 to all agencies, which outlines instructions for submitting the budget proposals, which the agencies submit by September.
The fiscal year begins October 1 and OMB staff meet with senior agency representatives to find out whether their proposals are in line with the president's priorities and policies and identify constraints within the budget proposal until late November. The OMB director then meets with the president and EOP advisors to discuss the agencies' budget proposals and recommends a federal budget proposal, and the agencies are notified of the decisions about their requests.
They can appeal to OMB and the president in December if they are dissatisfied with the decisions. After working together to resolve issues, agencies and OMB prepare a budget justification document to present to relevant congressional committees, especially the Appropriations Committee. Finally, by the first Monday in February, the president must review and submit the final budget to Congress to approve.
OMB is also responsible for the preparation of Statements of Administrative Policy (SAPs) with the president. These statements allow the OMB to communicate the president's and agencies' policies to the government as a whole and set forth policymakers' agendas. During the review of the federal budget, interest groups can lobby for policy change and affect the budget for the new year.
OMB plays a key role in policy conflicts by making sure legislation and agencies' actions are consistent with the executive branch's. OMB has a powerful and influential role in the government, basically making sure its day-to-day operations run. Without a budget, federal employees could not be paid, federal buildings could not open and federal programs would come to a halt in a government shutdown.
Shutdowns can occur when Congress refuses to accept a budget.
Suspension and debarment:
The Interagency Suspension and Debarment Committee (ISDC) was created as an OMB committee by President Ronald Reagan's Executive Order 12549 in 1986, for the purpose of monitoring the implementation of the order. This order mandates executive departments and agencies to:
Circulars:
Main article: List of OMB Circulars and Bulletins
Circulars are instructions or information the OMB issues to federal agencies that are indexed by major category:
Circular NO. A-119 Circular A-119 is for federal participation in the development and use of voluntary consensus standards and in conformity assessment activities. A-119 instructs its agencies to adopt voluntary consensus standards before relying upon industry standards and reducing to a minimum the reliance by agencies on government standards.
Adoption of international standards is widely followed by U.S. agencies. This includes:
Organization:
Current appointees:
Click on any of the following blue hyperlinks for more about The Office of Management and Budget:
Shalanda Young became OMB's acting director in March 2021, and was confirmed by the Senate in March 2022.
History:
The Bureau of the Budget, OMB's predecessor, was established in 1921 as a part of the Department of the Treasury by the Budget and Accounting Act of 1921, which President Warren G. Harding signed into law.
The Bureau of the Budget was moved to the Executive Office of the President in 1939 and was run by Harold D. Smith during the government's rapid expansion of spending during World War II. James L. Sundquist, a staffer at the Bureau of the Budget, called the relationship between the president and the bureau extremely close and subsequent bureau directors politicians, not public administrators.
The bureau was reorganized into the Office of Management and Budget in 1970 during the Nixon administration. The first OMB included Roy Ash (head), Paul O'Neill (assistant director), Fred Malek (deputy director), Frank Zarb (associate director) and two dozen others.
In the 1990s, OMB was reorganized to remove the distinction between management staff and budgetary staff by combining the dual roles into each given program examiner within the Resource Management Offices.
Purpose:
OMB prepares the president's budget proposal to Congress and supervises the administration of the executive branch agencies. It evaluates the effectiveness of agency programs, policies, and procedures, assesses competing funding demands among agencies, and sets funding priorities. OMB ensures that agency reports, rules, testimony, and proposed legislation are consistent with the president's budget and administration policies.
OMB also oversees and coordinates the administration's procurement, financial management, information, and regulatory policies. In each of these areas, OMB's role is to help improve administrative management, develop better performance measures and coordinating mechanisms, and reduce unnecessary burdens on the public.
OMB's critical missions are:
- Budget development and execution, a prominent government-wide process managed from the Executive Office of the President (EOP) and a device by which a president implements their policies, priorities, and actions in everything from the Department of Defense to NASA.
- Managing other agencies' financials, paperwork, and IT.
Structure:
Overview:
OMB is made up mainly of career appointed staff who provide continuity across changes of party and administration in the White House. Six positions within OMB – the Director, the Deputy Director, the Deputy Director for Management, and the administrators of the Office of Information and Regulatory Affairs, the Office of Federal Procurement Policy, and the Office of Federal Financial Management – are presidentially appointed and Senate-confirmed positions.
OMB's largest components are the five Resource Management Offices, which are organized along functional lines mirroring the federal government, each led by an OMB associate director. Approximately half of all OMB staff are assigned to these offices, the majority of whom are designated as program examiners.
Program examiners can be assigned to monitor one or more federal agencies or may be deployed by a topical area, such as monitoring issues relating to U.S. Navy warships. These staff have dual responsibility for both management and budgetary issues, as well as for giving expert advice on all aspects relating to their programs. Each year they review federal agency budget requests and help decide what resource requests will be sent to Congress as part of the president's budget.
They perform in-depth program evaluations with the Program Assessment Rating Tool, review proposed regulations and agency testimony, analyze pending legislation, and oversee the aspects of the president's management agenda including agency management scorecards.
They are often called upon to provide analysis information to EOP staff. They also provide important information to those assigned to the statutory offices within OMB: the Office of Information and Regulatory Affairs, the Office of Federal Procurement Policy, the Office of Federal Financial Management, and the Office of E-Government & Information Technology, which specializes in issues such as federal regulations and procurement policy and law.
Other components are OMB-wide support offices, including the Office of General Counsel, the Office of Legislative Affairs, the Budget Review Division (BRD), and the Legislative Reference Division. The BRD performs government-wide budget coordination and is largely responsible for the technical aspects relating to the release of the president's budget each February.
With respect to the estimation of spending for the executive branch, the BRD serves a purpose parallel to that of the Congressional Budget Office (which was created in response to the OMB) for estimating Congressional spending, the Department of the Treasury for estimating executive branch revenue, and the Joint Committee on Taxation for estimating Congressional revenue.
The Legislative Reference Division is the federal government's central clearing house for proposed legislation or testimony by federal officials. It distributes proposed legislation and testimony to all relevant federal reviewers and distills the comments into a consensus opinion of the administration about the proposal. It is also responsible for writing an Enrolled Bill Memorandum to the president once a bill is presented by both chambers of Congress for the president's signature.
The Enrolled Bill Memorandum details the bill's particulars, opinions on the bill from relevant federal departments, and an overall opinion about whether it should be signed into law or vetoed. It also issues Statements of Administration Policy that let Congress know the White House's official position on proposed legislation.
Role in the executive budget process:
In practice, the president has assigned the OMB certain responsibilities when it comes to the budget and hiring authorities who play key roles in developing it. OMB coordinates the development of the president's budget proposal by issuing circulars, memoranda, and guidance documents to the heads of executive agencies.
The OMB works very closely with executive agencies in making sure the budget process and proposal is smooth.
The development of the budget within the executive branch has many steps and takes nearly a year to complete. The first step is the OMB informing the president of the country's economic situation.
The next step is known as the Spring Guidance: the OMB gives executive agencies instructions on policy guidance to use when coming up with their budget requests along with due dates for them to submit their requests.
The OMB then works with the agencies to discuss issues in the upcoming budget. In July, the OMB issues circular A-11 to all agencies, which outlines instructions for submitting the budget proposals, which the agencies submit by September.
The fiscal year begins October 1 and OMB staff meet with senior agency representatives to find out whether their proposals are in line with the president's priorities and policies and identify constraints within the budget proposal until late November. The OMB director then meets with the president and EOP advisors to discuss the agencies' budget proposals and recommends a federal budget proposal, and the agencies are notified of the decisions about their requests.
They can appeal to OMB and the president in December if they are dissatisfied with the decisions. After working together to resolve issues, agencies and OMB prepare a budget justification document to present to relevant congressional committees, especially the Appropriations Committee. Finally, by the first Monday in February, the president must review and submit the final budget to Congress to approve.
OMB is also responsible for the preparation of Statements of Administrative Policy (SAPs) with the president. These statements allow the OMB to communicate the president's and agencies' policies to the government as a whole and set forth policymakers' agendas. During the review of the federal budget, interest groups can lobby for policy change and affect the budget for the new year.
OMB plays a key role in policy conflicts by making sure legislation and agencies' actions are consistent with the executive branch's. OMB has a powerful and influential role in the government, basically making sure its day-to-day operations run. Without a budget, federal employees could not be paid, federal buildings could not open and federal programs would come to a halt in a government shutdown.
Shutdowns can occur when Congress refuses to accept a budget.
Suspension and debarment:
The Interagency Suspension and Debarment Committee (ISDC) was created as an OMB committee by President Ronald Reagan's Executive Order 12549 in 1986, for the purpose of monitoring the implementation of the order. This order mandates executive departments and agencies to:
- participate in a government-wide suspension and debarment system,
- issue regulations with government-wide criteria and minimum due process procedures when debarring or suspending participants, and
- send debarred and suspended participants' identifying information to the General Services Administration for inclusion on a list of excluded persons, now known as the System for Award Management (SAM).
Circulars:
Main article: List of OMB Circulars and Bulletins
Circulars are instructions or information the OMB issues to federal agencies that are indexed by major category:
- Budget,
- State and Local Governments,
- Educational and Non-Profit Institutions,
- Federal Procurement,
- Federal Financial Management,
- Federal Information Resources / Data Collection and Other Special Purpose.
Circular NO. A-119 Circular A-119 is for federal participation in the development and use of voluntary consensus standards and in conformity assessment activities. A-119 instructs its agencies to adopt voluntary consensus standards before relying upon industry standards and reducing to a minimum the reliance by agencies on government standards.
Adoption of international standards is widely followed by U.S. agencies. This includes:
- Environmental Protection Agency referencing ISO 14001 supporting public policy in environmental management.
- Department of Energy referencing ISO 50001 supporting public policy for energy performance aligned with the International Energy Agency
- Department of Labor referencing ISO 45001 supporting public policy in occupational health and safety
- Food and Drug Administration referencing ISO 13485 supporting public policy in medical devices
- Food and Drug Administration referencing ISO 22000 supporting public policy in food products
Organization:
- Director of the Office of Management and Budget
- Deputy Director, OMB
- Executive Associate Director of OMB
- Office of General Counsel
- Office of Legislative Affairs
- Office of Communications
- Office of Economic Policy (EP)
- Management and Operations Division
- Legislative Reference Division
- Budget Review Division (BRD)
- Resource Management Offices
- Natural Resource Programs
- Education, Income Maintenance, and Labor Programs
- Health Programs
- General Government Programs
- National Security Programs
- Deputy Director for Management (Chief Performance Officer of the United States)
- Office of Performance and Personnel Management (OPPM)
- Office of Federal Financial Management (OFFM)
- Office of Federal Procurement Policy (OFPP)
- Office of E-Government & Information Technology (administrator: Federal Chief Information Officer of the United States)
- Cyber and National Security Unit
- United States Digital Service (USDS)
- Office of Information and Regulatory Affairs (OIRA)
- Office of the Intellectual Property Enforcement Coordinator (IPEC)
Current appointees:
- Director: Shalanda Young
- Deputy Director: Nani Coloretti
- Chief of Staff for OMB: Rachel Wallace
- General Counsel: Daniel Jacobson
- Deputy Director for Management (Chief Performance Officer of the United States): Jason Miller
- Controller of the Office of Federal Financial Management: John C. Pasquantino (Acting)
- Administrator of the Office of Federal Procurement Policy: Lesley A. Field (Acting)
- Administrator of the Office of E-Government & Information Technology (Federal Chief Information Officer of the United States): Clare Martorana
- Made in America Director: Livia Shmavonian
- Administrator of the Office of Information and Regulatory Affairs: Richard L. ("Ricky") Revesz
- Deputy Director: Nani Coloretti
Click on any of the following blue hyperlinks for more about The Office of Management and Budget:
- List of directors
- See also:
- Official website
- Office of Management and Budget in the Federal Register
- Budget of the United States government and supplements, 1923–present
- Death and Taxes: 2009 A visual guide and infographic of the 2009 United States federal discretionary budget request as prepared by OMB
- "The Decision Makers: Office of Management and Budget" GovExec.com, August 22, 2005
- List of federal agencies in the United States
- Learning agenda
- United States Census Bureau
- Title 2 of the Code of Federal Regulations
- Title 5 of the Code of Federal Regulations
- United States federal budget
- Office of Federal Financial Management
- Office of Federal Procurement Policy
- Government procurement in the United States
- Office of E-Government & Information Technology
- Office of Information and Regulatory Affairs
- Data.gov
- USAFacts
United States Secretary of the Treasury, currently held by Janet Yellen, the 78th United States Secretary of the Treasury
- YouTube Video: Secretary of Treasury Nominee Janet Yellen Opening Statement
- YouTube Video: WATCH: Janet Yellen's Senate confirmation hearing for Secretary of the Treasury
- YouTube Video: Treasury Secretary Janet Yellen Says US Could Hit Debt Ceiling
United States Secretary of the Treasury
The United States secretary of the treasury is the head of the United States Department of the Treasury, and is the chief financial officer of the federal government of the United States.
The secretary of the treasury serves as the principal advisor to the president of the United States on all matters pertaining to economic and fiscal policy.
The secretary is, by custom, a member of the president's cabinet and, by law, a member of the National Security Council.
Under the Appointments Clause of the United States Constitution, the officeholder is nominated by the president of the United States, and, following a confirmation hearing before the Senate Committee on Finance, is confirmed by the United States Senate.
The secretary of state, the secretary of the treasury, the secretary of defense, and the attorney general are generally regarded as the four most important Cabinet officials, due to the size and importance of their respective departments.
The current secretary of the treasury is Janet Yellen (see below), who is the first woman to hold the office.
Powers and functions:
The Secretary is responsible for formulating and recommending domestic and international financial, economic, and tax policy, participating in the formulation of broad fiscal policies that have general significance for the economy, and managing the public debt.
The Secretary oversees the activities of the Department in carrying out its major law enforcement responsibilities; in serving as the financial agent for the United States Government; and in manufacturing coins and currency.
As the Chief Financial Officer of the government, the Secretary serves as:
The secretary along with the treasurer of the United States must sign Federal Reserve notes before they can become legal tender. The secretary also manages the United States Emergency Economic Stabilization fund.
Salary:
The secretary of the treasury is a Level I position in the Executive Schedule, thus earning the salary prescribed for that level (US$221,400, as of January 2021).
Presidential succession:
The secretary of the treasury is fifth in the presidential line of succession, following the secretary of state and preceding the secretary of defense.
Succession within the Department:
On August 16, 2016, President Barack Obama signed Executive Order 13735, which changed the order of succession for filling the Treasury Secretary's role when necessary. At any time when the secretary and the deputy secretary of the treasury have both died, resigned, or cannot serve as secretary for other reasons, the order designates which Treasury officers are next in line to serve as acting secretary.
The order of succession is as follows: to link to any hyperlink of interest, click on this image below to access the actual lst:
The United States secretary of the treasury is the head of the United States Department of the Treasury, and is the chief financial officer of the federal government of the United States.
The secretary of the treasury serves as the principal advisor to the president of the United States on all matters pertaining to economic and fiscal policy.
The secretary is, by custom, a member of the president's cabinet and, by law, a member of the National Security Council.
Under the Appointments Clause of the United States Constitution, the officeholder is nominated by the president of the United States, and, following a confirmation hearing before the Senate Committee on Finance, is confirmed by the United States Senate.
The secretary of state, the secretary of the treasury, the secretary of defense, and the attorney general are generally regarded as the four most important Cabinet officials, due to the size and importance of their respective departments.
The current secretary of the treasury is Janet Yellen (see below), who is the first woman to hold the office.
Powers and functions:
The Secretary is responsible for formulating and recommending domestic and international financial, economic, and tax policy, participating in the formulation of broad fiscal policies that have general significance for the economy, and managing the public debt.
The Secretary oversees the activities of the Department in carrying out its major law enforcement responsibilities; in serving as the financial agent for the United States Government; and in manufacturing coins and currency.
As the Chief Financial Officer of the government, the Secretary serves as:
- Chairman Pro Tempore of the President's Economic Policy Council,
- Chairman of the Boards and Managing Trustee of the Social Security and Medicare Trust Funds,
- and as:
- U.S. Governor of the International Monetary Fund,
- the International Bank for Reconstruction and Development,
- the Inter-American Development Bank,
- the Asian Development Bank,
- and the European Bank for Reconstruction and Development.
The secretary along with the treasurer of the United States must sign Federal Reserve notes before they can become legal tender. The secretary also manages the United States Emergency Economic Stabilization fund.
Salary:
The secretary of the treasury is a Level I position in the Executive Schedule, thus earning the salary prescribed for that level (US$221,400, as of January 2021).
Presidential succession:
The secretary of the treasury is fifth in the presidential line of succession, following the secretary of state and preceding the secretary of defense.
Succession within the Department:
On August 16, 2016, President Barack Obama signed Executive Order 13735, which changed the order of succession for filling the Treasury Secretary's role when necessary. At any time when the secretary and the deputy secretary of the treasury have both died, resigned, or cannot serve as secretary for other reasons, the order designates which Treasury officers are next in line to serve as acting secretary.
The order of succession is as follows: to link to any hyperlink of interest, click on this image below to access the actual lst:
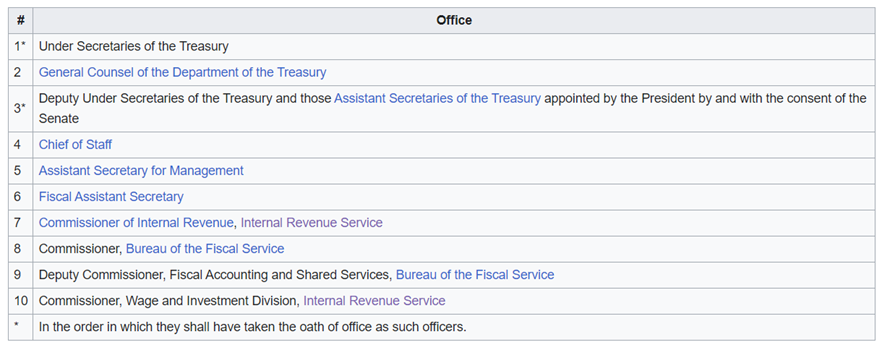
See Also:
Bio for Janet Yellen as first female Secretary of the U.S. Treasury:
Click on any of the following blue hyperlinks for more about Janet Yellen:
- Official website
- "Secretaries of the Treasury". History of the Treasury. United States Department of the Treasury. Retrieved April 9, 2006.
Bio for Janet Yellen as first female Secretary of the U.S. Treasury:
Click on any of the following blue hyperlinks for more about Janet Yellen:
- Early life and education
- Academic career
- Federal Reserve (1994–1997)
- Council of Economic Advisers (1997–1999)
- Return to the Federal Reserve (2004–2018)
- After the Federal Reserve (2018–2020)
- Secretary of the Treasury (2021–present)
- Economic philosophy
- Honors and awards
- Personal life
- In popular culture
- Selected works
- See also
- Official:
- Other:
Government Accountability Office (GAO)
- YouTube Video: GAO: How GAO Can Help Congress
- YouTube Video: GAO: What is the Center for Audit Excellence?
- YouTube Video: GAO: FraudNet – Reporting Fraud, Waste, Abuse, and Mismanagement of Federal Funds
The U.S. Government Accountability Office (GAO) is an independent, nonpartisan government agency within the legislative branch that provides auditing, evaluative, and investigative services for the United States Congress.
It is the supreme audit institution of the federal government of the United States. It identifies its core "mission values" as: accountability, integrity, and reliability. It is also known as the "congressional watchdog".
The agency is headed by the Comptroller General of the United States. The comptroller general is appointed by the president with the advice and consent of the Senate. When a vacancy occurs in the office of the comptroller general, Congress establishes a commission to recommend individuals to the president.
The commission consists of the following:
The commission must recommend at least three individuals to the president, and the president may request that the commission recommend additional individuals.
The president then selects an individual from those recommended to nominate as the new comptroller general. The president's nomination must be confirmed by the Senate's Committee on Homeland Security & Governmental Affairs before being voted on by the full Senate.
The current comptroller general is Gene Dodaro, who has served in the position since March 13, 2008.
Powers of GAO:
The work of the GAO is done at the request of congressional committees or subcommittees or is mandated by public laws or committee reports. It also undertakes research under the authority of the comptroller general. It supports congressional oversight by:
Products of GAO:
Products of the GAO include the following:
The GAO also produces special publications on specific issues of general interest to many Americans, such as its report on the fiscal future of the United States, GAO's role in the federal bid protest process, and critical issues for congressional consideration related to improving the nation's image abroad.
Organization:
The GAO is headquartered in Washington, D.C. and maintains an additional 11 field offices around the country. Each field office contains several mission teams, but not every mission team is represented at each field office.
Mission teams:
The GAO is composed of 15 mission teams that work on reports in a given subject area. Missions teams are headed by a Managing Director which fall under the Senior Executive Service.
The current slate of mission teams is:
Staff Offices:
In addition to its mission teams, the GAO also has 16 operations and staff components that support their work and carryout other agency functions, including its bid decisions.
History:
The GAO was established as the General Accounting Office by the Budget and Accounting Act of 1921.
The act required the head of the GAO to investigate:
According to the GAO's current mission statement, the agency exists to support the Congress in meeting its constitutional responsibilities and to help improve the performance and ensure the accountability of the federal government for the benefit of the American people.
The name was changed in 2004 to the Government Accountability Office by the GAO Human Capital Reform Act to better reflect the mission of the office. The GAO's auditors conduct not only financial audits, but also engage in a wide assortment of performance audits.
Over the years, the GAO has been referred to as "The Congressional Watchdog" and "The Taxpayers' Best Friend" for its frequent audits and investigative reports that have uncovered waste and inefficiency in government.
News media often draw attention to the GAO's work by publishing stories on the findings, conclusions, and recommendations of its reports. Members of Congress also frequently cite the GAO's work in statements to the press, congressional hearings, and floor debates on proposed legislation.
In 2007 the Partnership for Public Service ranked the GAO second on its list of the best places to work in the federal government and Washingtonian magazine included the GAO on its 2007 list of great places to work in Washington, a list that encompasses the public, private, and non-profit sectors.
The GAO is headed by the comptroller general of the U.S., a professional and non-partisan position in the U.S. government. The comptroller general is appointed by the president, by and with the advice and consent of the Senate, for a fifteen-year, non-renewable term. The president selects a nominee from a list of at least three individuals recommended by an eight-member bipartisan, bicameral commission of congressional leaders.
During such term, the comptroller general has standing to pursue litigation to compel access to federal agency information. The comptroller general may not be removed by the president, but only by Congress through impeachment or joint resolution for specific reasons.
Since 1921, there have been only seven comptrollers general, and no formal attempt has ever been made to remove a comptroller general.
Labor-management relations became fractious during the nine-year tenure of the seventh comptroller general, David M. Walker. On September 19, 2007, GAO analysts voted by a margin of two to one (897–445), in a 75% turnout, to establish the first union in the GAO's 86-year history. The analysts voted to affiliate with the International Federation of Professional and Technical Engineers (IFPTE), a member union of the AFL–CIO.
There are more than 1,800 analysts in the GAO analysts bargaining unit; the local voted to name itself IFPTE Local 1921, in honor of the date of the GAO's establishment. On February 14, 2008, the GAO analysts' union approved its first-ever negotiated pay contract with management; of just over 1,200 votes, 98% were in favor of the contract.
The GAO also establishes standards for audits of government organizations, programs, activities, and functions, and of government assistance received by contractors, nonprofit organizations, and other nongovernmental organizations.
These standards, often referred to as Generally Accepted Government Auditing Standards (GAGAS), are to be followed by auditors and audit organizations when required by law, regulation, agreement, contract, or policy. These standards pertain to auditors' professional qualifications, the quality of audit effort, and the characteristics of professional and meaningful audit reports.
In 1992, the GAO hosted the XIV INCOSAI, the fourteenth triennial convention of the International Organization of Supreme Audit Institutions (INTOSAI).
Reports
The GAO is a United States government electronic data provider, as all of its reports are available on its website, except for certain reports whose distribution is limited to official use in order to protect national security.
The variety of their reports' topics range:
The GAO often produces highlights of its reports that serve as a statement for the record for various subcommittees of the United States Congress.
Most GAO studies and reports are initiated by requests from members of Congress, including requests mandated in statute, and so reflect concerns of current political import, for example to study the impact of a government-wide hiring freeze.
Many reports are issued periodically and take a long view of U.S. agencies' operations. The GAO also produces annual reports on key issues such as Duplication and Cost savings and High-Risk Update.
The GAO prepares some 900 reports annually. The GAO publishes reports and information relating to, inter alia:
Financial statements of the U.S. government:
Each year the GAO issues an audit report on the financial statements of the United States Government.
Quinquennial strategic plan: The most recent GAO strategic plan, for 2018–2023, sets out four goals, namely:
Forensic Audits and Investigative Service (FAIS):
The Forensic Audits and Investigative Service (FAIS) team provides Congress with high-quality forensic audits and investigations of fraud, waste, and abuse; other special investigations; and security and vulnerability assessments. Its work cuts across a diverse array of government programs administered by:
Bid protests:
Unsuccessful bidders for government contracts may submit protests if they have reason to challenge an agency's decision, and the GAO may then release a report on the decision, redacted if necessary.
Various GAO decisions have confirmed that:
Technology assessments:
After the closing of the Office of Technology Assessment (OTA) in 1995, Congress directed the GAO to conduct a technology assessment (TA) pilot program.
Between 2002 and 2005, three reports were completed–-
The GAO reports and technology assessments, which are made available to the public, have become essential vehicles for understanding science and technology (S&T) implications of policies considered by the Congress.
Since 2008, Congress has established a permanent TA function within the GAO. This new operational role augments GAO's performance audits related to S&T issues, including effectiveness and efficiency of U.S. federal programs.
In 2010, the GAO joined the European Parliamentary Technology Assessment (EPTA) as an associate member. In 2019, the GAO established a new mission team, the Science, Technology Assessment, and Analytics team, which has primary responsibility for technology assessments.
The GAO has published a TA Design Handbook to help technology assessment teams analyze the impact of technology and make complex issues more easily understood and useful to policymakers.
The GAO defines TA as the "thorough and balanced analysis of significant primary, secondary, indirect, and delayed interactions of a technological innovation with society, the environment, and the economy and the present and foreseen consequences and impacts of those interactions."
Recognizing that the effects of those interactions can have implications, the GAO has in some of its products included policy options. The Technology Assessment section of its website lists GAO's public TA reports.
See also:
It is the supreme audit institution of the federal government of the United States. It identifies its core "mission values" as: accountability, integrity, and reliability. It is also known as the "congressional watchdog".
The agency is headed by the Comptroller General of the United States. The comptroller general is appointed by the president with the advice and consent of the Senate. When a vacancy occurs in the office of the comptroller general, Congress establishes a commission to recommend individuals to the president.
The commission consists of the following:
- the speaker of the United States House of Representatives
- the president pro tempore of the United States Senate
- the majority and minority leaders of the House of Representatives and the Senate
- the chair and ranking member of the Senate Committee on Homeland Security and Governmental Affairs
- the chair and ranking member of the House Committee on Oversight
The commission must recommend at least three individuals to the president, and the president may request that the commission recommend additional individuals.
The president then selects an individual from those recommended to nominate as the new comptroller general. The president's nomination must be confirmed by the Senate's Committee on Homeland Security & Governmental Affairs before being voted on by the full Senate.
The current comptroller general is Gene Dodaro, who has served in the position since March 13, 2008.
Powers of GAO:
The work of the GAO is done at the request of congressional committees or subcommittees or is mandated by public laws or committee reports. It also undertakes research under the authority of the comptroller general. It supports congressional oversight by:
- auditing agency operations to determine whether federal funds are being spent efficiently and effectively;
- investigating allegations of illegal and improper activities;
- reporting on how well government programs and policies are meeting their objectives;
- performing policy analyses and outlining options for congressional consideration;
- issuing legal decisions and opinions;
- advising Congress and the heads of executive agencies about ways to make government more efficient and effective.
Products of GAO:
Products of the GAO include the following:
- reports and written correspondence;
- testimonies and statements for the record, where the former are delivered orally by one or more GAO senior executives at a congressional hearing and the latter are provided for inclusion in the Congressional Record;
- briefings, which are usually given directly to congressional staff members;
- legal decisions and opinions resolving bid protests and addressing issues of appropriations law as well as opinions on the scope and exercise of authority of federal officers;
- science and technology assessments.
The GAO also produces special publications on specific issues of general interest to many Americans, such as its report on the fiscal future of the United States, GAO's role in the federal bid protest process, and critical issues for congressional consideration related to improving the nation's image abroad.
Organization:
The GAO is headquartered in Washington, D.C. and maintains an additional 11 field offices around the country. Each field office contains several mission teams, but not every mission team is represented at each field office.
Mission teams:
The GAO is composed of 15 mission teams that work on reports in a given subject area. Missions teams are headed by a Managing Director which fall under the Senior Executive Service.
The current slate of mission teams is:
- Applied Research and Methods (ARM)
- Contracting and National Security Acquisitions (CNSA)
- Defense Capabilities and Management (DCM)
- Education, Workforce, and Income Security (EWIS)
- Financial Management and Assurance (FMA)
- Financial Markets and Community Assistance (FMCA)
- Forensic Audits and Investigative Service (FAIS)
- Health Care (HC)
- Homeland Security and Justice (HSJ)
- Information Technology and Cybersecurity (ITC)
- International Affairs and Trade (ITA)
- Natural Resources and Environment (NRE)
- Physical Infrastructure (PI)
- Science, Technology, Assessments, and Analytics (STAA)
- Strategic Issues (SI)
Staff Offices:
In addition to its mission teams, the GAO also has 16 operations and staff components that support their work and carryout other agency functions, including its bid decisions.
- Audit Policy and Quality Assurance (APQA)
- Chief Administrative Office (CAO)
- Congressional Relations (CR)
- Continuous Process Improvement (CPI)
- Financial Management and Business Operations (FMBO)
- Field Operations (FO)
- Human Capital Office (HCO)
- Infrastructure Operations (IO)
- Information Systems & Technology Services (ISTS)
- Learning Center (LC)
- Professional Development Program (PDP)
- Office of the General Counsel (OGC)
- Office of the Inspector General (OIG)
- Office of Opportunity & Inclusiveness (O&I)
- Office of Public Affairs (OPA)
- Strategic Planning and External Liaison (SPEL)
History:
The GAO was established as the General Accounting Office by the Budget and Accounting Act of 1921.
The act required the head of the GAO to investigate:
- at the seat of government or elsewhere,
- all matters relating to the receipt, disbursement, and application of public funds,
- and shall make to the President ... and to Congress ... reports [and] recommendations looking to greater economy or efficiency in public expenditures.
According to the GAO's current mission statement, the agency exists to support the Congress in meeting its constitutional responsibilities and to help improve the performance and ensure the accountability of the federal government for the benefit of the American people.
The name was changed in 2004 to the Government Accountability Office by the GAO Human Capital Reform Act to better reflect the mission of the office. The GAO's auditors conduct not only financial audits, but also engage in a wide assortment of performance audits.
Over the years, the GAO has been referred to as "The Congressional Watchdog" and "The Taxpayers' Best Friend" for its frequent audits and investigative reports that have uncovered waste and inefficiency in government.
News media often draw attention to the GAO's work by publishing stories on the findings, conclusions, and recommendations of its reports. Members of Congress also frequently cite the GAO's work in statements to the press, congressional hearings, and floor debates on proposed legislation.
In 2007 the Partnership for Public Service ranked the GAO second on its list of the best places to work in the federal government and Washingtonian magazine included the GAO on its 2007 list of great places to work in Washington, a list that encompasses the public, private, and non-profit sectors.
The GAO is headed by the comptroller general of the U.S., a professional and non-partisan position in the U.S. government. The comptroller general is appointed by the president, by and with the advice and consent of the Senate, for a fifteen-year, non-renewable term. The president selects a nominee from a list of at least three individuals recommended by an eight-member bipartisan, bicameral commission of congressional leaders.
During such term, the comptroller general has standing to pursue litigation to compel access to federal agency information. The comptroller general may not be removed by the president, but only by Congress through impeachment or joint resolution for specific reasons.
Since 1921, there have been only seven comptrollers general, and no formal attempt has ever been made to remove a comptroller general.
Labor-management relations became fractious during the nine-year tenure of the seventh comptroller general, David M. Walker. On September 19, 2007, GAO analysts voted by a margin of two to one (897–445), in a 75% turnout, to establish the first union in the GAO's 86-year history. The analysts voted to affiliate with the International Federation of Professional and Technical Engineers (IFPTE), a member union of the AFL–CIO.
There are more than 1,800 analysts in the GAO analysts bargaining unit; the local voted to name itself IFPTE Local 1921, in honor of the date of the GAO's establishment. On February 14, 2008, the GAO analysts' union approved its first-ever negotiated pay contract with management; of just over 1,200 votes, 98% were in favor of the contract.
The GAO also establishes standards for audits of government organizations, programs, activities, and functions, and of government assistance received by contractors, nonprofit organizations, and other nongovernmental organizations.
These standards, often referred to as Generally Accepted Government Auditing Standards (GAGAS), are to be followed by auditors and audit organizations when required by law, regulation, agreement, contract, or policy. These standards pertain to auditors' professional qualifications, the quality of audit effort, and the characteristics of professional and meaningful audit reports.
In 1992, the GAO hosted the XIV INCOSAI, the fourteenth triennial convention of the International Organization of Supreme Audit Institutions (INTOSAI).
Reports
The GAO is a United States government electronic data provider, as all of its reports are available on its website, except for certain reports whose distribution is limited to official use in order to protect national security.
The variety of their reports' topics range:
- from Federal Budget and Fiscal Issues
- to Financial Management,
- Education,
- Retirement Issues,
- Defense,
- Homeland Security,
- Administration of Justice,
- Health Care,
- Information Management and Technology,
- Natural Resources,
- Environment,
- International Affairs,
- Trade,
- Financial Markets,
- Housing,
- Government Management and Human Capital,
- and Science
- and Technology Assessments and Analytics.
The GAO often produces highlights of its reports that serve as a statement for the record for various subcommittees of the United States Congress.
Most GAO studies and reports are initiated by requests from members of Congress, including requests mandated in statute, and so reflect concerns of current political import, for example to study the impact of a government-wide hiring freeze.
Many reports are issued periodically and take a long view of U.S. agencies' operations. The GAO also produces annual reports on key issues such as Duplication and Cost savings and High-Risk Update.
The GAO prepares some 900 reports annually. The GAO publishes reports and information relating to, inter alia:
Financial statements of the U.S. government:
Each year the GAO issues an audit report on the financial statements of the United States Government.
- The 2010 Financial Report of the United States Government was released on December 21, 2010.
- The accompanying press release states that the GAO 'cannot render an opinion on the 2010 consolidated financial statements of the federal government, because of widespread material internal control weaknesses, significant uncertainties, and other limitations'.
- U.S. public debt: As part of its initiative to advocate sustainability, the GAO publishes a Federal Fiscal Outlook Report, as well as data relating to the deficit. The U.S. deficit is presented on a cash rather than accruals basis, although the GAO notes that the accrual deficit "provides more information on the longer-term implications of the government's annual operations". In FY 2010, the US federal government had a net operating cost of $2,080 billion, although since this includes accounting provisions (estimates of future liabilities), the cash deficit is $1,294 billion.
Quinquennial strategic plan: The most recent GAO strategic plan, for 2018–2023, sets out four goals, namely:
- Address current and emerging challenges to the well-being and financial security of the American people;
- Help the Congress respond to changing security threats and the challenges of global interdependence;
- Help transform the Federal Government to address national challenges;
- Maximize the value of the GAO by enabling quality, timely service to the Congress and by being a leading practices federal agency.
Forensic Audits and Investigative Service (FAIS):
The Forensic Audits and Investigative Service (FAIS) team provides Congress with high-quality forensic audits and investigations of fraud, waste, and abuse; other special investigations; and security and vulnerability assessments. Its work cuts across a diverse array of government programs administered by:
- the IRS,
- the Centers for Medicare and Medicaid Services,
- the Department of Veterans Affairs,
- and the Department of Homeland Security, among others.
Bid protests:
Unsuccessful bidders for government contracts may submit protests if they have reason to challenge an agency's decision, and the GAO may then release a report on the decision, redacted if necessary.
Various GAO decisions have confirmed that:
- In reviewing protests of an agency’s evaluation, [GAO] does not reevaluate proposals, rather, we review the evaluation to determine if it was reasonable, consistent with the solicitation’s evaluation scheme and procurement statutes and regulations, and adequately documented.
- There is a facility within the Bid Protest Regulations for the GAO to recommend reimbursement of a bidder's protest costs if the procuring agency takes corrective action in response to a protest. The circumstances justifying bid protest cost reimbursement must involve "undue delay" by the agency in "taking corrective action in the face of a clearly meritorious protest".
Technology assessments:
After the closing of the Office of Technology Assessment (OTA) in 1995, Congress directed the GAO to conduct a technology assessment (TA) pilot program.
Between 2002 and 2005, three reports were completed–-
- use of biometrics for border security,
- cyber security for critical infrastructure protection,
- and technologies for protecting structures in wildland fires.
The GAO reports and technology assessments, which are made available to the public, have become essential vehicles for understanding science and technology (S&T) implications of policies considered by the Congress.
Since 2008, Congress has established a permanent TA function within the GAO. This new operational role augments GAO's performance audits related to S&T issues, including effectiveness and efficiency of U.S. federal programs.
In 2010, the GAO joined the European Parliamentary Technology Assessment (EPTA) as an associate member. In 2019, the GAO established a new mission team, the Science, Technology Assessment, and Analytics team, which has primary responsibility for technology assessments.
The GAO has published a TA Design Handbook to help technology assessment teams analyze the impact of technology and make complex issues more easily understood and useful to policymakers.
The GAO defines TA as the "thorough and balanced analysis of significant primary, secondary, indirect, and delayed interactions of a technological innovation with society, the environment, and the economy and the present and foreseen consequences and impacts of those interactions."
Recognizing that the effects of those interactions can have implications, the GAO has in some of its products included policy options. The Technology Assessment section of its website lists GAO's public TA reports.
See also:
- Official website
- General Accounting Office Reports, on the website of the Federation of American Scientists
- Title 4 of the Code of Federal Regulations
- Offices
- Non-governmental organizations (NGOs)
- Audit
- International
- Australia: Australian National Audit Office
- Botswana: Office of the Auditor General (Botswana)
- Brazil: Court of Accounts of the Union
- Canada: Auditor General of Canada
- European Union: Court of Auditors
- Hong Kong: Director of Audit of Hong Kong
- India: Comptroller and Auditor General of India
- Mexico: Auditoría Superior de la Federación
- Philippines: Commission on Audit
- Republic of China (Taiwan): Control Yuan
- United Kingdom: National Audit Office
The Economist (Magazine)
- YouTube Video: The World Ahead 2023: five stories to watch out for
- YouTube Video: How The Economist makes the best charts on the internet
- YouTube Video: New technology: what do you have to fear?
The Economist is a British weekly newspaper printed in demitab format and published digitally. It focuses on current affairs, international business, politics, technology, and culture.
Based in London, the newspaper is owned by the Economist Group, with its core editorial offices in the United States, as well as across major cities in continental Europe, Asia, and the Middle East.
In 2019, its average global print circulation was over 909,476; this, combined with its digital presence, runs to over 1.6 million. Across its social media platforms, it reaches an audience of 35 million, as of 2016. The newspaper has a prominent focus on data journalism and interpretive analysis over original reporting, to both criticism and acclaim.
Founded in 1843, The Economist was first circulated by Scottish economist James Wilson to muster support for abolishing the British Corn Laws (1815–1846), a system of import tariffs.
Over time, the newspaper's coverage expanded further into political economy and eventually began running articles on current events, finance, commerce, and British politics. Throughout the mid-to-late 20th century, it greatly expanded its layout and format,
adding:
The paper is recognisable by its fire engine red masthead (US: nameplate) and illustrated, topical covers.
Individual articles are written anonymously, with no byline, in order for the paper to speak as one collective voice. It is supplemented by its sister lifestyle magazine, 1843, and a variety of podcasts, films, and books.
The editorial stance of The Economist primarily revolves around classical, social, and most notably economic liberalism. It has supported radical centrism as the concept became established in the late 20th century, favouring policies and governments that maintain centrist politics.
The newspaper typically champions economic liberalism, particularly:
Despite a pronounced editorial stance, it is seen as having little reporting bias, and as exercising rigorous fact-checking and strict copyediting.
Its extensive use of word play, high subscription prices, and depth of coverage has linked the paper with a high-income and educated readership, drawing both positive and negative connotations. In line with this, it claims to have an influential readership of prominent business leaders and policy-makers.
History:
The Economist was founded by the British businessman and banker James Wilson in 1843, to advance the repeal of the Corn Laws, a system of import tariffs. A prospectus for the newspaper from 5 August 1843 enumerated thirteen areas of coverage that its editors wanted the publication to focus on:
Original leading articles, in which free-trade principles will be most rigidly applied to all the important questions of the day.
Wilson described it as taking part in "a severe contest between intelligence, which presses forward, and an unworthy, timid ignorance obstructing our progress", a phrase which still appears on its imprint (US: masthead) as the publication's mission.
It has long been respected as "one of the most competent and subtle Western periodicals on public affairs". It was cited by Karl Marx in his formulation of socialist theory because Marx felt the publication epitomised the interests of the bourgeoisie. He wrote that "the London Economist, the European organ of the aristocracy of finance, described most strikingly the attitude of this class."
In 1915, revolutionary Vladimir Lenin referred to The Economist as a "journal that speaks for British millionaires". Additionally, Lenin stated that The Economist held a "bourgeois-pacifist" position and supported peace out of fear of revolution.
In the currency disputes of the mid nineteenth century, the journal sided with the Banking School against the Currency School. It criticised the Bank Charter Act of 1844 which restricted the amount of bank notes that the Bank of England could issue on the basis of Currency School policy encouraged by Lord Overstone, that eventually developed into monetarism. It blamed the 1857 financial crisis in Britain on 'a certain class of doctrinaires' who 'refer every commercial crisis and its disastrous consequences to "excessive issues of bank notes". It identified the causes of the financial crisis as variations in interest rates and a build-up of excess financial capital leading to unwise investments.
In 1920, the paper's circulation rose to 6,170. In 1934, it underwent its first major redesign. The current fire engine red nameplate was created by Reynolds Stone in 1959.
In 1971, The Economist changed its broadsheet format into a magazine-style perfect-bound formatting. In January 2012, The Economist launched a new weekly section devoted exclusively to China, the first new country section since the introduction of one on the United States in 1942.
In 1991, James Fallows argued in The Washington Post that The Economist used editorial lines that contradicted the news stories they purported to highlight. In 1999, Andrew Sullivan complained in The New Republic that it uses "marketing genius" to make up for deficiencies in original reporting, resulting in "a kind of Reader's Digest" for America's corporate elite. The Guardian wrote that "its writers rarely see a political or economic problem that cannot be solved by the trusted three-card trick of privatisation, deregulation and liberalisation".
In 2005, the Chicago Tribune named it the best English-language paper noting its strength in international reporting where it does not feel moved to "cover a faraway land only at a time of unmitigated disaster" and that it kept a wall between its reporting and its more conservative editorial policies.
In 2008, Jon Meacham, former editor of Newsweek and a self-described "fan", criticised The Economist's focus on analysis over original reporting.
In 2012, The Economist was accused of hacking into the computer of Justice Mohammed Nizamul Huq of the Bangladesh Supreme Court, leading to his resignation as the chairman of the International Crimes Tribunal.
In August 2015, Pearson sold its 50% stake in the newspaper to the Italian Agnelli family's investment company, Exor, for £469 million (US$531 million) and the paper re-acquired the remaining shares for £182 million ($206 million).
Organisation:
Shareholders:
Pearson plc held a 50% shareholding via The Financial Times Limited until August 2015. At that time, Pearson sold their share in the Economist. The Agnelli family's Exor paid £287m to raise their stake from 4.7% to 43.4% while the Economist paid £182m for the balance of 5.04m shares which will be distributed to current shareholders.
Aside from the Agnelli family, smaller shareholders in the company include:
A board of trustees formally appoints the editor, who cannot be removed without its permission. The Economist Newspaper Limited is a wholly owned subsidiary of The Economist Group. Sir Evelyn Robert de Rothschild was chairman of the company from 1972 to 1989.
Although The Economist has a global emphasis and scope, about two-thirds of the 75 staff journalists are based in the London borough of Westminster.
However, due to half of all subscribers originating in the United States, The Economist has core editorial offices and substantial operations in New York City, Los Angeles, Chicago, and Washington D.C.
Editor:
The editor-in-chief, commonly known simply as "the Editor", of The Economist is charged with formulating the paper's editorial policies and overseeing corporate operations.
Tone and voice:
Though it has many individual columns, by tradition and current practice the newspaper ensures a uniform voice—aided by the anonymity of writers—throughout its pages, as if most articles were written by a single author, which may be perceived to display dry, understated wit, and precise use of language.
The Economist's treatment of economics presumes a working familiarity with fundamental concepts of classical economics. For instance, it does not explain terms like invisible hand, macroeconomics, or demand curve, and may take just six or seven words to explain the theory of comparative advantage.
Articles involving economics do not presume any formal training on the part of the reader and aim to be accessible to the educated layperson. It usually does not translate short French (and German) quotes or phrases. It does describe the business or nature of even well-known entities, writing, for example, "Goldman Sachs, an investment bank".
The Economist is known for its extensive use of word play, including puns, allusions, and metaphors, as well as alliteration and assonance, especially in its headlines and captions. This can make it difficult to understand for those who are not native English speakers.
The Economist has traditionally and historically persisted in referring to itself as a "newspaper", rather than a "news magazine" due to its mostly cosmetic switch from broadsheet to perfect-binding format and its general focus on current affairs as opposed to specialist subjects. It is legally classified as a newspaper in Britain and the United States.
Most databases and anthologies catalogue the weekly as a newspaper printed in magazine- or journal-format. The Economist differentiates and contrasts itself as a newspaper against their sister lifestyle magazine, 1843, which does the same in turn.
Editor Zanny Minton Bedoes clarified the distinction in 2016: "we call it a newspaper because it was founded in 1843, 173 years ago, [when] all [perfect-bound publications] were called newspapers."
Editorial anonymity:
The Economist's articles often take a definite editorial stance and almost never carry a byline. Not even the name of the editor is printed in the issue. It is a long-standing tradition that an editor's only signed article during their tenure is written on the occasion of their departure from the position.
The author of a piece is named in certain circumstances: when notable persons are invited to contribute opinion pieces; when journalists of The Economist compile special reports (previously known as surveys); for the Year in Review special edition; and to highlight a potential conflict of interest over a book review. The names of The Economist editors and correspondents can be located on the media directory pages of the website.
Online blog pieces are signed with the initials of the writer and authors of print stories are allowed to note their authorship from their personal web sites. "This approach is not without its faults (we have four staff members with the initials 'J.P.', for example) but is the best compromise between total anonymity and full bylines, in our view", wrote one anonymous writer of The Economist.
There are three editorial and business areas in which the anonymous ethos of the weekly has contributed to strengthening its unique identity: collective and consistent voice, talent and newsroom management, and brand strength and clarity.
The editors say this is necessary because "collective voice and personality matter more than the identities of individual journalists" and reflects "a collaborative effort". In most articles, authors refer to themselves as "your correspondent" or "this reviewer".
The writers of the titled opinion columns tend to refer to themselves by the title (hence, a sentence in the "Lexington" column might read "Lexington was informed...").
American author and long-time reader Michael Lewis criticised the paper's editorial anonymity in 1991, labelling it a means to hide the youth and inexperience of those writing articles. Although individual articles are written anonymously, there is no secrecy over who the writers are, as they are listed on The Economist's website, which also provides summaries of their careers and academic qualifications.
Later, in 2009, Lewis included multiple Economist articles in his anthology about the 2008 financial crisis, Panic: The Story of Modern Financial Insanity.
John Ralston Saul describes The Economist as a "...[newspaper] which hides the names of the journalists who write its articles in order to create the illusion that they dispense disinterested truth rather than opinion. This sales technique, reminiscent of pre-Reformation Catholicism, is not surprising in a publication named after the social science most given to wild guesses and imaginary facts presented in the guise of inevitability and exactitude.
That it is the Bible of the corporate executive indicates to what extent received wisdom is the daily bread of a managerial civilization."
Features:
The Economist's primary focus is world events, politics and business, but it also runs regular sections on science and technology as well as books and the arts. Approximately every two weeks, the publication includes an in-depth special report (previously called surveys) on a given topic.
The five main categories are Countries and Regions, Business, Finance and Economics, Science, and Technology. The newspaper goes to press on Thursdays, between 6 p.m. and 7 p.m. GMT, and is available at newsagents in many countries the next day. It is printed at seven sites around the world.
Since July 2007, there has also been a complete audio edition of the paper available 9 pm London time on Thursdays. The audio version of The Economist is produced by the production company Talking Issues. The company records the full text of the newspaper in MP3 format, including the extra pages in the UK edition. The weekly 130 MB download is free for subscribers and available for a fee for non-subscribers.
The publication's writers adopt a tight style that seeks to include the maximum amount of information in a limited space. David G. Bradley, publisher of The Atlantic, described the formula as "a consistent world view expressed, consistently, in tight and engaging prose".
Letters:
The Economist frequently receives letters from its readership in response to the previous week's edition. While it is known to feature letters from senior businesspeople, politicians, ambassadors, and spokespeople, the paper includes letters from typical readers as well.
Well-written or witty responses from anyone are considered, and controversial issues frequently produce a torrent of letters. For example, the survey of corporate social responsibility, published January 2005, produced largely critical letters from:
In an effort to foster diversity of thought, The Economist routinely publishes letters that openly criticize the paper's articles and stance. After The Economist ran a critique of Amnesty International and human rights in general in its issue dated 24 March 2007, its letters page ran a reply from Amnesty, as well as several other letters in support of the organisation, including one from the head of the United Nations Commission on Human Rights.
Rebuttals from officials within regimes such as the Singapore government are routinely printed, to comply with local right-of-reply laws without compromising editorial independence.
Letters published in the paper are typically between 150 and 200 words long and had the now-discontinued salutation 'Sir' from 1843 to 2015. In the latter year, upon the appointment of Zanny Minton Beddoes, the first female editor, the salutation was dismissed; letters have since had no salutation. Prior to a change in procedure, all responses to online articles were published in "The Inbox".
Columns:
The publication runs several opinion columns whose names reflect their topic:
TQ:
Every three months, The Economist publishes a technology report called Technology Quarterly, or simply, TQ, a special section focusing on recent trends and developments in science and technology. The feature is also known to intertwine "economic matters with a technology".
The TQ often carries a theme, such as quantum computing or cloud storage, and assembles an assortment of articles around the common subject.
1843:
Main article: 1843 (magazine)
In September 2007, The Economist launched a sister lifestyle magazine under the title Intelligent Life as a quarterly publication. At its inauguration it was billed as for "the arts, style, food, wine, cars, travel and anything else under the sun, as long as it's interesting".
The magazine focuses on analysing the "insights and predictions for the luxury landscape" across the world. Approximately ten years later, in March 2016, the newspaper's parent company, Economist Group, rebranded the lifestyle magazine as 1843, in honour of the paper's founding year.
It has since remained at six issues per year, and carries the motto "Stories of An Extraordinary World". Unlike The Economist, the author's names appear next to their articles in 1843.
1843 features contributions from Economist journalists as well as writers around the world and photography commissioned for each issue. It is seen as a market competitor to The Wall Street Journal's WSJ. and the Financial Times' FT Magazine. It has, since its March 2016 relaunch, been edited by Rosie Blau, a former correspondent for The Economist.
The World Ahead:
The paper also produces two annual reviews and predictive reports titled The World In [Year] and The World If [Year] as part of their The World Ahead franchise. In both features, the newspaper publishes a review of the social, cultural, economic and political events that have shaped the year and will continue to influence the immediate future. The issue was described by the American think tank Brookings Institution as "The Economist's annual [150-page] exercise in forecasting."
An Urdu-language version of The World In [Year] in collaboration with The Economist is being distributed by Jang Group in Pakistan.
Books:
In addition to publishing its main newspaper, lifestyle magazine, and special features, The Economist also produces books with topics overlapping with that of its newspaper. The weekly also publishes a series of technical manuals (or guides) as an offshoot of its explanatory journalism. Some of these books serve as collections of articles and columns the paper produces.
Often columnists from the newspaper write technical manuals on their topic of expertise; for example, Philip Coggan, a finance correspondent, authored The Economist Guide to Hedge Funds (2011).
Additionally, the paper publishes book reviews in every issue, with a large collective review in their year-end (holiday) issue – published as "The Economist's Books of the Year". The paper has its own in-house stylebook rather than following an industry-wide writing style template. All Economist writing and publications follow The Economist Style Guide, in various editions.
Writing competitions:
The Economist sponsors a wide array of writing competitions and prizes throughout the year for readers. In 1999, The Economist organised a global futurist writing competition, The World in 2050.
Co-sponsored by Royal Dutch/Shell, the competition included a first prize of US$20,000 and publication in The Economist's annual flagship publication, The World In. Over 3,000 entries from around the world were submitted via a website set up for the purpose and at various Royal Dutch Shell offices worldwide.
The judging panel included:
In the summer of 2019, they launched the Open Future writing competition with an inaugural youth essay-writing prompt about climate change. During this competition the paper accepted a submission from an artificially-intelligent computer writing program.
Data journalism:
The presence of data journalism in The Economist can be traced to its founding year in 1843. Initially, the weekly published basic international trade figures and tables. The paper first included a graphical model in 1847, with a bubble chart detailing precious metals, and its first non-epistolary chart was included in its 1854 issue, charting the spread of cholera.
This early adoption of data-based articles was estimated to be "a 100 years before the field's modern emergence" by Data Journalism.com.
Its transition from broadsheet to magazine-style formatting led to the adoption of coloured graphs, first in fire-engine-red during the 1980s and then to a thematic blue in 2001.
The Economist told their readers throughout the 2000s that the paper's editors had "developed a taste for data-driven stories". Starting in the late-2000s, they began to publish more and more articles that centred solely on charts, some of which began to be published daily. The daily charts are typically followed by a short, 300-word explanation.
In September 2009, The Economist launched a Twitter account for their Data Team.
In 2015, the weekly formed a dedicated team of 12 data analysts, designers, and journalists to head up their firm-wide data journalism efforts. In order to ensure transparency in their data collection The Economist maintains a corporate GitHub account to publicly disclose all of their models and software.
In October 2018, they introduced their "Graphic Detail" feature in both their print and digital editions. The Graphic Detail feature would go on to include mainly graphs, maps, and infographics.
The Economist's Data Team won the 2020 Sigma Data Journalism Award for Best Young Journalists. In 2015, they placed third for an infographic describing Israel's coalition networks in the year's Data Journalism Awards by the Global Editors Network.
Indexes:
Historically, the publication has also maintained a section of economic statistics, such as employment figures, economic growth, and interest rates. These statistical publications have been found to be seen as authoritative and decisive in British society.
The Economist also publishes a variety of rankings seeking to position business schools and undergraduate universities among each other, respectively. In 2015, they published their first ranking of U.S. universities, focusing on comparable economic advantages.
Their data for the rankings is sourced from the U.S. Department of Education and is calculated as a function of median earnings through regression analysis. Among others, the most well-known data indexes the weekly publishes are:
Opinions:
Main article: The Economist editorial stance
The editorial stance of The Economist primarily revolves around classical, social, and most notably, economic liberalism. Since its founding, it has supported radical centrism, favouring policies and governments that maintain centrist politics. The newspaper typically champions:
When the newspaper was founded, the term economism denoted what would today be termed "economic liberalism". The activist and journalist George Monbiot has described it as neoliberal while occasionally accepting the propositions of Keynesian economics where deemed more "reasonable". The weekly favours a carbon tax to fight global warming.
According to one former editor, Bill Emmott, "the Economist's philosophy has always been liberal, not conservative". Alongside other publications such as The Guardian, The Observer and The Independent, it supports the United Kingdom becoming a republic.
Individual contributors take diverse views. The Economist favours the support, through central banks, of banks and other important corporations. This principle can, in a much more limited form, be traced back to Walter Bagehot, the third editor of The Economist, who argued that the Bank of England should support major banks that got into difficulties.
Karl Marx deemed The Economist the "European organ" of "the aristocracy of finance". The newspaper has also supported liberal causes on social issues such as:
The Economist consistently favours guest worker programmes, parental choice of school, and amnesties and once published an "obituary" of God. The Economist also has a long record of supporting gun control.
The Economist has endorsed the Labour Party (in 2005), the Conservative Party (in 2010 and 2015), and the Liberal Democrats (in 2017 and 2019) at general election time in Britain, and both Republican and Democratic candidates in the United States.
Economist.com puts its stance this way:
What, besides free trade and free markets, does The Economist believe in? "It is to the Radicals that The Economist still likes to think of itself as belonging. The extreme centre is the paper's historical position". That is as true today as when Crowther [Geoffrey, Economist editor 1938–1956] said it in 1955. The Economist considers itself the enemy of privilege, pomposity and predictability.
It has backed conservatives such as Ronald Reagan and Margaret Thatcher. It has supported the Americans in Vietnam. But it has also endorsed Harold Wilson and Bill Clinton, and espoused a variety of liberal causes: opposing capital punishment from its earliest days, while favouring penal reform and decolonisation, as well as—more recently—gun control and gay marriage.
In 2008, The Economist commented that Cristina Fernández de Kirchner, the president of Argentina at the time was "Dashing hopes of change, Argentina's new president is leading her country into economic peril and social conflict".
The Economist also called for Bill Clinton's impeachment and, after the emergence of the Abu Ghraib torture and prisoner abuse, for Donald Rumsfeld's resignation.
Though The Economist initially gave vigorous support for the U.S.-led invasion of Iraq, it later called the operation "bungled from the start" and criticised the "almost criminal negligence" of the Bush Administration's handling of the war, while maintaining, in 2007, that pulling out in the short term would be irresponsible.
In an editorial marking its 175th anniversary, The Economist criticised adherents to liberalism for becoming too inclined to protect the political status quo rather than pursue reform. The paper called on liberals to return to advocating for bold political, economic and social reforms:
Circulation:
Each of The Economist issues' official date range is from Saturday to the following Friday. The Economist posts each week's new content online at approximately 21:00 Thursday evening UK time, ahead of the official publication date.
From July to December 2019, their average global print circulation was over 909,476, while combined with their digital presence, runs to over 1.6 million. However, on a weekly average basis, the paper can reach up to 5.1 million readers, across their print and digital runs.
Across their social media platforms, it reaches an audience of 35 million, as of 2016.
In 1877, the publication's circulation was 3,700, and in 1920 it had risen to 6,000. Circulation increased rapidly after 1945, reaching 100,000 by 1970.
Circulation is audited by the Audit Bureau of Circulations (ABC). From around 30,000 in 1960 it has risen to near 1 million by 2000 and by 2016 to about 1.3 million.
Approximately half of all sales (54%) originate in the United States with sales in the United Kingdom making 14% of the total and continental Europe 19%. Of its American readers, two out of three earn more than $100,000 a year. The Economist has sales, both by subscription and at newsagents, in over 200 countries.
The Economist once boasted about its limited circulation. In the early 1990s it used the slogan "The Economist – not read by millions of people". "Never in the history of journalism has so much been read for so long by so few," wrote Geoffrey Crowther, a former editor.
Censorship:
Sections of The Economist criticising authoritarian regimes are frequently removed from the paper by the authorities in those countries.
Like many other publications, The Economist is subjected to censorship in Iran. On 15 June 2006, Iran banned the sale of The Economist when it published a map labelling the Persian Gulf simply as Gulf—a choice that derives its political significance from the Persian Gulf naming dispute.
In a separate incident, the government of Zimbabwe went further and imprisoned The Economist's correspondent there, Andrew Meldrum. The government charged him with violating a statute on "publishing untruth" for writing that a woman was decapitated by supporters of the ruling Zimbabwe African National Union – Patriotic Front party.
The decapitation claim was retracted and allegedly fabricated by the woman's husband. The correspondent was later acquitted, only to receive a deportation order.
On 19 August 2013, The Economist disclosed that the Missouri Department of Corrections had censored its issue of 29 June 2013. According to the letter sent by the department, prisoners were not allowed to receive the issue because "1. it constitutes a threat to the security or discipline of the institution; 2. may facilitate or encourage criminal activity; or 3. may interfere with the rehabilitation of an offender".
See also:
Based in London, the newspaper is owned by the Economist Group, with its core editorial offices in the United States, as well as across major cities in continental Europe, Asia, and the Middle East.
In 2019, its average global print circulation was over 909,476; this, combined with its digital presence, runs to over 1.6 million. Across its social media platforms, it reaches an audience of 35 million, as of 2016. The newspaper has a prominent focus on data journalism and interpretive analysis over original reporting, to both criticism and acclaim.
Founded in 1843, The Economist was first circulated by Scottish economist James Wilson to muster support for abolishing the British Corn Laws (1815–1846), a system of import tariffs.
Over time, the newspaper's coverage expanded further into political economy and eventually began running articles on current events, finance, commerce, and British politics. Throughout the mid-to-late 20th century, it greatly expanded its layout and format,
adding:
- opinion columns,
- special reports,
- political cartoons,
- reader letters,
- cover stories,
- art critique,
- book reviews,
- and technology features.
The paper is recognisable by its fire engine red masthead (US: nameplate) and illustrated, topical covers.
Individual articles are written anonymously, with no byline, in order for the paper to speak as one collective voice. It is supplemented by its sister lifestyle magazine, 1843, and a variety of podcasts, films, and books.
The editorial stance of The Economist primarily revolves around classical, social, and most notably economic liberalism. It has supported radical centrism as the concept became established in the late 20th century, favouring policies and governments that maintain centrist politics.
The newspaper typically champions economic liberalism, particularly:
Despite a pronounced editorial stance, it is seen as having little reporting bias, and as exercising rigorous fact-checking and strict copyediting.
Its extensive use of word play, high subscription prices, and depth of coverage has linked the paper with a high-income and educated readership, drawing both positive and negative connotations. In line with this, it claims to have an influential readership of prominent business leaders and policy-makers.
History:
The Economist was founded by the British businessman and banker James Wilson in 1843, to advance the repeal of the Corn Laws, a system of import tariffs. A prospectus for the newspaper from 5 August 1843 enumerated thirteen areas of coverage that its editors wanted the publication to focus on:
Original leading articles, in which free-trade principles will be most rigidly applied to all the important questions of the day.
- Articles relating to some practical, commercial, agricultural, or foreign topic of passing interest, such as foreign treaties.
- An article on the elementary principles of political economy, applied to practical experience, covering the laws related to prices, wages, rent, exchange, revenue and taxes.
- Parliamentary reports, with particular focus on commerce, agriculture and free trade.
- Reports and accounts of popular movements advocating free trade.
- General news from the Court of St James's, the Metropolis, the Provinces, Scotland, and Ireland.
- Commercial topics such as:
- changes in fiscal regulations,
- the state and prospects of the markets,
- imports and exports,
- foreign news,
- the state of the manufacturing districts,
- notices of important new mechanical improvements,
- shipping news,
- the money market,
- and the progress of railways and public companies.
- Agricultural topics, including:
- the application of geology and chemistry;
- notices of new and improved implements,
- state of crops,
- markets,
- prices,
- foreign markets and prices converted into English money;
- from time to time, in some detail, the plans pursued in Belgium, Switzerland, and other well-cultivated countries.
- Colonial and foreign topics, including:
- trade,
- produce,
- political and fiscal changes,
- and other matters,
- including exposés on the evils of restriction and protection, and the advantages of free intercourse and trade.
- Law reports, confined chiefly to areas important to commerce, manufacturing, and agriculture.
- Books, confined chiefly, but not so exclusively, to commerce, manufacturing, and agriculture, and including all treatises on political economy, finance, or taxation.
- A commercial gazette, with prices and statistics of the week.
- Correspondence and inquiries from the newspaper's readers.
Wilson described it as taking part in "a severe contest between intelligence, which presses forward, and an unworthy, timid ignorance obstructing our progress", a phrase which still appears on its imprint (US: masthead) as the publication's mission.
It has long been respected as "one of the most competent and subtle Western periodicals on public affairs". It was cited by Karl Marx in his formulation of socialist theory because Marx felt the publication epitomised the interests of the bourgeoisie. He wrote that "the London Economist, the European organ of the aristocracy of finance, described most strikingly the attitude of this class."
In 1915, revolutionary Vladimir Lenin referred to The Economist as a "journal that speaks for British millionaires". Additionally, Lenin stated that The Economist held a "bourgeois-pacifist" position and supported peace out of fear of revolution.
In the currency disputes of the mid nineteenth century, the journal sided with the Banking School against the Currency School. It criticised the Bank Charter Act of 1844 which restricted the amount of bank notes that the Bank of England could issue on the basis of Currency School policy encouraged by Lord Overstone, that eventually developed into monetarism. It blamed the 1857 financial crisis in Britain on 'a certain class of doctrinaires' who 'refer every commercial crisis and its disastrous consequences to "excessive issues of bank notes". It identified the causes of the financial crisis as variations in interest rates and a build-up of excess financial capital leading to unwise investments.
In 1920, the paper's circulation rose to 6,170. In 1934, it underwent its first major redesign. The current fire engine red nameplate was created by Reynolds Stone in 1959.
In 1971, The Economist changed its broadsheet format into a magazine-style perfect-bound formatting. In January 2012, The Economist launched a new weekly section devoted exclusively to China, the first new country section since the introduction of one on the United States in 1942.
In 1991, James Fallows argued in The Washington Post that The Economist used editorial lines that contradicted the news stories they purported to highlight. In 1999, Andrew Sullivan complained in The New Republic that it uses "marketing genius" to make up for deficiencies in original reporting, resulting in "a kind of Reader's Digest" for America's corporate elite. The Guardian wrote that "its writers rarely see a political or economic problem that cannot be solved by the trusted three-card trick of privatisation, deregulation and liberalisation".
In 2005, the Chicago Tribune named it the best English-language paper noting its strength in international reporting where it does not feel moved to "cover a faraway land only at a time of unmitigated disaster" and that it kept a wall between its reporting and its more conservative editorial policies.
In 2008, Jon Meacham, former editor of Newsweek and a self-described "fan", criticised The Economist's focus on analysis over original reporting.
In 2012, The Economist was accused of hacking into the computer of Justice Mohammed Nizamul Huq of the Bangladesh Supreme Court, leading to his resignation as the chairman of the International Crimes Tribunal.
In August 2015, Pearson sold its 50% stake in the newspaper to the Italian Agnelli family's investment company, Exor, for £469 million (US$531 million) and the paper re-acquired the remaining shares for £182 million ($206 million).
Organisation:
Shareholders:
Pearson plc held a 50% shareholding via The Financial Times Limited until August 2015. At that time, Pearson sold their share in the Economist. The Agnelli family's Exor paid £287m to raise their stake from 4.7% to 43.4% while the Economist paid £182m for the balance of 5.04m shares which will be distributed to current shareholders.
Aside from the Agnelli family, smaller shareholders in the company include:
- Cadbury,
- Rothschild (21%),
- Schroder,
- Layton and other family interests
- as well as a number of staff and former staff shareholders.
A board of trustees formally appoints the editor, who cannot be removed without its permission. The Economist Newspaper Limited is a wholly owned subsidiary of The Economist Group. Sir Evelyn Robert de Rothschild was chairman of the company from 1972 to 1989.
Although The Economist has a global emphasis and scope, about two-thirds of the 75 staff journalists are based in the London borough of Westminster.
However, due to half of all subscribers originating in the United States, The Economist has core editorial offices and substantial operations in New York City, Los Angeles, Chicago, and Washington D.C.
Editor:
The editor-in-chief, commonly known simply as "the Editor", of The Economist is charged with formulating the paper's editorial policies and overseeing corporate operations.
Tone and voice:
Though it has many individual columns, by tradition and current practice the newspaper ensures a uniform voice—aided by the anonymity of writers—throughout its pages, as if most articles were written by a single author, which may be perceived to display dry, understated wit, and precise use of language.
The Economist's treatment of economics presumes a working familiarity with fundamental concepts of classical economics. For instance, it does not explain terms like invisible hand, macroeconomics, or demand curve, and may take just six or seven words to explain the theory of comparative advantage.
Articles involving economics do not presume any formal training on the part of the reader and aim to be accessible to the educated layperson. It usually does not translate short French (and German) quotes or phrases. It does describe the business or nature of even well-known entities, writing, for example, "Goldman Sachs, an investment bank".
The Economist is known for its extensive use of word play, including puns, allusions, and metaphors, as well as alliteration and assonance, especially in its headlines and captions. This can make it difficult to understand for those who are not native English speakers.
The Economist has traditionally and historically persisted in referring to itself as a "newspaper", rather than a "news magazine" due to its mostly cosmetic switch from broadsheet to perfect-binding format and its general focus on current affairs as opposed to specialist subjects. It is legally classified as a newspaper in Britain and the United States.
Most databases and anthologies catalogue the weekly as a newspaper printed in magazine- or journal-format. The Economist differentiates and contrasts itself as a newspaper against their sister lifestyle magazine, 1843, which does the same in turn.
Editor Zanny Minton Bedoes clarified the distinction in 2016: "we call it a newspaper because it was founded in 1843, 173 years ago, [when] all [perfect-bound publications] were called newspapers."
Editorial anonymity:
The Economist's articles often take a definite editorial stance and almost never carry a byline. Not even the name of the editor is printed in the issue. It is a long-standing tradition that an editor's only signed article during their tenure is written on the occasion of their departure from the position.
The author of a piece is named in certain circumstances: when notable persons are invited to contribute opinion pieces; when journalists of The Economist compile special reports (previously known as surveys); for the Year in Review special edition; and to highlight a potential conflict of interest over a book review. The names of The Economist editors and correspondents can be located on the media directory pages of the website.
Online blog pieces are signed with the initials of the writer and authors of print stories are allowed to note their authorship from their personal web sites. "This approach is not without its faults (we have four staff members with the initials 'J.P.', for example) but is the best compromise between total anonymity and full bylines, in our view", wrote one anonymous writer of The Economist.
There are three editorial and business areas in which the anonymous ethos of the weekly has contributed to strengthening its unique identity: collective and consistent voice, talent and newsroom management, and brand strength and clarity.
The editors say this is necessary because "collective voice and personality matter more than the identities of individual journalists" and reflects "a collaborative effort". In most articles, authors refer to themselves as "your correspondent" or "this reviewer".
The writers of the titled opinion columns tend to refer to themselves by the title (hence, a sentence in the "Lexington" column might read "Lexington was informed...").
American author and long-time reader Michael Lewis criticised the paper's editorial anonymity in 1991, labelling it a means to hide the youth and inexperience of those writing articles. Although individual articles are written anonymously, there is no secrecy over who the writers are, as they are listed on The Economist's website, which also provides summaries of their careers and academic qualifications.
Later, in 2009, Lewis included multiple Economist articles in his anthology about the 2008 financial crisis, Panic: The Story of Modern Financial Insanity.
John Ralston Saul describes The Economist as a "...[newspaper] which hides the names of the journalists who write its articles in order to create the illusion that they dispense disinterested truth rather than opinion. This sales technique, reminiscent of pre-Reformation Catholicism, is not surprising in a publication named after the social science most given to wild guesses and imaginary facts presented in the guise of inevitability and exactitude.
That it is the Bible of the corporate executive indicates to what extent received wisdom is the daily bread of a managerial civilization."
Features:
The Economist's primary focus is world events, politics and business, but it also runs regular sections on science and technology as well as books and the arts. Approximately every two weeks, the publication includes an in-depth special report (previously called surveys) on a given topic.
The five main categories are Countries and Regions, Business, Finance and Economics, Science, and Technology. The newspaper goes to press on Thursdays, between 6 p.m. and 7 p.m. GMT, and is available at newsagents in many countries the next day. It is printed at seven sites around the world.
Since July 2007, there has also been a complete audio edition of the paper available 9 pm London time on Thursdays. The audio version of The Economist is produced by the production company Talking Issues. The company records the full text of the newspaper in MP3 format, including the extra pages in the UK edition. The weekly 130 MB download is free for subscribers and available for a fee for non-subscribers.
The publication's writers adopt a tight style that seeks to include the maximum amount of information in a limited space. David G. Bradley, publisher of The Atlantic, described the formula as "a consistent world view expressed, consistently, in tight and engaging prose".
Letters:
The Economist frequently receives letters from its readership in response to the previous week's edition. While it is known to feature letters from senior businesspeople, politicians, ambassadors, and spokespeople, the paper includes letters from typical readers as well.
Well-written or witty responses from anyone are considered, and controversial issues frequently produce a torrent of letters. For example, the survey of corporate social responsibility, published January 2005, produced largely critical letters from:
- Oxfam,
- the World Food Programme,
- United Nations Global Compact,
- the Chairman of BT Group,
- an ex-Director of Shell
- and the UK Institute of Directors.
In an effort to foster diversity of thought, The Economist routinely publishes letters that openly criticize the paper's articles and stance. After The Economist ran a critique of Amnesty International and human rights in general in its issue dated 24 March 2007, its letters page ran a reply from Amnesty, as well as several other letters in support of the organisation, including one from the head of the United Nations Commission on Human Rights.
Rebuttals from officials within regimes such as the Singapore government are routinely printed, to comply with local right-of-reply laws without compromising editorial independence.
Letters published in the paper are typically between 150 and 200 words long and had the now-discontinued salutation 'Sir' from 1843 to 2015. In the latter year, upon the appointment of Zanny Minton Beddoes, the first female editor, the salutation was dismissed; letters have since had no salutation. Prior to a change in procedure, all responses to online articles were published in "The Inbox".
Columns:
The publication runs several opinion columns whose names reflect their topic:
- Bagehot (Britain): named for Walter Bagehot, 19th-century British constitutional expert and early editor of The Economist. Since April 2017 it has been written by Adrian Wooldridge, who succeeded David Rennie.
- Banyan (Asia): named for the banyan tree, this column was established in April 2009 and focuses on various issues across the Asian continent, and is written by Dominic Ziegler.
- Bartleby (Work and management): named after the titular character of a Herman Melville short story, this column was established in May 2018. It was written by Philip Coggan until August 2021.
- Buttonwood (Finance): named for the buttonwood tree where early Wall Street traders gathered. Until September 2006 this was available only as an on-line column, but it is now included in the print edition. Since 2018, it is written by John O'Sullivan, succeeding Philip Coggan.
- Chaguan (China): named for Chaguan, the traditional Chinese Tea houses in Chengdu, this column was established on 13 September 2018.
- Charlemagne (Europe): named for Charlemagne, Emperor of the Frankish Empire. It is written by Jeremy Cliffe and earlier it was written by David Rennie (2007–2010) and by Anton La Guardia (2010–2014).
- Johnson (language): named for Samuel Johnson, this column returned to the publication in 2016 and covers language. It is written by Robert Lane Greene.
- Lexington (United States): named for Lexington, Massachusetts, the site of the beginning of the American Revolutionary War. From June 2010 until May 2012 it was written by Peter David, until his death in a car accident.
- Schumpeter (Business): named for the economist Joseph Schumpeter, this column was established in September 2009 and is written by Patrick Foulis.
- Free Exchange (Economics): a general economics column, frequently based on academic research, replaced the column Economics Focus in January 2012
- Obituary (recent death): Since 1997 it has been written by Ann Wroe.
TQ:
Every three months, The Economist publishes a technology report called Technology Quarterly, or simply, TQ, a special section focusing on recent trends and developments in science and technology. The feature is also known to intertwine "economic matters with a technology".
The TQ often carries a theme, such as quantum computing or cloud storage, and assembles an assortment of articles around the common subject.
1843:
Main article: 1843 (magazine)
In September 2007, The Economist launched a sister lifestyle magazine under the title Intelligent Life as a quarterly publication. At its inauguration it was billed as for "the arts, style, food, wine, cars, travel and anything else under the sun, as long as it's interesting".
The magazine focuses on analysing the "insights and predictions for the luxury landscape" across the world. Approximately ten years later, in March 2016, the newspaper's parent company, Economist Group, rebranded the lifestyle magazine as 1843, in honour of the paper's founding year.
It has since remained at six issues per year, and carries the motto "Stories of An Extraordinary World". Unlike The Economist, the author's names appear next to their articles in 1843.
1843 features contributions from Economist journalists as well as writers around the world and photography commissioned for each issue. It is seen as a market competitor to The Wall Street Journal's WSJ. and the Financial Times' FT Magazine. It has, since its March 2016 relaunch, been edited by Rosie Blau, a former correspondent for The Economist.
The World Ahead:
The paper also produces two annual reviews and predictive reports titled The World In [Year] and The World If [Year] as part of their The World Ahead franchise. In both features, the newspaper publishes a review of the social, cultural, economic and political events that have shaped the year and will continue to influence the immediate future. The issue was described by the American think tank Brookings Institution as "The Economist's annual [150-page] exercise in forecasting."
An Urdu-language version of The World In [Year] in collaboration with The Economist is being distributed by Jang Group in Pakistan.
Books:
In addition to publishing its main newspaper, lifestyle magazine, and special features, The Economist also produces books with topics overlapping with that of its newspaper. The weekly also publishes a series of technical manuals (or guides) as an offshoot of its explanatory journalism. Some of these books serve as collections of articles and columns the paper produces.
Often columnists from the newspaper write technical manuals on their topic of expertise; for example, Philip Coggan, a finance correspondent, authored The Economist Guide to Hedge Funds (2011).
Additionally, the paper publishes book reviews in every issue, with a large collective review in their year-end (holiday) issue – published as "The Economist's Books of the Year". The paper has its own in-house stylebook rather than following an industry-wide writing style template. All Economist writing and publications follow The Economist Style Guide, in various editions.
Writing competitions:
The Economist sponsors a wide array of writing competitions and prizes throughout the year for readers. In 1999, The Economist organised a global futurist writing competition, The World in 2050.
Co-sponsored by Royal Dutch/Shell, the competition included a first prize of US$20,000 and publication in The Economist's annual flagship publication, The World In. Over 3,000 entries from around the world were submitted via a website set up for the purpose and at various Royal Dutch Shell offices worldwide.
The judging panel included:
- Bill Emmott,
- Esther Dyson,
- Sir Mark Moody-Stuart,
- and Matt Ridley.
In the summer of 2019, they launched the Open Future writing competition with an inaugural youth essay-writing prompt about climate change. During this competition the paper accepted a submission from an artificially-intelligent computer writing program.
Data journalism:
The presence of data journalism in The Economist can be traced to its founding year in 1843. Initially, the weekly published basic international trade figures and tables. The paper first included a graphical model in 1847, with a bubble chart detailing precious metals, and its first non-epistolary chart was included in its 1854 issue, charting the spread of cholera.
This early adoption of data-based articles was estimated to be "a 100 years before the field's modern emergence" by Data Journalism.com.
Its transition from broadsheet to magazine-style formatting led to the adoption of coloured graphs, first in fire-engine-red during the 1980s and then to a thematic blue in 2001.
The Economist told their readers throughout the 2000s that the paper's editors had "developed a taste for data-driven stories". Starting in the late-2000s, they began to publish more and more articles that centred solely on charts, some of which began to be published daily. The daily charts are typically followed by a short, 300-word explanation.
In September 2009, The Economist launched a Twitter account for their Data Team.
In 2015, the weekly formed a dedicated team of 12 data analysts, designers, and journalists to head up their firm-wide data journalism efforts. In order to ensure transparency in their data collection The Economist maintains a corporate GitHub account to publicly disclose all of their models and software.
In October 2018, they introduced their "Graphic Detail" feature in both their print and digital editions. The Graphic Detail feature would go on to include mainly graphs, maps, and infographics.
The Economist's Data Team won the 2020 Sigma Data Journalism Award for Best Young Journalists. In 2015, they placed third for an infographic describing Israel's coalition networks in the year's Data Journalism Awards by the Global Editors Network.
Indexes:
Historically, the publication has also maintained a section of economic statistics, such as employment figures, economic growth, and interest rates. These statistical publications have been found to be seen as authoritative and decisive in British society.
The Economist also publishes a variety of rankings seeking to position business schools and undergraduate universities among each other, respectively. In 2015, they published their first ranking of U.S. universities, focusing on comparable economic advantages.
Their data for the rankings is sourced from the U.S. Department of Education and is calculated as a function of median earnings through regression analysis. Among others, the most well-known data indexes the weekly publishes are:
- The Big Mac Index: a measure of the purchasing power of currencies, first published in 1986, using the price of the hamburger in different countries. This is published twice a year since 2006, annually prior to that.
- Democracy Index: a measure of the state of democracy in the world, produced by the paper's Economist Intelligence Unit (EIU)
- The Glass Ceiling Index: a measure of female equality in the workplace.
- The Most Dangerous Cities Index: a measure of major cities by rates of homicide.
- Commodity-Price Index: a measure of commodities, such as gold and brent oil, as well as agricultural items
Opinions:
Main article: The Economist editorial stance
The editorial stance of The Economist primarily revolves around classical, social, and most notably, economic liberalism. Since its founding, it has supported radical centrism, favouring policies and governments that maintain centrist politics. The newspaper typically champions:
- neoliberalism,
- particularly free markets,
- free trade,
- free immigration,
- deregulation,
- and globalisation.
When the newspaper was founded, the term economism denoted what would today be termed "economic liberalism". The activist and journalist George Monbiot has described it as neoliberal while occasionally accepting the propositions of Keynesian economics where deemed more "reasonable". The weekly favours a carbon tax to fight global warming.
According to one former editor, Bill Emmott, "the Economist's philosophy has always been liberal, not conservative". Alongside other publications such as The Guardian, The Observer and The Independent, it supports the United Kingdom becoming a republic.
Individual contributors take diverse views. The Economist favours the support, through central banks, of banks and other important corporations. This principle can, in a much more limited form, be traced back to Walter Bagehot, the third editor of The Economist, who argued that the Bank of England should support major banks that got into difficulties.
Karl Marx deemed The Economist the "European organ" of "the aristocracy of finance". The newspaper has also supported liberal causes on social issues such as:
- recognition of gay marriages,
- legalisation of drugs,
- criticises the U.S. tax model,
- and seems to support some government regulation on health issues,
- such as smoking in public,
- as well as bans on smacking children.
The Economist consistently favours guest worker programmes, parental choice of school, and amnesties and once published an "obituary" of God. The Economist also has a long record of supporting gun control.
The Economist has endorsed the Labour Party (in 2005), the Conservative Party (in 2010 and 2015), and the Liberal Democrats (in 2017 and 2019) at general election time in Britain, and both Republican and Democratic candidates in the United States.
Economist.com puts its stance this way:
What, besides free trade and free markets, does The Economist believe in? "It is to the Radicals that The Economist still likes to think of itself as belonging. The extreme centre is the paper's historical position". That is as true today as when Crowther [Geoffrey, Economist editor 1938–1956] said it in 1955. The Economist considers itself the enemy of privilege, pomposity and predictability.
It has backed conservatives such as Ronald Reagan and Margaret Thatcher. It has supported the Americans in Vietnam. But it has also endorsed Harold Wilson and Bill Clinton, and espoused a variety of liberal causes: opposing capital punishment from its earliest days, while favouring penal reform and decolonisation, as well as—more recently—gun control and gay marriage.
In 2008, The Economist commented that Cristina Fernández de Kirchner, the president of Argentina at the time was "Dashing hopes of change, Argentina's new president is leading her country into economic peril and social conflict".
The Economist also called for Bill Clinton's impeachment and, after the emergence of the Abu Ghraib torture and prisoner abuse, for Donald Rumsfeld's resignation.
Though The Economist initially gave vigorous support for the U.S.-led invasion of Iraq, it later called the operation "bungled from the start" and criticised the "almost criminal negligence" of the Bush Administration's handling of the war, while maintaining, in 2007, that pulling out in the short term would be irresponsible.
In an editorial marking its 175th anniversary, The Economist criticised adherents to liberalism for becoming too inclined to protect the political status quo rather than pursue reform. The paper called on liberals to return to advocating for bold political, economic and social reforms:
- protecting free markets,
- land and tax reform in the tradition of Georgism,
- open immigration,
- a rethink of the social contract with more emphasis on education,
- and a revival of liberal internationalism.
Circulation:
Each of The Economist issues' official date range is from Saturday to the following Friday. The Economist posts each week's new content online at approximately 21:00 Thursday evening UK time, ahead of the official publication date.
From July to December 2019, their average global print circulation was over 909,476, while combined with their digital presence, runs to over 1.6 million. However, on a weekly average basis, the paper can reach up to 5.1 million readers, across their print and digital runs.
Across their social media platforms, it reaches an audience of 35 million, as of 2016.
In 1877, the publication's circulation was 3,700, and in 1920 it had risen to 6,000. Circulation increased rapidly after 1945, reaching 100,000 by 1970.
Circulation is audited by the Audit Bureau of Circulations (ABC). From around 30,000 in 1960 it has risen to near 1 million by 2000 and by 2016 to about 1.3 million.
Approximately half of all sales (54%) originate in the United States with sales in the United Kingdom making 14% of the total and continental Europe 19%. Of its American readers, two out of three earn more than $100,000 a year. The Economist has sales, both by subscription and at newsagents, in over 200 countries.
The Economist once boasted about its limited circulation. In the early 1990s it used the slogan "The Economist – not read by millions of people". "Never in the history of journalism has so much been read for so long by so few," wrote Geoffrey Crowther, a former editor.
Censorship:
Sections of The Economist criticising authoritarian regimes are frequently removed from the paper by the authorities in those countries.
Like many other publications, The Economist is subjected to censorship in Iran. On 15 June 2006, Iran banned the sale of The Economist when it published a map labelling the Persian Gulf simply as Gulf—a choice that derives its political significance from the Persian Gulf naming dispute.
In a separate incident, the government of Zimbabwe went further and imprisoned The Economist's correspondent there, Andrew Meldrum. The government charged him with violating a statute on "publishing untruth" for writing that a woman was decapitated by supporters of the ruling Zimbabwe African National Union – Patriotic Front party.
The decapitation claim was retracted and allegedly fabricated by the woman's husband. The correspondent was later acquitted, only to receive a deportation order.
On 19 August 2013, The Economist disclosed that the Missouri Department of Corrections had censored its issue of 29 June 2013. According to the letter sent by the department, prisoners were not allowed to receive the issue because "1. it constitutes a threat to the security or discipline of the institution; 2. may facilitate or encourage criminal activity; or 3. may interfere with the rehabilitation of an offender".
See also:
- Official website
- The Economist at the HathiTrust Digital Library
- The Wall Street Journal (WSJ)
- List of business newspapers
- List of newspapers in the United Kingdom