Copyright © 2015 Bert N. Langford (Images may be subject to copyright. Please send feedback)
Welcome to Our Generation USA!
This Web page
Transportation
covers all modes of transport (passengers or freight), whether by land, air, or by sea, and including technological advancements in transportation means.
Transportation in the United States
YouTube Video: The World Biggest Container Ship: The Majestic Maersk | FT World
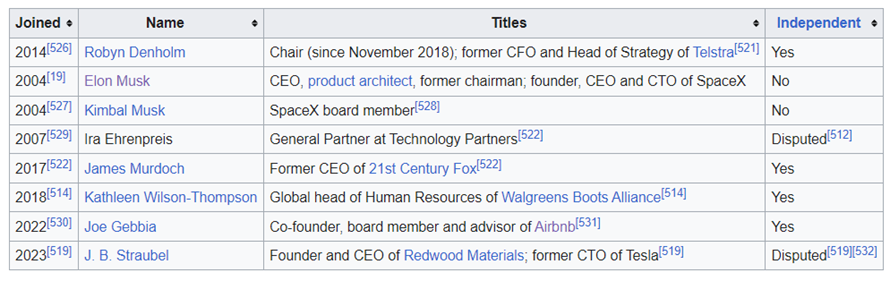
Pictured: Left to right: The New York City Subway is the world's largest rapid transit system by length of routes and by number of stations (courtesy of AEMoreira042281 - Own work, CC BY-SA 3.0); A traffic jam on a typical American freeway, the Santa Monica Freeway in Los Angeles. (Courtesy of Coolcaesar at en.wikipedia - Transfered from en.wikipedia Transfer was stated to be made by User:Rschen7754.); A Cargo Container Ship.
Transport or transportation is the movement of people, animals and goods from one location to another.
Modes of transport include air, rail, road, water, cable, pipeline and space.
The field can be divided into infrastructure, vehicles and operations. Transport is important because it enables trade between persons, which is essential for the development of civilizations.
Transport infrastructure consists of the fixed installations including:
Terminals may be used both for interchange of passengers and cargo and for maintenance.
Vehicles traveling on these networks may include:
Operations deal with the way the vehicles are operated, and the procedures set for this purpose including financing, legalities and policies. In the transport industry, operations and ownership of infrastructure can be either public or private, depending on the country and mode.
Passenger transport may be public, where operators provide scheduled services, or private.
Freight transport has become focused on containerization, although bulk transport is used for large volumes of durable items.
Transport plays an important part in economic growth and globalization, but most types cause air pollution and use large amounts of land.
While it is heavily subsidized by governments, good planning of transport is essential to make traffic flow and restrain urban sprawl.
For amplification, click on any of the following hyperlinks:
Modes of transport include air, rail, road, water, cable, pipeline and space.
The field can be divided into infrastructure, vehicles and operations. Transport is important because it enables trade between persons, which is essential for the development of civilizations.
Transport infrastructure consists of the fixed installations including:
- roads,
- railways,
- airways,
- waterways,
- canals,
- pipelines,
- and terminals such as airports, railway stations, bus stations, warehouses, trucking terminals, refueling depots (including fueling docks and fuel stations) and seaports.
Terminals may be used both for interchange of passengers and cargo and for maintenance.
Vehicles traveling on these networks may include:
- automobiles and other motorized vehicles
- bicycles,
- buses,
- trains,
- trucks,
- people,
- helicopters,
- watercraft,
- spacecraft,
- and aircraft.
Operations deal with the way the vehicles are operated, and the procedures set for this purpose including financing, legalities and policies. In the transport industry, operations and ownership of infrastructure can be either public or private, depending on the country and mode.
Passenger transport may be public, where operators provide scheduled services, or private.
Freight transport has become focused on containerization, although bulk transport is used for large volumes of durable items.
Transport plays an important part in economic growth and globalization, but most types cause air pollution and use large amounts of land.
While it is heavily subsidized by governments, good planning of transport is essential to make traffic flow and restrain urban sprawl.
For amplification, click on any of the following hyperlinks:
Smart Traffic Light Technology
YouTube Video: ADAPTIVE TRAFFIC SIGNALS
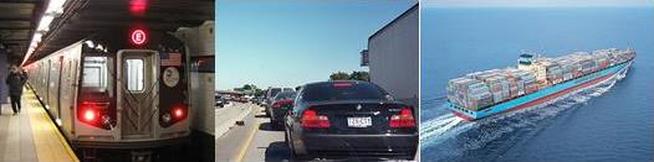
Pictured: How adaptive signal light systems work to coordinate smoother traffic flow
"How Smart Traffic Lights Could Transform Your Commute" (Time Magazine May 5, 2016 Issue By Josh Sanburn
"The traffic signals along Factoria Boulevard in Bellevue, Wash., generally don’t flash the same stretch of green twice in a row, especially at rush hour. At 9:30 a.m., the full red/yellow/green signal cycle might be 140 seconds. By 9:33 a.m, a burst of additional traffic might push it to 145 seconds. Less traffic at 9:37 a.m. could push it down to 135. Just like the traffic itself, the timing of the signals fluctuates.
That’s by design. Bellevue, a fast-growing city of more than 130,000 just east of Seattle, utilizes a system that is gaining popularity around the U.S.: intersection signals that can adjust in real-time to traffic conditions. City officials say that these lights, known as adaptive signals, have led to significant declines in both the hassle and cost of commuting.
“Adaptive signals make sure that inefficiencies never happen,” says Alex Stevanovic, director of the Laboratory for Adaptive Traffic Operations & Management at Florida Atlantic University. “They can make sure that the traffic demand that is there is being addressed.”
As city leaders increasingly turn to data for insight into running their metros more efficiently, adaptive signals have emerged as a 21st century strategy to chip away at a longstanding scourge. According to the U.S. Census Bureau, almost 11 million Americans commute more than an hour each way to their job while 600,000 U.S. residents have one-way “megacommutes” of at least 90 minutes or 50 miles.
And all that time on the roads costs money. The Center for Economics and Business Research estimates that U.S. commuters lost $124 billion in 2013 due to the cost of fuel, the value of time wasted in traffic, and the increased cost of doing business. CEBR predicts those costs will rise 50% by 2030.
Only 3% of the nation’s traffic signals are currently adaptive, but the number of smart signals in the U.S. has jumped from 4,500 in 2009 to 6,500 in 2014, according to Stevanovic, who tracks the signals’ installation around the U.S." (Click Here for Rest of article)
Smart traffic light:
Smart traffic lights or Smart traffic signals are by the definition given by developers of a pilot project in Pittsburgh. "A new system that combines existing technology with artificial intelligence to create lights that truly think for themselves".
Also known as intelligent traffic lights and advanced traffic lights this system differs to the traditional Traffic light system which are advanced signalling devices positioned at pedestrian crossings, road intersections and other places to control the flow of traffic.
They are, in essence, signals that utilize a buried induction coil to sense the presence of signals that adapt to information that is received from a central computer about the position, speed and direction of vehicles. The pilot project in Pittsburgh may be the first step in their production across the United States of America.
The technology for smart traffic signals has been developed by professors and students at Carnegie Mellon University and is being used in a pilot project in Pittsburgh in an effort to reduce vehicle emissions in the city. Unlike other dynamic control signals that adjust the timing and phasing of lights according to limits that are set in controller programming, this new system combines existing technology with artificial intelligence to create lights that truly think for themselves.
The signals communicate with each other and adapt to changing traffic conditions to reduce the amount of time that cars spend idling. Using fiber optic video receivers similar to those already employed in dynamic control systems, the new technology monitors vehicle numbers and makes changes in real time to avoid congestion wherever possible. Initial results from the pilot study are encouraging: the amount of time that motorists spent idling at lights was reduced by 40% and travel times across the city were reduced by 26%.
Possible Benefits:
Companies involved in developing smart traffic management systems include BMW and Siemens, who unveiled their system of networked lights in 2010.
This system works with the anti-idling technology that many cars are equipped with, to warn them of impending light changes. This should help cars that feature anti-idling systems to use them more intelligently, and the information that networks receive from the cars should help them to adjust light cycling times to make them more efficient.
A new patent appearing March 1st, 2016 by John F. Hart Jr. is for a "Smart" traffic control system that "sees" traffic approaching the intersections and reacts according to what is needed to keep the flow of vehicles at the most efficient rate. By anticipating the needs of the approaching vehicles, as opposed to reacting to them after they arrive and stop, this system has the potential to save motorist time while cutting down harmful emissions.
Romanian and US research teams believe that the time spent by motorists waiting for lights to change could be reduced by over 28% with the introduction of smart traffic lights and that CO2 emissions could be cut by as much as 6.5%.
A major use of Smart traffic lights could be as part of public transport systems. The signals can be set up to sense the approach of buses or trams and change the signals in their favor, thus improving the speed and efficiency of sustainable transport modes.
Obstacles to widespread introduction:
The main stumbling block to the widespread introduction of such systems is the fact that most vehicles on the road are unable to communicate with the computer systems that town and city authorities use to control traffic lights. However, the trial in Harris County, Texas, referred to above, uses a simple system based on signals received from drivers' cell phones and it has found that even if only a few drivers have their phone switched on, the system is still able to produce reliable data on traffic density.
This means that the adoption of smart traffic lights around the world could be started as soon as a reasonable minority of vehicles were fitted with the technology to communicate with the computers that control the signals rather than having to wait until the majority of cars had such technology.
Simpler systems:
Meanwhile, in the United Kingdom, lights that change to red when sensing that an approaching motorist is traveling too fast are being tracked in Swindon to see if they are more effective at reducing the number of accidents on the road than the speed cameras that preceded them and which were removed following a council decision in 2008.
These lights are more focused on encouraging motorists to obey the law but if they prove to be a success then they could pave the way for more sophisticated systems to be introduced in the UK.
Previous research:
In addition to the findings of the Romanian and US researchers mentioned above, scientists in Dresden, Germany came to the conclusion that smart traffic lights could handle their task more efficiently without human interface.
See also:
Are "Driverless Cars" in your Future? Reports by "The Guardian"* and "Consumer Reports"** cite the risks as well as the rewards.
* -- The Guardian
** -- Consumer Reports
YouTube Video: How Does Google's Driverless Car Work?
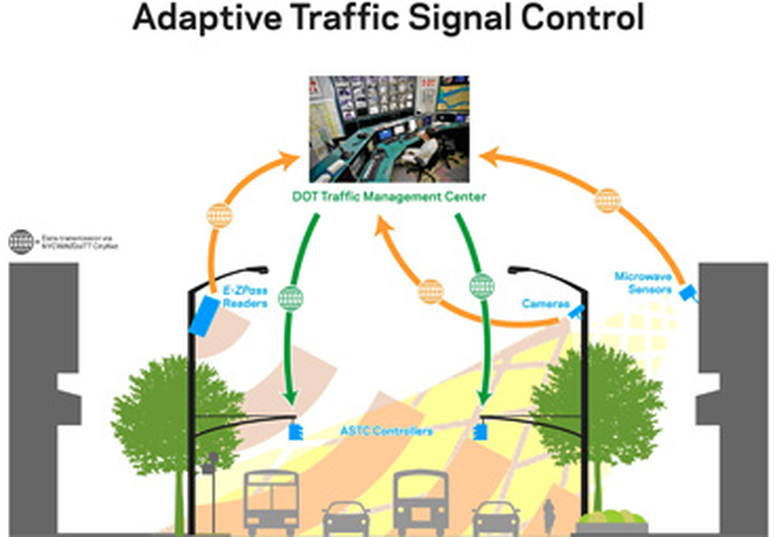
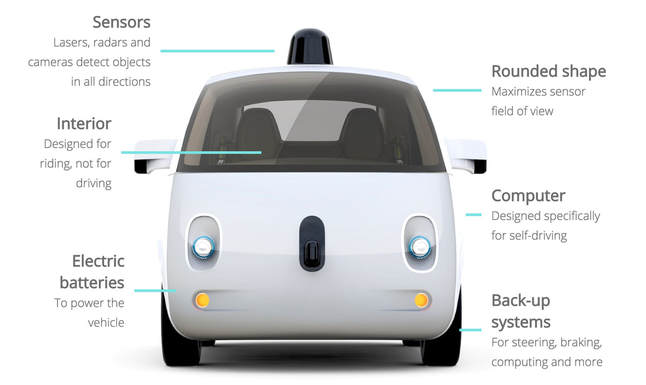
Pictured: Google begins monthly updates for driverless car project, reporting accidents
Click here to read the special report by The Guardian
Click here to read the report by Consumer Reports.
A driverless car, (aka) self-driving car, robotic car) is a vehicle that is capable of sensing its environment and navigating without human input.
Autonomous cars can detect surroundings using a variety of techniques such as radar, lidar, GPS, odometry, and computer vision. Advanced control systems interpret sensory information to identify appropriate navigation paths, as well as obstacles and relevant signage.
Autonomous cars have control systems that are capable of analyzing sensory data to distinguish between different cars on the road, which is very useful in planning a path to the desired destination.
Some demonstrative systems, precursory to autonomous cars, date back to the 1920s and 30s.
The first self-sufficient (and therefore, truly autonomous) cars appeared in the 1980s, with Carnegie Mellon University's Navlab and ALV projects in 1984 and Mercedes-Benz and Bundeswehr University Munich's Eureka Prometheus Project in 1987. Since then, numerous major companies and research organizations have developed working prototype autonomous vehicles.
Among the potential benefits of automated cars is a significant reduction of traffic accidents, and the resulting deaths and injuries, and related costs, including lower insurance costs; major increases in roadway capacity, with the potential to more than quadruple capacity, resulting in:
Among the main obstacles and disadvantages due to a widespread adoption of autonomous vehicles, in addition to the technological challenges, are:
Autonomous vs. Automated:
Autonomous means having the power for self-governance. Many historical projects related to vehicle autonomy have in fact only been automated (made to be automatic) due to a heavy reliance on artificial hints in their environment, such as magnetic strips.
Autonomous control implies good performance under significant uncertainties in the environment for extended periods of time and the ability to compensate for system failures without external intervention.
As can be seen from many projects mentioned, it is often suggested to extend the capabilities of an autonomous car by implementing communication networks both in the immediate vicinity (for collision avoidance) and far away (for congestion management).
By bringing in these outside influences in the decision process, some would no longer regard the car's behavior or capabilities as autonomous; for example Wood et al. (2012) writes "This Article generally uses the term 'autonomous,' instead of the term 'automated.'"
The term "autonomous" was chosen "because it is the term that is currently in more widespread use (and thus is more familiar to the general public). However, the latter term is arguably more accurate. 'Automated' connotes control or operation by a machine, while 'autonomous' connotes acting alone or independently.
Most of the vehicle concepts (that we are currently aware of) have a person in the driver’s seat, utilize a communication connection to the Cloud or other vehicles, and do not independently select either destinations or routes for reaching them. Thus, the term 'automated' would more accurately describe these vehicle concepts".
For further information about "Driverless" cars, click on any of the following hyperlinks:
Click here to read the report by Consumer Reports.
A driverless car, (aka) self-driving car, robotic car) is a vehicle that is capable of sensing its environment and navigating without human input.
Autonomous cars can detect surroundings using a variety of techniques such as radar, lidar, GPS, odometry, and computer vision. Advanced control systems interpret sensory information to identify appropriate navigation paths, as well as obstacles and relevant signage.
Autonomous cars have control systems that are capable of analyzing sensory data to distinguish between different cars on the road, which is very useful in planning a path to the desired destination.
Some demonstrative systems, precursory to autonomous cars, date back to the 1920s and 30s.
The first self-sufficient (and therefore, truly autonomous) cars appeared in the 1980s, with Carnegie Mellon University's Navlab and ALV projects in 1984 and Mercedes-Benz and Bundeswehr University Munich's Eureka Prometheus Project in 1987. Since then, numerous major companies and research organizations have developed working prototype autonomous vehicles.
Among the potential benefits of automated cars is a significant reduction of traffic accidents, and the resulting deaths and injuries, and related costs, including lower insurance costs; major increases in roadway capacity, with the potential to more than quadruple capacity, resulting in:
- significantly less traffic congestion;
- enhanced mobility for the elderly, people with disabilities, and low-income citizens;
- relieve travelers from driving and navigation chores, freeing commuting hours with more time for leisure or work;
- less fuel consumption, producing less air pollution and a lower carbon footprint from road travel;
- significantly reduced parking space needs in cities, freeing space for other public and private uses;
- and facilitating or improving existing and new business models of mobility as a service, including:
- carsharing,
- e-hailing,
- ride hailing services,
- real-time ride sharing,
- and other services of the sharing economy,
- all contributing to reduce car ownership.
Among the main obstacles and disadvantages due to a widespread adoption of autonomous vehicles, in addition to the technological challenges, are:
- disputes concerning liability;
- the time period needed to turn an existing stock of vehicles from non-autonomous to autonomous;
- resistance by individuals to forfeit control of their cars; consumer concern about the safety of driverless cars;
- implementation of legal framework and establishment of government regulations for self-driving cars;
- risk of loss of privacy and security concerns, such as hackers or terrorism;
- concerns about the resulting loss of driving-related jobs in the road transport industry;
- and risk of increased suburbanization as driving becomes faster and less onerous without proper public policies in place to avoid more urban sprawl.
Autonomous vs. Automated:
Autonomous means having the power for self-governance. Many historical projects related to vehicle autonomy have in fact only been automated (made to be automatic) due to a heavy reliance on artificial hints in their environment, such as magnetic strips.
Autonomous control implies good performance under significant uncertainties in the environment for extended periods of time and the ability to compensate for system failures without external intervention.
As can be seen from many projects mentioned, it is often suggested to extend the capabilities of an autonomous car by implementing communication networks both in the immediate vicinity (for collision avoidance) and far away (for congestion management).
By bringing in these outside influences in the decision process, some would no longer regard the car's behavior or capabilities as autonomous; for example Wood et al. (2012) writes "This Article generally uses the term 'autonomous,' instead of the term 'automated.'"
The term "autonomous" was chosen "because it is the term that is currently in more widespread use (and thus is more familiar to the general public). However, the latter term is arguably more accurate. 'Automated' connotes control or operation by a machine, while 'autonomous' connotes acting alone or independently.
Most of the vehicle concepts (that we are currently aware of) have a person in the driver’s seat, utilize a communication connection to the Cloud or other vehicles, and do not independently select either destinations or routes for reaching them. Thus, the term 'automated' would more accurately describe these vehicle concepts".
For further information about "Driverless" cars, click on any of the following hyperlinks:
- Classification
- Technology
- History
- Transport systems
- Potential advantages
- Potential obstacles
- Potential disadvantages
- Safety record
- Policy implications including Legislation
- Vehicular communication systems
- Public opinion surveys
- Moral issues
- In fiction
- See also:
- Automated guideway transit
- Automatic train operation
- Automobile safety
- Automotive navigation system
- Autopilot
- Autotech
- Connected car
- Dutch Automated Vehicle Initiative
- Death by GPS
- Driverless tractor
- Elevator operator
- Hybrid navigation
- Intelligent transportation system
- Mobility as a service (transport)
- Personal rapid transit
- Technological unemployment
- Unmanned ground vehicle
- Unmanned aerial vehicle / Drone
- Vehicle infrastructure integration
- Vehicular automation
- Vision processing unit
- Manufacturers:
- Autonomous driving functions:
Rail Transportation in the United States
YouTube Video about Amtrak Vacations: Routes
YouTube Video: Amtrak Pacific Surfliner Amenities
Pictured Below: (L-R) US HIGH SPEED RAIL ASSOCIATION: 21st Century Transportation for America; BNSF freight train rolls through the Rollins Pass in the Rocky Mountains with the rugged snow.
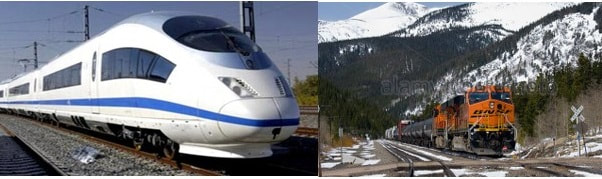
Rail transportation in the United States consists primarily of freight shipments, while passenger service, once a large and vital part of the nation's passenger transportation network, plays a limited role as compared to transportation patterns in many other countries.
Freight Railroads:
Main article: Rail freight transport
Freight railroads play an important role in the U.S. economy, especially for moving imports and exports using containers, and for shipments of coal and oil. According to the British news magazine The Economist, "They are universally recognised in the industry as the best in the world." Productivity rose 172% between 1981 and 2000, while rates decreased by 55% (after accounting for inflation). Rail's share of the American freight market rose to 43%, the highest for any rich country.
U.S. railroads still play a major role in the nation's freight shipping. They carried 750 billion ton-miles by 1975 which doubled to 1.5 trillion ton-miles in 2005. In the 1950s, the U.S. and Europe moved roughly the same percentage of freight by rail; by 2000, the share of U.S. rail freight was 38% while in Europe only 8% of freight traveled by rail.
In 2000, while U.S. trains moved 2,390 billion ton-kilometers of freight, the 15-nation European Union moved only 304 billion ton-kilometers of freight. In terms of ton-miles, railroads annually move more than 25% of the United States' freight and connect businesses with each other across the country and with markets overseas.
U.S. freight railroads are separated into three classes, set by the Surface Transportation Board, based on annual revenues:
In 2013, the U.S. moved more oil out of North Dakota by rail than by the Trans-Alaska pipeline. This trend—tenfold in two years and 40-fold in five years—is forecast to increase.
Classes of freight railroads:
There are four different classes of freight railroads: Class I, regional, local line haul, and switching & terminal. Class I railroads are defined as those with revenue of at least $346.8 million in 2006. They comprise just one percent of the number of freight railroads, but account for 67 percent of the industry's mileage, 90 percent of its employees, and 93 percent of its freight revenue.
A regional railroad is a line haul railroad with at least 350 miles (560 km) and/or revenue between $40 million and the Class I threshold. There were 33 regional railroads in 2006. Most have between 75 and 500 employees.
Local line haul railroads operate less than 350 miles (560 km) and earn less than $40 million per year (most earn less than $5 million per year). In 2006, there were 323 local line haul railroads. They generally perform point-to-point service over short distances.
Switching and terminal (S&T) carriers are railroads that primarily provide switching and/or terminal services, regardless of revenue. They perform pick up and delivery services within a certain area.
Traffic and public benefits:
U.S. freight railroads operate in a highly competitive marketplace. To compete effectively against each other and against other transportation providers, railroads must offer high-quality service at competitive rates. In 2011, within the U.S., railroads carried 39.9% of freight by ton-mile, followed by trucks (33.4%), oil pipelines (14.3%), barges (12%) and air (0.3%).
However, railroads' revenue share has been slowly falling for decades, a reflection of the intensity of the competition they face and of the large rate reductions railroads have passed through to their customers over the years.
North American railroads operated 1,471,736 freight cars and 31,875 locomotives, with 215,985 employees. They originated 39.53 million carloads (averaging 63 tons each) and generated $81.7 billion in freight revenue of present 2014. The average haul was 917 miles.
The largest (Class 1) U.S. railroads carried 10.17 million intermodal containers and 1.72 million piggyback trailers. Intermodal traffic was 6.2% of tonnage originated and 12.6% of revenue. The largest commodities were coal, chemicals, farm products, nonmetallic minerals and intermodal.
Other major commodities carried include lumber, automobiles, and waste materials. Coal alone was 43.3% of tonnage and 24.7% of revenue. Coal accounted for roughly half of U.S. electricity generation and was a major export. As natural gas became cheaper than coal, coal supplies dropped 11% in 2015 but coal rail freight dropped by up to 40%, allowing an increase in car transport by rail, some in tri-level railcars.
The fastest growing rail traffic segment is currently intermodal. Intermodal is the movement of shipping containers or truck trailers by rail and at least one other mode of transportation, usually trucks or ocean-going vessels. Intermodal combines the door-to-door convenience of trucks with the long-haul economy of railroads. Rail intermodal has tripled in the last 25 years. It plays a critical role in making logistics far more efficient for retailers and others.
The efficiency of intermodal provides the U.S. with a huge competitive advantage in the global economy.
Freight rail working with passenger rail:
Prior to Amtrak's creation in 1970, intercity passenger rail service in the U.S. was provided by the same companies that provided freight service. When Amtrak was formed, in return for government permission to exit the passenger rail business, freight railroads donated passenger equipment to Amtrak and helped it get started with a capital infusion of some $200 million.
The vast majority of the 22,000 or so miles over which Amtrak operates are actually owned by freight railroads. By law, freight railroads must grant Amtrak access to their track upon request. In return, Amtrak pays fees to freight railroads to cover the incremental costs of Amtrak's use of freight railroad tracks.
Passenger Railroads:
For routes and operators, see Amtrak, Alaska Railroad, and List of rail transit systems in the United States.
The sole intercity passenger railroad in the continental U.S. is Amtrak. Commuter rail systems exist in more than a dozen metropolitan areas, but these systems are not extensively interconnected, so commuter rail cannot be used alone to traverse the country.
Commuter systems have been proposed in approximately two dozen other cities, but interplays between various local-government administrative bottlenecks and ripple effects from the 2007–2012 global financial crisis have generally pushed such projects farther and farther into the future, or have even sometimes mothballed them entirely.
The most culturally notable and physically evident exception to the general lack of significant passenger rail transport in the U.S. is the Northeast Corridor between Washington, Baltimore, Philadelphia, New York City, and Boston, with significant branches in Connecticut and Massachusetts. The corridor handles frequent passenger service that is both Amtrak and commuter.
New York City itself is noteworthy for high usage of passenger rail transport, both subway and commuter rail (Long Island Rail Road, Metro-North Railroad, New Jersey Transit).
The subway system is used by one third of all U.S. mass transit users. Other major cities with substantial rail infrastructure include Boston's MBTA, Philadelphia's SEPTA, and Chicago's elevated system and commuter rail system Metra. The commuter rail systems of San Diego and Los Angeles, Coaster and Metrolink, connect in Oceanside, California.
Privately run new inter-city passenger rail operations are under development. Brightline is a higher-speed rail train, run by All Aboard Florida. It began service in January 2018 between Fort Lauderdale and West Palm Beach, with eventual connections to Miami and Orlando.
Iowa Pacific is seeking to operate Eastern Flyer, a passenger train between Oklahoma City and Tulsa. This would be the first passenger trains to serve Tulsa since 1967. Iowa Pacific operated test runs on the route in 2014.
Car types:
The basic design of a passenger car was standardized by 1870. By 1900 the main car types were: baggage, coach, combine, diner, dome car, lounge, observation, private, Pullman, railroad post office (RPO) and sleeper.
19th century: First passenger cars and early development:
Main article: Passenger car (rail)
The first passenger cars in the resembled stagecoaches. They were short, often less than 10 ft (3.05 m) long, tall and rode on a single pair of axles.
American mail cars first appeared in the 1860s and at first followed English design. They had a hook that would catch the mailbag in its crook.
As locomotive technology progressed in the mid-19th century, trains grew in length and weight. Passenger cars grew along with them, first getting longer with the addition of a second truck (one at each end), and wider as their suspensions improved. Cars built for European use featured side door compartments, while American car design favored a single pair of doors at one end of the car in the car's vestibule; compartmentized cars on American railroads featured a long hallway with doors from the hall to the compartments.
One possible reason for this difference in design principles between American and European carbuilding practice could be the average distance between stations on the two continents.
While most European railroads connected towns and villages that were still very closely spaced, American railroads had to travel over much greater distances to reach their destinations. Building passenger cars with a long passageway through the length of the car allowed the passengers easy access to the restroom, among other things, on longer journeys.
Dining cars first appeared in the late 1870s and into the 1880s. Until this time, the common practice was to stop for meals at restaurants along the way (which led to the rise of Fred Harvey's chain of Harvey House restaurants in America). At first, the dining car was simply a place to serve meals that were picked up en route, but they soon evolved to include galleys in which the meals were prepared.
1900–1950: Lighter materials, new car types:
By the 1920s, passenger cars on the larger standard gauge railroads were normally between 60 and 70 feet (18 and 21 m) long. The cars of this time were still quite ornate, many of them being built by experienced coach makers and skilled carpenters.
With the 1930s came the widespread use of stainless steel for car bodies. The typical passenger car was now much lighter than its "heavyweight" wood cousins of old. The new "lightweight" and streamlined cars carried passengers in speed and comfort to an extent that had not been experienced to date.
Aluminum and Cor-ten were also used in lightweight car construction, but stainless steel was the preferred material for car bodies. It is not the lightest of materials, nor is it the least expensive, but stainless steel cars could be, and often were, left unpainted except for the car's reporting markers that were required by law.
By the end of the 1930s, railroads and carbuilders were debuting carbody and interior styles that could only be dreamed of before. In 1937, the Pullman Company delivered the first cars equipped with roomettes—that is, the car's interior was sectioned off into compartments, much like the coaches that were still in widespread use across Europe. Pullman's roomettes, however, were designed with the single traveler in mind.
The roomette featured a large picture window, a privacy door, a single fold-away bed, a sink and small toilet. The roomette's floor space was barely larger than the space taken up by the bed, but it allowed the traveler to ride in luxury compared to the multilevel semiprivate berths of old.
Now that passenger cars were lighter, they were able to carry heavier loads, but the size of the average passenger load that rode in them didn't increase to match the cars' new capacities.
The average passenger car couldn't get any wider or longer due to side clearances along the railroad lines, but they generally could get taller because they were still shorter than many freight cars and locomotives. As a result, the railroads soon began building and buying dome and bilevel cars to carry more passengers.
1950–present: High-technology advancements:
Carbody styles have generally remained consistent since the middle of the 20th century. While new car types have not made much of an impact, the existing car types have been further enhanced with new technology.
Starting in the 1950s, the passenger travel market declined in North America, though there was growth in commuter rail. The higher clearances in North America enabled bi-level commuter coaches that could hold more passengers. These cars started to become common in the United States in the 1960s.
While intercity passenger rail travel declined in the United States during the 1950s, ridership continued to increase in Europe during that time. With the increase came newer technology on existing and new equipment.
The Spanish company Talgo began experimenting in the 1940s with technology that would enable the axles to steer into a curve, allowing the train to move around the curve at a higher speed. The steering axles evolved into mechanisms that would also tilt the passenger car as it entered a curve to counter the centrifugal force experienced by the train, further increasing speeds on existing track.
Today, tilting passenger trains are commonplace. Talgo's trains are used on some short and medium distance routes such as Amtrak Cascades from Eugene, Oregon, to Vancouver, British Columbia.
In August 2016, the Department of Transportation approved the largest loan in the department's history, $2.45 billion to upgrade the passenger train service in the Northeast region. The $2.45 billion will be used to purchase 28 new train sets for the high-speed Acela train between Washington through Philadelphia, New York and into Boston. The money will also be used build new stations and platforms. The money will also be used to rehabilitate railroad tracks and upgrade four stations, including Washington’s Union Station and Baltimore’s Penn Station.
U.S. high-speed rail:
Main article: High-speed rail in the United States
Rolling stock reporting markings:
Every piece of railroad rolling stock operating in North American interchange service is required to carry a standardized set of reporting markings. The marks are made up of a two- to four-letter code identifying the owner of the equipment accompanied by an identification number and statistics on the equipment's capacity and tare (unloaded) weight. Marks whose codes end in X (such as TTGX) are used on equipment owned by entities that are not common carrier railroads themselves.
Marks whose codes end in U are used on containers that are carried in intermodal transport, and marks whose codes end in Z are used on trailers that are carried in inter-modal transport, per ISO standard 6346). Most freight cars carry automatic equipment identification RFID transponders.
Typically, railroads operating in the United States reserve one- to four-digit identification numbers for powered equipment such as diesel locomotives and six-digit identification numbers for unpowered equipment. There is no hard and fast rule for how equipment is numbered; each railroad maintains its own numbering policy for its equipment.
List of major United States railroads:
Main article: List of United States railroads:
Rail link(s) with adjacent countries:
Regulation:
Federal regulation of railroads is mainly through the United States Department of Transportation, especially the Federal Railroad Administration which regulates safety, and the Surface Transportation Board which regulates rates, service, the construction, acquisition and abandonment of rail lines, carrier mergers and interchange of traffic among carriers.
Railroads are also regulated by the individual states, for example through the Massachusetts Department of Public Utilities.
See Also:
Freight Railroads:
Main article: Rail freight transport
Freight railroads play an important role in the U.S. economy, especially for moving imports and exports using containers, and for shipments of coal and oil. According to the British news magazine The Economist, "They are universally recognised in the industry as the best in the world." Productivity rose 172% between 1981 and 2000, while rates decreased by 55% (after accounting for inflation). Rail's share of the American freight market rose to 43%, the highest for any rich country.
U.S. railroads still play a major role in the nation's freight shipping. They carried 750 billion ton-miles by 1975 which doubled to 1.5 trillion ton-miles in 2005. In the 1950s, the U.S. and Europe moved roughly the same percentage of freight by rail; by 2000, the share of U.S. rail freight was 38% while in Europe only 8% of freight traveled by rail.
In 2000, while U.S. trains moved 2,390 billion ton-kilometers of freight, the 15-nation European Union moved only 304 billion ton-kilometers of freight. In terms of ton-miles, railroads annually move more than 25% of the United States' freight and connect businesses with each other across the country and with markets overseas.
U.S. freight railroads are separated into three classes, set by the Surface Transportation Board, based on annual revenues:
- Class I for freight railroads with annual operating revenues above $346.8 million in 2006 dollars. In 1900, there were 132 Class I railroads. Today, as the result of mergers, bankruptcies, and major changes in the regulatory definition of "Class I", there are only seven railroads operating in the United States that meet the criteria for Class I. As of 2011, U.S. freight railroads operated 139,679 route-miles (224,792 km) of standard gauge in the U.S. Although Amtrak qualifies for Class I status under the revenue criteria, it is not considered a Class I railroad because it is not a freight railroad.
- Class II for freight railroads with revenues between $27.8 million and $346.7 million in 2000 dollars
- Class III for all other freight revenues.
In 2013, the U.S. moved more oil out of North Dakota by rail than by the Trans-Alaska pipeline. This trend—tenfold in two years and 40-fold in five years—is forecast to increase.
Classes of freight railroads:
There are four different classes of freight railroads: Class I, regional, local line haul, and switching & terminal. Class I railroads are defined as those with revenue of at least $346.8 million in 2006. They comprise just one percent of the number of freight railroads, but account for 67 percent of the industry's mileage, 90 percent of its employees, and 93 percent of its freight revenue.
A regional railroad is a line haul railroad with at least 350 miles (560 km) and/or revenue between $40 million and the Class I threshold. There were 33 regional railroads in 2006. Most have between 75 and 500 employees.
Local line haul railroads operate less than 350 miles (560 km) and earn less than $40 million per year (most earn less than $5 million per year). In 2006, there were 323 local line haul railroads. They generally perform point-to-point service over short distances.
Switching and terminal (S&T) carriers are railroads that primarily provide switching and/or terminal services, regardless of revenue. They perform pick up and delivery services within a certain area.
Traffic and public benefits:
U.S. freight railroads operate in a highly competitive marketplace. To compete effectively against each other and against other transportation providers, railroads must offer high-quality service at competitive rates. In 2011, within the U.S., railroads carried 39.9% of freight by ton-mile, followed by trucks (33.4%), oil pipelines (14.3%), barges (12%) and air (0.3%).
However, railroads' revenue share has been slowly falling for decades, a reflection of the intensity of the competition they face and of the large rate reductions railroads have passed through to their customers over the years.
North American railroads operated 1,471,736 freight cars and 31,875 locomotives, with 215,985 employees. They originated 39.53 million carloads (averaging 63 tons each) and generated $81.7 billion in freight revenue of present 2014. The average haul was 917 miles.
The largest (Class 1) U.S. railroads carried 10.17 million intermodal containers and 1.72 million piggyback trailers. Intermodal traffic was 6.2% of tonnage originated and 12.6% of revenue. The largest commodities were coal, chemicals, farm products, nonmetallic minerals and intermodal.
Other major commodities carried include lumber, automobiles, and waste materials. Coal alone was 43.3% of tonnage and 24.7% of revenue. Coal accounted for roughly half of U.S. electricity generation and was a major export. As natural gas became cheaper than coal, coal supplies dropped 11% in 2015 but coal rail freight dropped by up to 40%, allowing an increase in car transport by rail, some in tri-level railcars.
The fastest growing rail traffic segment is currently intermodal. Intermodal is the movement of shipping containers or truck trailers by rail and at least one other mode of transportation, usually trucks or ocean-going vessels. Intermodal combines the door-to-door convenience of trucks with the long-haul economy of railroads. Rail intermodal has tripled in the last 25 years. It plays a critical role in making logistics far more efficient for retailers and others.
The efficiency of intermodal provides the U.S. with a huge competitive advantage in the global economy.
Freight rail working with passenger rail:
Prior to Amtrak's creation in 1970, intercity passenger rail service in the U.S. was provided by the same companies that provided freight service. When Amtrak was formed, in return for government permission to exit the passenger rail business, freight railroads donated passenger equipment to Amtrak and helped it get started with a capital infusion of some $200 million.
The vast majority of the 22,000 or so miles over which Amtrak operates are actually owned by freight railroads. By law, freight railroads must grant Amtrak access to their track upon request. In return, Amtrak pays fees to freight railroads to cover the incremental costs of Amtrak's use of freight railroad tracks.
Passenger Railroads:
For routes and operators, see Amtrak, Alaska Railroad, and List of rail transit systems in the United States.
The sole intercity passenger railroad in the continental U.S. is Amtrak. Commuter rail systems exist in more than a dozen metropolitan areas, but these systems are not extensively interconnected, so commuter rail cannot be used alone to traverse the country.
Commuter systems have been proposed in approximately two dozen other cities, but interplays between various local-government administrative bottlenecks and ripple effects from the 2007–2012 global financial crisis have generally pushed such projects farther and farther into the future, or have even sometimes mothballed them entirely.
The most culturally notable and physically evident exception to the general lack of significant passenger rail transport in the U.S. is the Northeast Corridor between Washington, Baltimore, Philadelphia, New York City, and Boston, with significant branches in Connecticut and Massachusetts. The corridor handles frequent passenger service that is both Amtrak and commuter.
New York City itself is noteworthy for high usage of passenger rail transport, both subway and commuter rail (Long Island Rail Road, Metro-North Railroad, New Jersey Transit).
The subway system is used by one third of all U.S. mass transit users. Other major cities with substantial rail infrastructure include Boston's MBTA, Philadelphia's SEPTA, and Chicago's elevated system and commuter rail system Metra. The commuter rail systems of San Diego and Los Angeles, Coaster and Metrolink, connect in Oceanside, California.
Privately run new inter-city passenger rail operations are under development. Brightline is a higher-speed rail train, run by All Aboard Florida. It began service in January 2018 between Fort Lauderdale and West Palm Beach, with eventual connections to Miami and Orlando.
Iowa Pacific is seeking to operate Eastern Flyer, a passenger train between Oklahoma City and Tulsa. This would be the first passenger trains to serve Tulsa since 1967. Iowa Pacific operated test runs on the route in 2014.
Car types:
The basic design of a passenger car was standardized by 1870. By 1900 the main car types were: baggage, coach, combine, diner, dome car, lounge, observation, private, Pullman, railroad post office (RPO) and sleeper.
19th century: First passenger cars and early development:
Main article: Passenger car (rail)
The first passenger cars in the resembled stagecoaches. They were short, often less than 10 ft (3.05 m) long, tall and rode on a single pair of axles.
American mail cars first appeared in the 1860s and at first followed English design. They had a hook that would catch the mailbag in its crook.
As locomotive technology progressed in the mid-19th century, trains grew in length and weight. Passenger cars grew along with them, first getting longer with the addition of a second truck (one at each end), and wider as their suspensions improved. Cars built for European use featured side door compartments, while American car design favored a single pair of doors at one end of the car in the car's vestibule; compartmentized cars on American railroads featured a long hallway with doors from the hall to the compartments.
One possible reason for this difference in design principles between American and European carbuilding practice could be the average distance between stations on the two continents.
While most European railroads connected towns and villages that were still very closely spaced, American railroads had to travel over much greater distances to reach their destinations. Building passenger cars with a long passageway through the length of the car allowed the passengers easy access to the restroom, among other things, on longer journeys.
Dining cars first appeared in the late 1870s and into the 1880s. Until this time, the common practice was to stop for meals at restaurants along the way (which led to the rise of Fred Harvey's chain of Harvey House restaurants in America). At first, the dining car was simply a place to serve meals that were picked up en route, but they soon evolved to include galleys in which the meals were prepared.
1900–1950: Lighter materials, new car types:
By the 1920s, passenger cars on the larger standard gauge railroads were normally between 60 and 70 feet (18 and 21 m) long. The cars of this time were still quite ornate, many of them being built by experienced coach makers and skilled carpenters.
With the 1930s came the widespread use of stainless steel for car bodies. The typical passenger car was now much lighter than its "heavyweight" wood cousins of old. The new "lightweight" and streamlined cars carried passengers in speed and comfort to an extent that had not been experienced to date.
Aluminum and Cor-ten were also used in lightweight car construction, but stainless steel was the preferred material for car bodies. It is not the lightest of materials, nor is it the least expensive, but stainless steel cars could be, and often were, left unpainted except for the car's reporting markers that were required by law.
By the end of the 1930s, railroads and carbuilders were debuting carbody and interior styles that could only be dreamed of before. In 1937, the Pullman Company delivered the first cars equipped with roomettes—that is, the car's interior was sectioned off into compartments, much like the coaches that were still in widespread use across Europe. Pullman's roomettes, however, were designed with the single traveler in mind.
The roomette featured a large picture window, a privacy door, a single fold-away bed, a sink and small toilet. The roomette's floor space was barely larger than the space taken up by the bed, but it allowed the traveler to ride in luxury compared to the multilevel semiprivate berths of old.
Now that passenger cars were lighter, they were able to carry heavier loads, but the size of the average passenger load that rode in them didn't increase to match the cars' new capacities.
The average passenger car couldn't get any wider or longer due to side clearances along the railroad lines, but they generally could get taller because they were still shorter than many freight cars and locomotives. As a result, the railroads soon began building and buying dome and bilevel cars to carry more passengers.
1950–present: High-technology advancements:
Carbody styles have generally remained consistent since the middle of the 20th century. While new car types have not made much of an impact, the existing car types have been further enhanced with new technology.
Starting in the 1950s, the passenger travel market declined in North America, though there was growth in commuter rail. The higher clearances in North America enabled bi-level commuter coaches that could hold more passengers. These cars started to become common in the United States in the 1960s.
While intercity passenger rail travel declined in the United States during the 1950s, ridership continued to increase in Europe during that time. With the increase came newer technology on existing and new equipment.
The Spanish company Talgo began experimenting in the 1940s with technology that would enable the axles to steer into a curve, allowing the train to move around the curve at a higher speed. The steering axles evolved into mechanisms that would also tilt the passenger car as it entered a curve to counter the centrifugal force experienced by the train, further increasing speeds on existing track.
Today, tilting passenger trains are commonplace. Talgo's trains are used on some short and medium distance routes such as Amtrak Cascades from Eugene, Oregon, to Vancouver, British Columbia.
In August 2016, the Department of Transportation approved the largest loan in the department's history, $2.45 billion to upgrade the passenger train service in the Northeast region. The $2.45 billion will be used to purchase 28 new train sets for the high-speed Acela train between Washington through Philadelphia, New York and into Boston. The money will also be used build new stations and platforms. The money will also be used to rehabilitate railroad tracks and upgrade four stations, including Washington’s Union Station and Baltimore’s Penn Station.
U.S. high-speed rail:
Main article: High-speed rail in the United States
Rolling stock reporting markings:
Every piece of railroad rolling stock operating in North American interchange service is required to carry a standardized set of reporting markings. The marks are made up of a two- to four-letter code identifying the owner of the equipment accompanied by an identification number and statistics on the equipment's capacity and tare (unloaded) weight. Marks whose codes end in X (such as TTGX) are used on equipment owned by entities that are not common carrier railroads themselves.
Marks whose codes end in U are used on containers that are carried in intermodal transport, and marks whose codes end in Z are used on trailers that are carried in inter-modal transport, per ISO standard 6346). Most freight cars carry automatic equipment identification RFID transponders.
Typically, railroads operating in the United States reserve one- to four-digit identification numbers for powered equipment such as diesel locomotives and six-digit identification numbers for unpowered equipment. There is no hard and fast rule for how equipment is numbered; each railroad maintains its own numbering policy for its equipment.
List of major United States railroads:
Main article: List of United States railroads:
- Amtrak
- BNSF Railway
- Canadian National Railway
- Canadian Pacific Railway
- CSX Transportation
- Kansas City Southern Railway
- Norfolk Southern Railway
- Union Pacific Railroad
Rail link(s) with adjacent countries:
- Canada – yes – Same gauge 4 ft 8 1⁄2 in (1,435 mm) (none via Alaska)
- Mexico – yes – Same gauge 4 ft 8 1⁄2 in
- Russia – no – proposed via Bering Strait crossing, a massive investment and break of gauge from 4 ft 11 27⁄32 in (1,520 mm) to 4 ft 8 1⁄2 in would be required
Regulation:
Federal regulation of railroads is mainly through the United States Department of Transportation, especially the Federal Railroad Administration which regulates safety, and the Surface Transportation Board which regulates rates, service, the construction, acquisition and abandonment of rail lines, carrier mergers and interchange of traffic among carriers.
Railroads are also regulated by the individual states, for example through the Massachusetts Department of Public Utilities.
See Also:
- History
- Federal Employers Liability Act (protects and compensates railroad employees)
- List of rail transit systems in the United States
- Nationalized Industries in the United States
- Oldest railroads in North America
- Railroad car – general overview of all car types in use
- Timeline of United States railway history
- Transportation in the United States
- Railroad History Bibliography by Richard Jensen, Montana State University
- Future rail transport map released by the FRA
- USA by Rail guide book
History of Transportation including a Timeline
YouTube Video About the History of Automobiles
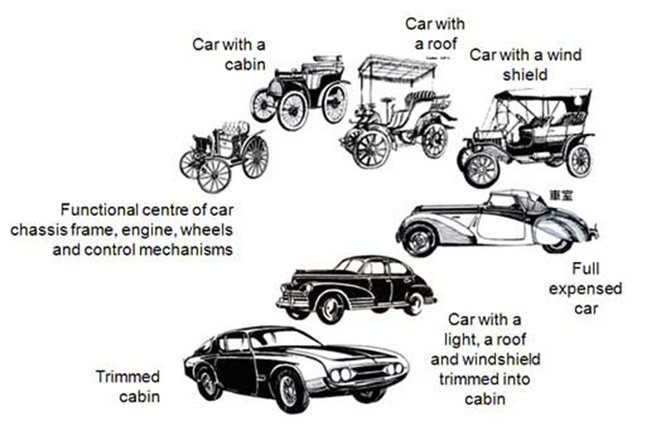
Pictured below: the Evolution of Autos over Time.
Click on any of the following blue hyperlinks for amplification about each of Five modes of Transportation:
History of Road Transport:
Main article: History of road transport
The first earth tracks were created by humans carrying goods and often followed trails. Tracks would be naturally created at points of high traffic density. As animals were domesticated, horses, oxen and donkeys became an element in track-creation.
With the growth of trade, tracks were often flattened or widened to accommodate animal traffic. Later, the travois, a frame used to drag loads, was developed. Animal-drawn wheeled vehicles were probably developed in the Ancient Near East in the 4th or 5th millennium BC and spread to Europe and India in the 4th millennium BC and China in about 1200 BC.
The Romans had a significant need for good roads to extend and maintain their empire and developed Roman roads.
In the Industrial Revolution, John Loudon McAdam (1756–1836) designed the first modern highways, using inexpensive paving material of soil and stone aggregate (macadam), and he embanked roads a few feet higher than the surrounding terrain to cause water to drain away from the surface.
With the development of motor transport there was an increased need for hard-topped roads to reduce washaways, bogging and dust on both urban and rural roads, originally using cobblestones and wooden paving in major western cities and in the early 20th century tar-bound macadam (tarmac) and concrete paving were extended into the countryside.
The modern history of road transport also involves the development of new vehicles such as new models of horse-drawn vehicles, bicycles, motor cars, motor trucks and electric vehicles.
___________________________________________________________________________
History of Railways
YouTube Video: American Railroads in 1957 - freight & passenger trains documentary film
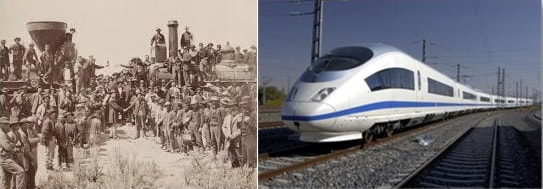
Pictured: (L) Ceremony for the completion of the First Transcontinental Railroad, May 1869 (R) Today’s Passenger Railway
History of Road Transport:
Main article: History of road transport
The first earth tracks were created by humans carrying goods and often followed trails. Tracks would be naturally created at points of high traffic density. As animals were domesticated, horses, oxen and donkeys became an element in track-creation.
With the growth of trade, tracks were often flattened or widened to accommodate animal traffic. Later, the travois, a frame used to drag loads, was developed. Animal-drawn wheeled vehicles were probably developed in the Ancient Near East in the 4th or 5th millennium BC and spread to Europe and India in the 4th millennium BC and China in about 1200 BC.
The Romans had a significant need for good roads to extend and maintain their empire and developed Roman roads.
In the Industrial Revolution, John Loudon McAdam (1756–1836) designed the first modern highways, using inexpensive paving material of soil and stone aggregate (macadam), and he embanked roads a few feet higher than the surrounding terrain to cause water to drain away from the surface.
With the development of motor transport there was an increased need for hard-topped roads to reduce washaways, bogging and dust on both urban and rural roads, originally using cobblestones and wooden paving in major western cities and in the early 20th century tar-bound macadam (tarmac) and concrete paving were extended into the countryside.
The modern history of road transport also involves the development of new vehicles such as new models of horse-drawn vehicles, bicycles, motor cars, motor trucks and electric vehicles.
___________________________________________________________________________
History of Railways
YouTube Video: American Railroads in 1957 - freight & passenger trains documentary film
Pictured: (L) Ceremony for the completion of the First Transcontinental Railroad, May 1869 (R) Today’s Passenger Railway
Main article: History of rail transport
The history of rail transportation dates back nearly 500 years, and includes systems with man or horse power and rails of wood (or occasionally stone). This was usually for moving coal from the mine down to a river, from where it could continue by boat, with a flanged wheel running on a rail.
The use of cast iron plates as rails began in the 1760s, and was followed by systems (plateways) where the flange was part of the rail. However, with the introduction of rolled wrought iron rails, these became obsolete.
Modern rail transport systems first appeared in England in the 1820s. These systems, which made use of the steam locomotive, were the first practical form of mechanized land transport, and they remained the primary form of mechanized land transport for the next 100 years.
The history of rail transport also includes the history of rapid transit and arguably monorail history.
___________________________________________________________________________
History of Water Transportation
YouTube Video of WORLD'S LARGEST CRUISE LINER- Independence of the Seas Full Documentary
YouTube Video: Going through the Panama Canal*
* -- Panama Canal
Pictured Below: Big set of sea ships. Water carriage and maritime transport in flat design style. Side view vector illustration.

Main article: Maritime history
In the stone ages primitive boats developed to permit navigation of rivers and for fishing in rivers and off the coast.
It has been argued that boats suitable for a significant sea crossing were necessary for people to reach Australia an estimated 40,000-45,000 years ago. With the development of civilization, vessels evolved for expansion and generally grew in size for trade and war.
In the Mediterranean, galleys were developed about 3000 BC. Polynesian double-hulled sailing vessels with advanced rigging were used between 1,300 BC and 900 BC by the Polynesian progeny of the Lapita culture to expand 6,000 km across open ocean from the Bismarck Archipelago east to Micronesia and, eventually Hawaii.
Galleys were eventually rendered obsolete by ocean-going sailing ships, such as the Arabic caravel in the 13th century, the Chinese treasure ship in the early 15th century, and the Mediterranean man-of-war in the late 15th century.
In the Industrial Revolution, the first steamboats and later diesel-powered ships were developed. Eventually submarines were developed mainly for military purposes for people's general benefit.
Meanwhile, specialized craft were developed for river and canal transport. Canals were developed in Mesopotamia c. 4000 BC. The Indus Valley Civilization in Pakistan and North India (from c. 2600 BC) had the first canal irrigation system in the world.
The longest canal of ancient times was the Grand Canal of China. is 1,794 kilometers (1,115 mi) long and was built to carry the Emperor Yang Guang between Beijing and Hangzhou. The project began in 605, although the oldest sections of the canal may have existed since c. 486 BC. Canals were developed in the Middle Ages in Europe in Venice and the Netherlands.
Pierre-Paul Riquet began to organize the construction of the 240 km-long Canal du Midi in France in 1665 and it was opened in 1681. In the Industrial Revolution, inland canals were built in England and later the United States before the development of railways.
Specialized craft were also developed for fishing and later whaling. Ramps for water were made in 1459.
Maritime history also deals with the development of navigation, oceanography, cartography and hydrography.
___________________________________________________________________________
History of Aviation
YouTube Video of How air transportation connects the world (by MIT)
YouTube Video: Types of Air Transport
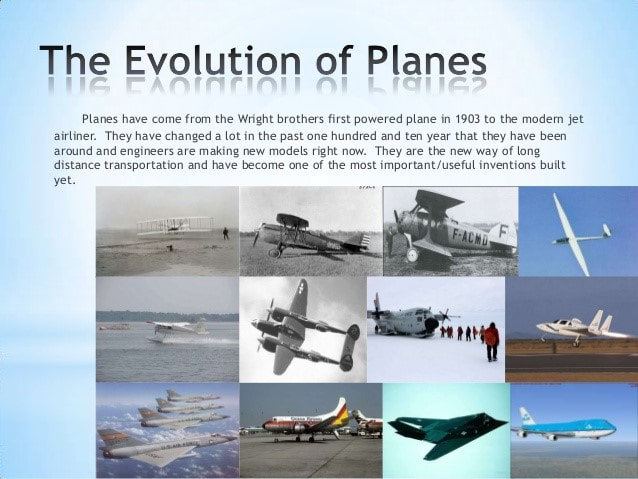
Main article: Aviation history
Aviation started with the invention of Santos Dummont, Brazilian born scientist, who created the 14BIS and the very first motor powered airplanes in the world .
Humanity's desire to fly likely dates to the first time man observed birds, an observation illustrated in the legendary stories of Daedalus and Icarus in Greek mythology, and the Vimanas in Indian mythology. Much of the focus of early research was on imitating birds, but through trial-and-error, balloons, airships, gliders and eventually powered aircraft and other types of flying machines were invented.
Kites were the first form of man-made flying objects, and early records suggest that kites were around before 200 BC in China.
Leonardo da Vinci's dream of flight found expression in several designs, but he did not attempt to demonstrate flight by literally constructing them.
During the 17th and 18th century, when scientists began analyzing the Earth's atmosphere, gases such as hydrogen were discovered which in turn led to the invention of hydrogen balloons.
Various theories in mechanics by physicists during the same period of time—notably fluid dynamics and Newton's laws of motion—led to the foundation of modern aerodynamics.
Tethered balloons filled with hot air were used in the first half of the 19th century and saw considerable action in several mid-century wars, most notably the American Civil War, where balloons provided observation during the Siege of Petersburg.
___________________________________________________________________________
History of Space Flight
YouTube Video of John Glenn's historic space flight (1962)
YouTube Video of Neil Armstrong - First Moon Landing 1969
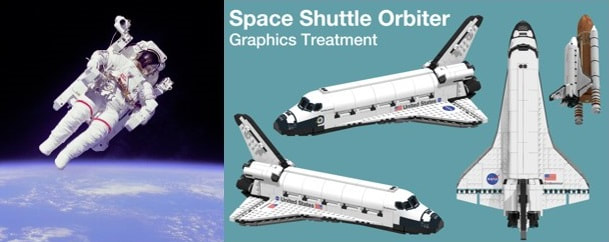
Main article: History of spaceflight
See also: Space Age
The realistic dream of spaceflight dated back to Konstantin Tsiolkovsky, however Tsiolkovsky wrote in Russian, and this was not widely influential outside Russia.
Spaceflight became an engineering possibility with the work of Robert H. Goddard's publication in 1919 of his paper 'A Method of Reaching Extreme Altitudes'; where his application of the de Laval nozzle to liquid-propellant rockets gave sufficient power that interplanetary travel became possible. This paper was highly influential on Hermann Oberth and Wernher von Braun, later key players in spaceflight.
The first human spaceflight was achieved with the Soviet space program's Vostok 1 mission in 1961. The lead architects behind the mission were Sergei Korolev and Kerim Kerimov, with Yuri Gagarin being the first astronaut.
Kerimov later went on to launch the first space docks (Kosmos 186 and Kosmos 188) in 1967 and the first space stations (Salyut and Mir series) from 1971 to 1991.
The first spaceflight to the Moon was achieved with NASA's Apollo 11 mission in 1969, with Neil Armstrong and Buzz Aldrin being the first astronauts on the Moon.
___________________________________________________________________________
See also the following about the History of Transportation:
- Medieval transport
- Timeline of artificial satellites and space probes
- Timeline of aviation
- Timeline of diving technology
- Timeline of jet power
- Timeline of transportation technology
Transportation Technology including its Timeline
YouTube Video: Top 5 future car tech innovations by C/Net
Pictured: Today’s Transportation Technology includes (L) The Boeing 787 Dreamliner; (R) A Bay Area Rapid Transit (BART) train travels towards downtown San Francisco, CA
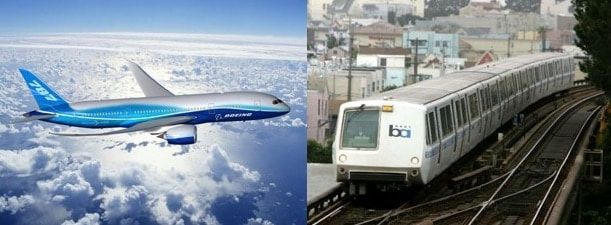
Transport or transportation is the movement of people, animals and goods from one location to another. Modes of transport include:
The field can be divided into infrastructure, vehicles and operations. Transport is important because it enables trade between people, which is essential for the development of civilizations.
Transport infrastructure consists of the fixed installations including:
Terminals include:
Terminals may be used both for interchange of passengers and cargo and for maintenance.
Vehicles traveling on these networks may include:
Operations deal with the way the vehicles are operated, and the procedures set for this purpose including financing, legalities and policies. In the transport industry, operations and ownership of infrastructure can be either public or private, depending on the country and mode.
Passenger transport may be public, where operators provide scheduled services, or private.
Freight transport has become focused on containerization, although bulk transport is used for large volumes of durable items.
Transport plays an important part in economic growth and globalization, but most types cause air pollution and use large amounts of land. While it is heavily subsidized by governments, good planning of transport is essential to make traffic flow and restrain urban sprawl.
Click on the following blue hyperlinks for the Timeline of Transportation Technology:
The field can be divided into infrastructure, vehicles and operations. Transport is important because it enables trade between people, which is essential for the development of civilizations.
Transport infrastructure consists of the fixed installations including:
Terminals include:
- airports,
- railway stations,
- bus stations,
- warehouses,
- trucking terminals,
- refueling depots (including fueling docks and fuel stations)
- and seaports.
Terminals may be used both for interchange of passengers and cargo and for maintenance.
Vehicles traveling on these networks may include:
- automobiles,
- bicycles,
- buses,
- trains,
- trucks,
- people,
- helicopters,
- watercraft,
- spacecraft
- and aircraft.
Operations deal with the way the vehicles are operated, and the procedures set for this purpose including financing, legalities and policies. In the transport industry, operations and ownership of infrastructure can be either public or private, depending on the country and mode.
Passenger transport may be public, where operators provide scheduled services, or private.
Freight transport has become focused on containerization, although bulk transport is used for large volumes of durable items.
Transport plays an important part in economic growth and globalization, but most types cause air pollution and use large amounts of land. While it is heavily subsidized by governments, good planning of transport is essential to make traffic flow and restrain urban sprawl.
Click on the following blue hyperlinks for the Timeline of Transportation Technology:
Aviation Including a List of Aviation Pioneers
YouTube Video: The New Boeing 737 MAX 10
YouTube Video: Building the Boeing 777
Pictured below( Clockwise from Upper Left): The Wright Brothers; Charles Lindbergh; Amelia Earhart; and the Boeing 747 Jumbo Jet
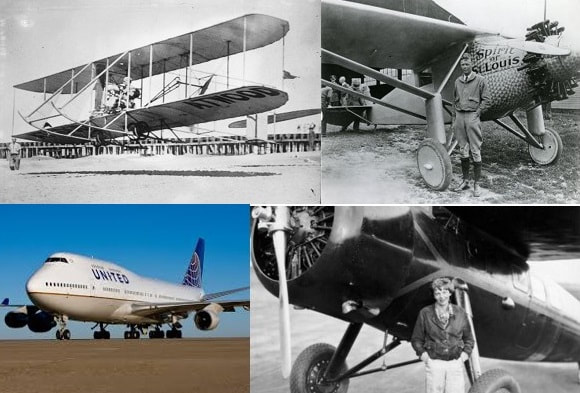
Click here for a list of Aviation Pioneers.
Aviation, or air transport, refers to the activities surrounding mechanical flight and the aircraft industry.
Aircraft includes fixed-wing and rotary-wing types, morphable wings, wing-less lifting bodies, as well as lighter-than-air craft such as balloons and airships.
Aviation began in the 18th century with the development of the hot air balloon, an apparatus capable of atmospheric displacement through buoyancy. Some of the most significant advancements in aviation technology came with the controlled gliding flying of Otto Lilienthal in 1896; then a large step in significance came with the construction of the first powered airplane by the Wright brothers in the early 1900s.
Since that time, aviation has been technologically revolutionized by the introduction of the jet which permitted a major form of transport throughout the world.
Click on any of the following blue hyperlinks for more about Aviation:
- Operations of aircraft
- Aviation accidents and incidents
- Air traffic control
- Environmental impact
- See also
Commuter Rail including Light Rail in the United States
YouTube Video: Which City Has the Most Crowded Commuter Trains?
YouTube Video: How to Navigate the New York City Subway System
YouTube Video of the Kingston Trio Singing "The MTA"*
* -- Satire about the Metropolitan Bay Transportation Authority in Boston,MA
Pictured below:
TOP ROW: (L) MBTA Green Line, the most heavily utilized light rail system in the United States, serving Boston; (R) Positive Train Control (PTC) is a rail safety technology being widely implemented across US commuter rail lines to avoid train accidents due to human errors;
BOTTOM ROW: FasPhoto Friday: Commuter Rail Train on the Way
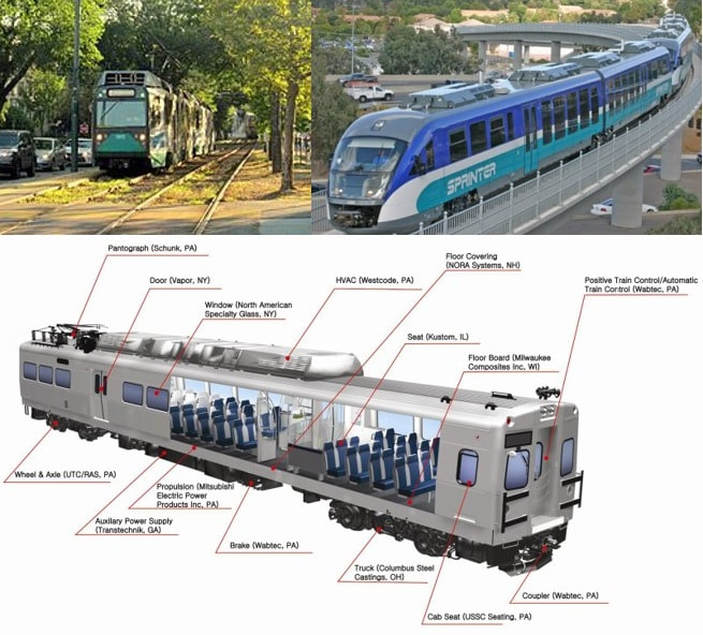
Commuter rail, also called suburban rail, is a passenger rail transport service that primarily operates between a city center and middle to outer suburbs beyond 15 km (10 miles) and commuter towns or other locations that draw large numbers of commuters—people who travel on a daily basis.
Trains operate following a schedule at speeds varying from 50 to 225 km/h (30 to 140 mph). Distance charges or zone pricing may be used.
The development of commuter rail services has become popular today, with the increased public awareness of congestion, dependence on fossil fuels, and other environmental issues, as well as the rising costs of owning, operating and parking automobiles.
Characteristics:
Most commuter (or suburban) trains are built to main line rail standards, differing from light rail or rapid transit (metro rail) systems by:
Train schedule:
Compared to rapid transit (or metro rail), commuter/suburban rail has lower frequency, following a schedule rather than fixed intervals, and fewer stations spaced further apart. They primarily serve lower density suburban areas (non inner-city), and often share right-of-way with intercity or freight trains.
Some services operate only during peak hours and others uses fewer departures during off peak hours and weekends. Average speeds are high, often 50 km/h (30 mph) or higher. These higher speeds better serve the longer distances involved. Some services include express services which skip some stations in order to run faster and separate longer distance riders from short-distance ones.
The general range of commuter trains' distance varies between 15 and 200 km (10 and 125 miles). Sometimes long distances can be explained by that the train runs between two or several cities (e.g. S-Bahn in the Ruhr area of Germany). Distances between stations may vary, but are usually much longer than those of urban rail systems. In city centers the train either has a terminal station or passes through the city center with notably fewer station stops than those of urban rail systems. Toilets are often available on-board trains and in stations.
Track:
Their ability to coexist with freight or intercity services in the same right-of-way can drastically reduce system construction costs. However, frequently they are built with dedicated tracks within that right-of-way to prevent delays, especially where service densities have converged in the inner parts of the network.
Most such trains run on the local standard gauge track. Some systems may run on a narrower or broader gauge.
Some countries and regions, including Finland, India, Pakistan, Russia, Brazil and Sri Lanka, as well as San Francisco (BART) in the USA and Melbourne and Adelaide in Australia, use broad gauge track.
Distinction between other modes of rail:
Metro rail or rapid transit usually covers a smaller inner-urban area ranging outwards to between 12 km to 20 km (or 8 to 14 miles), has a higher train frequency and runs on separate tracks (underground or elevated), whereas commuter rail often shares tracks, technology and the legal framework within mainline railway systems.
However, the classification as a metro or rapid rail can be difficult as both may typically cover a metropolitan area exclusively, run on separate tracks in the centre, and often feature purpose-built rolling stock.
The fact that the terminology is not standardized across countries (even across English-speaking countries) further complicates matters. This distinction is most easily made when there are two (or more) systems such as New York's subway and the LIRR and Metro-North Railroad,
Types of Trains:
Commuter/suburban trains are usually optimized for maximum passenger volume, in most cases without sacrificing too much comfort and luggage space, though they seldom have all the amenities of long-distance trains. Cars may be single- or double-level, and aim to provide seating for all. Compared to intercity trains, they have less space, fewer amenities and limited baggage areas.
Multiple unit type:
Commuter rail trains are usually composed of multiple units, which are self-propelled, bidirectional, articulated passenger rail cars with driving motors on each (or every other) bogie.
Depending on local circumstances and tradition they may be powered either by diesel engines located below the passenger compartment (diesel multiple units) or by electricity picked up from third rails or overhead lines (electric multiple units).
Multiple units are almost invariably equipped with control cabs at both ends, which is why such units are so frequently used to provide commuter services, due to the associated short turn-around time.
Locomotive hauled services:
Locomotive hauled services are used in some countries or locations. This is often a case of asset sweating, by using a single large combined fleet for intercity and regional services. Loco hauled services are usually run in push-pull formation, that is, the train can run with the locomotive at the "front" or "rear" of the train (pushing or pulling).
Trains are often equipped with a control cab at the other end of the train from the locomotive, allowing the train operator to operate the train from either end. The motive power for locomotive-hauled commuter trains may be either electric or Diesel-electric, although some countries, such as Germany and some of the former Soviet-bloc countries, also use diesel-hydraulic locomotives.
Seat plans:
In the USA and some other countries, a three-and-two seat plan is used. However, few people sit in the middle seat on these trains because they feel crowded and uncomfortable.
North America:
Main article: Commuter rail in North America
In the United States, Canada, Costa Rica, El Salvador and Mexico regional passenger rail services are provided by governmental or quasi-governmental agencies, with a limited number of metropolitan areas served.
The six most patronized commuter rail systems in the United States are:
See also: ___________________________________________________________________________
Light rail in the United States:
Light rail is defined in the United States (and elsewhere) as a mode of electrified (or in a few exceptional cases, diesel-powered) rail-based transit, usually urban in nature, which is distinguished by operation in routes of generally exclusive, though not necessarily grade-separated, rights-of-way.
This is distinguished from 'heavy rail' systems, also known as rapid transit or 'metro' (e.g. subway and/or elevated), which are fully grade-separated from other traffic, and which are characterized by higher passenger capacities than light rail.
Arguably, traditional streetcars (also known as trolleys in North America, or as trams outside of North America especially in Europe), which is rail-based transit that takes place in shared roadways with automobile traffic (i.e. with street running) and thus does not operate in exclusive rights-of-way, can be considered to be a sub-set of light rail, though the two modes of transit are often treated as distinct in the United States.
Light rail transit in the United States:
See also: List of United States light rail systems by ridership
According to the American Public Transportation Association, of the 30-odd cities with light rail systems in the United States, the light rail systems in six of them (Boston, Los Angeles, Philadelphia, Portland (Oregon), San Diego, and San Francisco) achieve more than 30 million unlinked passenger transits per year.
The United States has a number of light rail systems in its mid-sized to large cities. In the oldest legacy systems, such as in Boston, Cleveland, Newark, New Orleans, Philadelphia, Pittsburgh, and San Francisco, the light rail is vestigal from the first-generation streetcar systems of the 19th and early 20th centuries, but were spared the fate of other streetcar systems due to these systems having some grade separation from traffic and high ridership.
A number of second-generation light rail systems were inaugurated in the 1980s starting with San Diego in 1981, with a few more built in the 1990s, and many more opened in lower density cities since the early 2000s.
Click on any of the following blue hyperlinks for more about Light Rail Transit in the United States:
Trains operate following a schedule at speeds varying from 50 to 225 km/h (30 to 140 mph). Distance charges or zone pricing may be used.
The development of commuter rail services has become popular today, with the increased public awareness of congestion, dependence on fossil fuels, and other environmental issues, as well as the rising costs of owning, operating and parking automobiles.
Characteristics:
Most commuter (or suburban) trains are built to main line rail standards, differing from light rail or rapid transit (metro rail) systems by:
- being larger
- providing more seating and less standing room, owing to the longer distances involved
- having (in most cases) a lower frequency of service
- having scheduled services (i.e. trains run at specific times rather than at specific intervals)
- serving lower-density suburban areas, typically connecting suburbs to the city center
- sharing track or right-of-way with intercity or freight trains
- not fully grade separated (containing at-grade crossings with crossing gates)
- being able to skip certain stations as an express service due to normally being driver controlled
Train schedule:
Compared to rapid transit (or metro rail), commuter/suburban rail has lower frequency, following a schedule rather than fixed intervals, and fewer stations spaced further apart. They primarily serve lower density suburban areas (non inner-city), and often share right-of-way with intercity or freight trains.
Some services operate only during peak hours and others uses fewer departures during off peak hours and weekends. Average speeds are high, often 50 km/h (30 mph) or higher. These higher speeds better serve the longer distances involved. Some services include express services which skip some stations in order to run faster and separate longer distance riders from short-distance ones.
The general range of commuter trains' distance varies between 15 and 200 km (10 and 125 miles). Sometimes long distances can be explained by that the train runs between two or several cities (e.g. S-Bahn in the Ruhr area of Germany). Distances between stations may vary, but are usually much longer than those of urban rail systems. In city centers the train either has a terminal station or passes through the city center with notably fewer station stops than those of urban rail systems. Toilets are often available on-board trains and in stations.
Track:
Their ability to coexist with freight or intercity services in the same right-of-way can drastically reduce system construction costs. However, frequently they are built with dedicated tracks within that right-of-way to prevent delays, especially where service densities have converged in the inner parts of the network.
Most such trains run on the local standard gauge track. Some systems may run on a narrower or broader gauge.
Some countries and regions, including Finland, India, Pakistan, Russia, Brazil and Sri Lanka, as well as San Francisco (BART) in the USA and Melbourne and Adelaide in Australia, use broad gauge track.
Distinction between other modes of rail:
Metro rail or rapid transit usually covers a smaller inner-urban area ranging outwards to between 12 km to 20 km (or 8 to 14 miles), has a higher train frequency and runs on separate tracks (underground or elevated), whereas commuter rail often shares tracks, technology and the legal framework within mainline railway systems.
However, the classification as a metro or rapid rail can be difficult as both may typically cover a metropolitan area exclusively, run on separate tracks in the centre, and often feature purpose-built rolling stock.
The fact that the terminology is not standardized across countries (even across English-speaking countries) further complicates matters. This distinction is most easily made when there are two (or more) systems such as New York's subway and the LIRR and Metro-North Railroad,
Types of Trains:
Commuter/suburban trains are usually optimized for maximum passenger volume, in most cases without sacrificing too much comfort and luggage space, though they seldom have all the amenities of long-distance trains. Cars may be single- or double-level, and aim to provide seating for all. Compared to intercity trains, they have less space, fewer amenities and limited baggage areas.
Multiple unit type:
Commuter rail trains are usually composed of multiple units, which are self-propelled, bidirectional, articulated passenger rail cars with driving motors on each (or every other) bogie.
Depending on local circumstances and tradition they may be powered either by diesel engines located below the passenger compartment (diesel multiple units) or by electricity picked up from third rails or overhead lines (electric multiple units).
Multiple units are almost invariably equipped with control cabs at both ends, which is why such units are so frequently used to provide commuter services, due to the associated short turn-around time.
Locomotive hauled services:
Locomotive hauled services are used in some countries or locations. This is often a case of asset sweating, by using a single large combined fleet for intercity and regional services. Loco hauled services are usually run in push-pull formation, that is, the train can run with the locomotive at the "front" or "rear" of the train (pushing or pulling).
Trains are often equipped with a control cab at the other end of the train from the locomotive, allowing the train operator to operate the train from either end. The motive power for locomotive-hauled commuter trains may be either electric or Diesel-electric, although some countries, such as Germany and some of the former Soviet-bloc countries, also use diesel-hydraulic locomotives.
Seat plans:
In the USA and some other countries, a three-and-two seat plan is used. However, few people sit in the middle seat on these trains because they feel crowded and uncomfortable.
North America:
Main article: Commuter rail in North America
In the United States, Canada, Costa Rica, El Salvador and Mexico regional passenger rail services are provided by governmental or quasi-governmental agencies, with a limited number of metropolitan areas served.
The six most patronized commuter rail systems in the United States are:
- MTA's Long Island Rail Road, serving New York City and Long Island
- NJ Transit Rail, serving New York, Newark, Trenton and Philadelphia
- MTA's Metro-North Railroad, serving New York, Yonkers and Bridgeport
- Metra, serving Chicago
- SEPTA Regional Rail, serving Philadelphia
- MBTA, serving Boston (Metro-North/South), Worcester and Providence, Rhode Island
See also: ___________________________________________________________________________
Light rail in the United States:
Light rail is defined in the United States (and elsewhere) as a mode of electrified (or in a few exceptional cases, diesel-powered) rail-based transit, usually urban in nature, which is distinguished by operation in routes of generally exclusive, though not necessarily grade-separated, rights-of-way.
This is distinguished from 'heavy rail' systems, also known as rapid transit or 'metro' (e.g. subway and/or elevated), which are fully grade-separated from other traffic, and which are characterized by higher passenger capacities than light rail.
Arguably, traditional streetcars (also known as trolleys in North America, or as trams outside of North America especially in Europe), which is rail-based transit that takes place in shared roadways with automobile traffic (i.e. with street running) and thus does not operate in exclusive rights-of-way, can be considered to be a sub-set of light rail, though the two modes of transit are often treated as distinct in the United States.
Light rail transit in the United States:
See also: List of United States light rail systems by ridership
According to the American Public Transportation Association, of the 30-odd cities with light rail systems in the United States, the light rail systems in six of them (Boston, Los Angeles, Philadelphia, Portland (Oregon), San Diego, and San Francisco) achieve more than 30 million unlinked passenger transits per year.
The United States has a number of light rail systems in its mid-sized to large cities. In the oldest legacy systems, such as in Boston, Cleveland, Newark, New Orleans, Philadelphia, Pittsburgh, and San Francisco, the light rail is vestigal from the first-generation streetcar systems of the 19th and early 20th centuries, but were spared the fate of other streetcar systems due to these systems having some grade separation from traffic and high ridership.
A number of second-generation light rail systems were inaugurated in the 1980s starting with San Diego in 1981, with a few more built in the 1990s, and many more opened in lower density cities since the early 2000s.
Click on any of the following blue hyperlinks for more about Light Rail Transit in the United States:
- History of streetcars and light rail in the United States
- List of light rail systems operating in the United States
- Light rail systems in the United States under construction
- List of United States light rail systems by ridership
- List of rail transit systems in the United States
- Light rail in North America
- Streetcars in North America
- Public Transportation in San Diego
- Transportation in Dallas, Texas
- Transportation in Houston
- Transportation in Portland, Oregon
- Transportation in San Francisco
- Transportation in Salt Lake City
- Transportation of St. Louis, Missouri
- Rail transit in metropolitan Denver
- Rail transit in Boston
- Transportation in San Jose, California
- Transportation in Hudson Country, New Jersey
- Rail transit in Kenosha, Wisconsin
- Transportation in New York City
Amtrak
YouTube Video: Amtrak Vacations: Routes
YouTube Video: Riding Amtrak's Coast Starlight, Los Angeles To Santa Barbara
Picture below: Geographic map of the Amtrak system
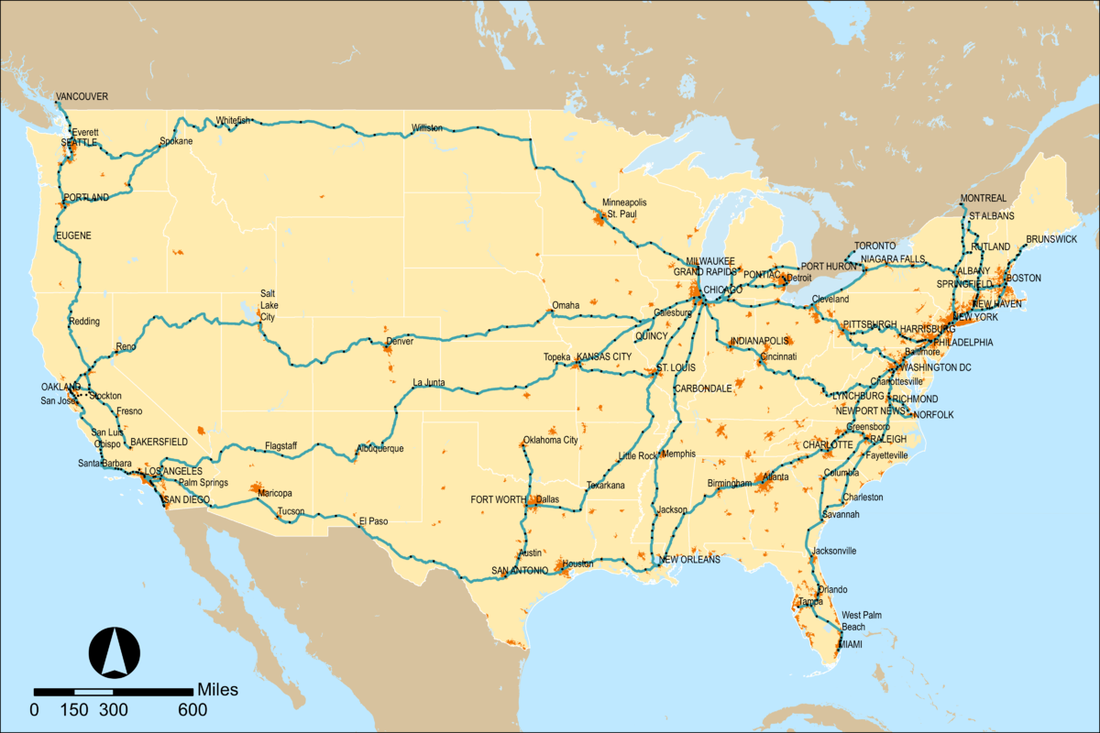
The National Railroad Passenger Corporation, doing business as Amtrak, is a passenger railroad service that provides medium- and long-distance intercity service in the contiguous United States and to nine Canadian cities.
Founded in 1971 as a quasi-public corporation to operate many U.S. passenger rail services, it receives a combination of state and federal subsidies but is managed as a for-profit organization. Amtrak's headquarters is located one block west of Union Station in Washington, D.C.
Amtrak serves more than 500 destinations in 46 states and three Canadian provinces, operating more than 300 trains daily over 21,400 miles (34,000 km) of track. Some track sections allow trains to run as fast as 150 mph (240 km/h).
In fiscal year 2017, Amtrak served 31.7 million passengers and had $3.3 billion in revenue, while employing more than 20,000 people. Nearly 87,000 passengers ride more than 300 Amtrak trains on a daily basis. Nearly two-thirds of passengers come from the 10 largest metropolitan areas; 83% of passengers travel on routes shorter than 400 miles (645 km).
Click on any of the following blue hyperlinks for more about Amtrak:
- History
- Operations including Routes
- On-board services
- Company Officers as well as Labor Issues
- Public funding including its Controversy
- Incidents
- See also:
- Official website
- Amtrak - Historic Timeline
- Amtrak - Great American Stations
- The Museum of Railway Timetables (Amtrak timetables from 1971–present)
- Amtrak Arrow Reservation System
- Amtrak California, partnership with California Department of Transportation (Caltrans)
- Amtrak Cascades, partnership with:
- Amtrak Express - Amtrak's freight and package service
- Amtrak paint schemes
- Amtrak Police
- List of Amtrak station codes – alphabetical by three-letter ticketing code
- List of Amtrak stations – alphabetical by city name
- Beech Grove Shops
- Positive train control
- Railway Museum of Greater Cincinnati
- Visible Intermodal Prevention and Response team (VIPR) – TSA's rail security operations
- Fred Weiderhold- former Inspector General of Amtrak
Passenger Ships, including Cruise Ships along with a List of the Largest Cruise Ships
YouTube Video of the Movie Trailer for "Titanic" (1997 Movie)
YouTube Video: Carnival Vista: Virtual Tour | Meet Carnival Vista | Carnival Cruise Line
YouTube Video: Emerald Bay Cruise on the Tahoe Queen (Lake Tahoe,NV)
Pictured below:
TOP: Staten Island Ferry
BOTTOM: A look inside the world's largest cruise ship with outrageous amenities
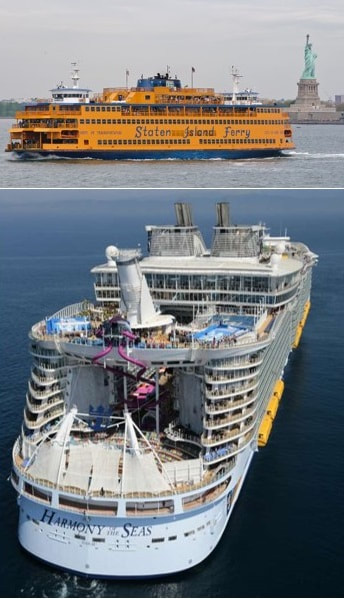
Click here for a List of the Largest Cruise Ships.
A passenger ship is a merchant ship whose primary function is to carry passengers on the sea.
The category does not include cargo vessels (see above) which have accommodations for limited numbers of passengers, such as the ubiquitous twelve-passenger freighters once common on the seas in which the transport of passengers is secondary to the carriage of freight.
The type does however include many classes of ships designed to transport substantial numbers of passengers as well as freight. Indeed, until recently virtually all ocean liners were able to transport mail, package freight and express, and other cargo in addition to passenger luggage, and were equipped with cargo holds and derricks, kingposts, or other cargo-handling gear for that purpose. Only in more recent ocean liners and in virtually all cruise ships (below) has this cargo capacity been eliminated.
While typically passenger ships are part of the merchant marine, passenger ships have also been used as troopships and often are commissioned as naval ships when used as for that purpose.
Types of Passenger Ships:
Passenger ships include the following:
An ocean liner is the traditional form of passenger ship. Once such liners operated on scheduled line voyages to all inhabited parts of the world. With the advent of airliners transporting passengers and specialized cargo vessels hauling freight, line voyages have almost died out.
But with their decline came an increase in sea trips for pleasure and fun, and in the latter part of the 20th century ocean liners gave way to cruise ships as the predominant form of large passenger ship containing from hundreds to thousands of people, with the main area of activity changing from the North Atlantic Ocean to the Caribbean Sea.
Although some ships have characteristics of both types, the design priorities of the two forms are different: ocean liners value speed and traditional luxury while cruise ships value amenities (swimming pools, theaters, ball rooms, casinos, sports facilities, etc.) rather than speed.
These priorities produce different designs. In addition, ocean liners typically were built to cross the Atlantic Ocean between Europe and the United States or travel even further to South America or Asia while cruise ships typically serve shorter routes with more stops along coastlines or among various islands.
For a long time, cruise ships were smaller than the old ocean liners had been, but in the 1980s, this changed when Knut Kloster, the director of Norwegian Caribbean Lines, bought one of the biggest surviving liners, the SS France, and transformed her into a huge cruise ship, which he renamed the SS Norway.
Her success demonstrated that there was a market for large cruise ships. Successive classes of ever-larger ships were ordered, until the Cunard liner Queen Elizabeth was finally dethroned from her 56-year reign as the largest passenger ship ever built (a dethronement that led to numerous further dethronements from the same position).
Both the RMS Queen Elizabeth 2 (QE2) (1969) and her successor as Cunard's flagship RMS Queen Mary 2 (QM2), which entered service in 2004, are of hybrid construction. Like transatlantic ocean liners, they are fast ships and strongly built to withstand the rigors of the North Atlantic in line voyage service, but both ships are also designed to operate as cruise ships, with the amenities expected in that trade.
QM2 was superseded by the Freedom of the Seas of the Royal Caribbean line as the largest passenger ship ever built; however, QM2 still hold the record for the largest ocean liner.
The Freedom of the Seas was superseded by the Oasis of the Seas in October 2009.
Click on any of the following for more about Passenger Ships: ___________________________________________________________________________
A cruise ship is a passenger ship used for pleasure voyages, when the voyage itself, the ship's amenities, and sometimes the different destinations along the way (i.e., ports of call), are part of the experience.
Transportation is not the only purpose of cruising, particularly on cruises that return passengers to their originating port (known as "closed-loop cruises"). On "cruises to nowhere" or "nowhere voyages", the ship makes 2–3 night round trips without any ports of call.
In contrast, dedicated transport oriented ocean liners did "line voyages" and typically transport passengers from one point to another, rather than on round trips.
Traditionally, a liner for the transoceanic trade will be built to a higher standard than a typical cruise ship, including higher freeboard and stronger plating to withstand rough seas and adverse conditions encountered in the open ocean, such as the North Atlantic.
Ocean liners also usually have larger capacities for fuel, food, and other stores for consumption on long voyages, compared to dedicated cruise ships, but few are still in existence, such as the preserved liners and Queen Mary 2, which makes scheduled North Atlantic voyages.
Although often luxurious, ocean liners characteristics that made them unsuitable for cruising, such as high fuel consumption, deep draughts that prevented their entering shallow ports, enclosed weatherproof decks that were not appropriate for tropical weather, and cabins designed to maximize passenger numbers rather than comfort (such as a high proportion of windowless suites).
The gradual evolution of passenger ship design from ocean liners to cruise ships has seen passenger cabins shifted from inside the hull to the superstructure with private verandas. The modern cruise ships, while sacrificing some qualities of seaworthiness, have added amenities to cater to water tourists, and recent vessels have been described as "balcony-laden floating condominiums".
The distinction between ocean liners and cruise ships has blurred, particularly with respect to deployment, although differences in construction remain. Larger cruise ships have also engaged in longer trips, such as transoceanic voyages which may not return to the same port for months (longer round trips).
Some former ocean liners operate as cruise ships, such as Marco Polo, although this number is diminishing. The only dedicated transatlantic ocean liner in operation as a liner of December 2013 is Queen Mary 2 of the Cunard Line. She also has the amenities of contemporary cruise ships and sees significant service on cruises.
Cruising has become a major part of the tourism industry, accounting for U.S.$29.4 billion with over 19 million passengers carried worldwide in 2011. The industry's rapid growth has seen nine or more newly built ships catering to a North American clientele added every year since 2001, as well as others servicing European clientele. Smaller markets, such as the Asia-Pacific region, are generally serviced by older ships. These are displaced by new ships in the high growth areas.
As of 2017, the world's largest cruise ship was Royal Caribbean International's Symphony of the Seas.
Click on any of the following blue hyperlinks for more about Cruise Ships:
A passenger ship is a merchant ship whose primary function is to carry passengers on the sea.
The category does not include cargo vessels (see above) which have accommodations for limited numbers of passengers, such as the ubiquitous twelve-passenger freighters once common on the seas in which the transport of passengers is secondary to the carriage of freight.
The type does however include many classes of ships designed to transport substantial numbers of passengers as well as freight. Indeed, until recently virtually all ocean liners were able to transport mail, package freight and express, and other cargo in addition to passenger luggage, and were equipped with cargo holds and derricks, kingposts, or other cargo-handling gear for that purpose. Only in more recent ocean liners and in virtually all cruise ships (below) has this cargo capacity been eliminated.
While typically passenger ships are part of the merchant marine, passenger ships have also been used as troopships and often are commissioned as naval ships when used as for that purpose.
Types of Passenger Ships:
Passenger ships include the following:
- ferries, which are vessels for day to day or overnight short-sea trips moving passengers and vehicles (whether road or rail);
- ocean liners, which typically are passenger or passenger-cargo vessels transporting passengers and often cargo on longer line voyages;
- and cruise ships (covered later herein), which often transport passengers on round-trips, in which the trip itself and the attractions of the ship and ports visited are the principal draw.
An ocean liner is the traditional form of passenger ship. Once such liners operated on scheduled line voyages to all inhabited parts of the world. With the advent of airliners transporting passengers and specialized cargo vessels hauling freight, line voyages have almost died out.
But with their decline came an increase in sea trips for pleasure and fun, and in the latter part of the 20th century ocean liners gave way to cruise ships as the predominant form of large passenger ship containing from hundreds to thousands of people, with the main area of activity changing from the North Atlantic Ocean to the Caribbean Sea.
Although some ships have characteristics of both types, the design priorities of the two forms are different: ocean liners value speed and traditional luxury while cruise ships value amenities (swimming pools, theaters, ball rooms, casinos, sports facilities, etc.) rather than speed.
These priorities produce different designs. In addition, ocean liners typically were built to cross the Atlantic Ocean between Europe and the United States or travel even further to South America or Asia while cruise ships typically serve shorter routes with more stops along coastlines or among various islands.
For a long time, cruise ships were smaller than the old ocean liners had been, but in the 1980s, this changed when Knut Kloster, the director of Norwegian Caribbean Lines, bought one of the biggest surviving liners, the SS France, and transformed her into a huge cruise ship, which he renamed the SS Norway.
Her success demonstrated that there was a market for large cruise ships. Successive classes of ever-larger ships were ordered, until the Cunard liner Queen Elizabeth was finally dethroned from her 56-year reign as the largest passenger ship ever built (a dethronement that led to numerous further dethronements from the same position).
Both the RMS Queen Elizabeth 2 (QE2) (1969) and her successor as Cunard's flagship RMS Queen Mary 2 (QM2), which entered service in 2004, are of hybrid construction. Like transatlantic ocean liners, they are fast ships and strongly built to withstand the rigors of the North Atlantic in line voyage service, but both ships are also designed to operate as cruise ships, with the amenities expected in that trade.
QM2 was superseded by the Freedom of the Seas of the Royal Caribbean line as the largest passenger ship ever built; however, QM2 still hold the record for the largest ocean liner.
The Freedom of the Seas was superseded by the Oasis of the Seas in October 2009.
Click on any of the following for more about Passenger Ships: ___________________________________________________________________________
A cruise ship is a passenger ship used for pleasure voyages, when the voyage itself, the ship's amenities, and sometimes the different destinations along the way (i.e., ports of call), are part of the experience.
Transportation is not the only purpose of cruising, particularly on cruises that return passengers to their originating port (known as "closed-loop cruises"). On "cruises to nowhere" or "nowhere voyages", the ship makes 2–3 night round trips without any ports of call.
In contrast, dedicated transport oriented ocean liners did "line voyages" and typically transport passengers from one point to another, rather than on round trips.
Traditionally, a liner for the transoceanic trade will be built to a higher standard than a typical cruise ship, including higher freeboard and stronger plating to withstand rough seas and adverse conditions encountered in the open ocean, such as the North Atlantic.
Ocean liners also usually have larger capacities for fuel, food, and other stores for consumption on long voyages, compared to dedicated cruise ships, but few are still in existence, such as the preserved liners and Queen Mary 2, which makes scheduled North Atlantic voyages.
Although often luxurious, ocean liners characteristics that made them unsuitable for cruising, such as high fuel consumption, deep draughts that prevented their entering shallow ports, enclosed weatherproof decks that were not appropriate for tropical weather, and cabins designed to maximize passenger numbers rather than comfort (such as a high proportion of windowless suites).
The gradual evolution of passenger ship design from ocean liners to cruise ships has seen passenger cabins shifted from inside the hull to the superstructure with private verandas. The modern cruise ships, while sacrificing some qualities of seaworthiness, have added amenities to cater to water tourists, and recent vessels have been described as "balcony-laden floating condominiums".
The distinction between ocean liners and cruise ships has blurred, particularly with respect to deployment, although differences in construction remain. Larger cruise ships have also engaged in longer trips, such as transoceanic voyages which may not return to the same port for months (longer round trips).
Some former ocean liners operate as cruise ships, such as Marco Polo, although this number is diminishing. The only dedicated transatlantic ocean liner in operation as a liner of December 2013 is Queen Mary 2 of the Cunard Line. She also has the amenities of contemporary cruise ships and sees significant service on cruises.
Cruising has become a major part of the tourism industry, accounting for U.S.$29.4 billion with over 19 million passengers carried worldwide in 2011. The industry's rapid growth has seen nine or more newly built ships catering to a North American clientele added every year since 2001, as well as others servicing European clientele. Smaller markets, such as the Asia-Pacific region, are generally serviced by older ships. These are displaced by new ships in the high growth areas.
As of 2017, the world's largest cruise ship was Royal Caribbean International's Symphony of the Seas.
Click on any of the following blue hyperlinks for more about Cruise Ships:
- History
- Operators and cruise lines
- Organization
- Regional industries including Caribbean cruising industry
- Shipyards
- Safety
- Environmental impact
- See also:
Aerospace Manufacturers, including a List of Major Aerospace Companies based on Revenues
Top Row (L) Boeing’s Proposed Hypersonic Plane Is Really, Really Fast; (R) See above YouTube Video: “5 Most Unusual Boeing Aircraft YOU HAVE TO SEE”;
Bottom Row (L) Dreamliner: Inside the World's Most Anticipated Airplane; (R) Boeing’s big month capped off with hat trick of new contracts;
- YouTube Video: 5 Most Unusual Boeing Aircraft YOU HAVE TO SEE
- YouTube Video: 15 Bizarre Experimental Aircraft
Top Row (L) Boeing’s Proposed Hypersonic Plane Is Really, Really Fast; (R) See above YouTube Video: “5 Most Unusual Boeing Aircraft YOU HAVE TO SEE”;
Bottom Row (L) Dreamliner: Inside the World's Most Anticipated Airplane; (R) Boeing’s big month capped off with hat trick of new contracts;
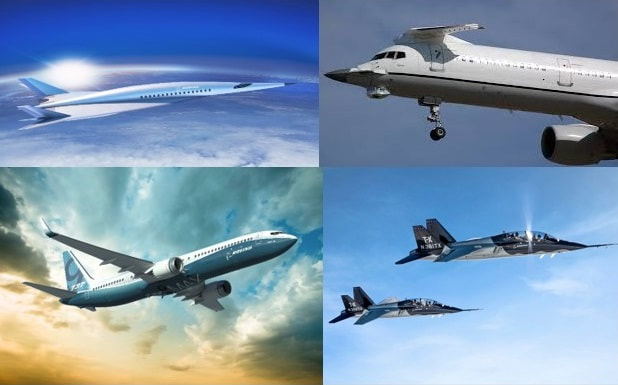
An aerospace manufacturer is a company or individual involved in the various aspects of designing, building, testing, selling, and maintaining aircraft, aircraft parts, missiles, rockets, or spacecraft.
The aircraft industry is the industry supporting aviation by building aircraft and manufacturing aircraft parts for their maintenance. This includes aircraft and parts used for civil aviation and military aviation. Most production is done pursuant to type certificates and Defense Standards issued by a government body. This term has been largely subsumed by the more encompassing term: "aerospace industry".
Market:
In 2015 the Aircraft Production was worth $180.3 Billion: 61% airliners, 14% business and general aviation, 12% Military aircraft, 10% military rotary wing and 3% civil rotary wing; while their MRO was worth $135.1 Bn or $315.4 Bn combined.
The global aerospace industry was worth $838 billion in 2017: Aircraft & Engine OEMs represented 28% ($235 Bn), Civil & Military MRO & Upgrades 27% ($226 Bn), Aircraft Systems & Component Manufacturing 26% ($218 Bn), Satellites & Space 7% ($59 Bn), Missiles & UAVs 5% ($42 Bn) and other activity, including flight simulators, defense electronics, public research accounted for 7% ($59 Bn).
The countries with the largest industry were led by the United States with $408.4 Bn (49%) followed by France with $69 Bn (8.2%) then China with $61.2 Bn (7.3%), United Kingdom with $48.8 Bn (5.8%), Germany with $46.2 Bn (5.5%), Russia with $27.1 Bn (3.2%), Canada with $24 Bn (2.9%) and Japan with $21 Bn (2.5%).
In 2018, the new commercial aircraft value is projected for $270.4 billion while business aircraft will amount for $18 billion and civil helicopters for $4 billion.
Click on any of the following blue hyperlinks for more about Aerospace Manufacturers:
- Largest Companies
- Geography including Cities
- Consolidation
- Suppliers
- Supply chain
- See also:
- Aerospace
- Aviation accidents and incidents
- List of aircraft manufacturers
- List of spacecraft manufacturers
- Military-industrial complex
- Aircraft parts industry
- Aviation
- "U.S. Aerospace Industries Association".
- "Aerospace, Defense & Government Services – Mergers & Acquisitions (January 1993 - December 2016)" (PDF). Grundman Advisory. 6 Apr 2017.
- Jens Flottau (Feb 22, 2018). "Opinion: Airframers Should Watch Where They Squeeze Suppliers". Aviation Week & Space Technology.
Trucking Industry in the United States
- YouTube Video: CDL Truck Driving School Tips For Beginner Commercial Truck Driving
- YouTube Video: One Simple Rule to Being Happy in Your Truck Driving Career
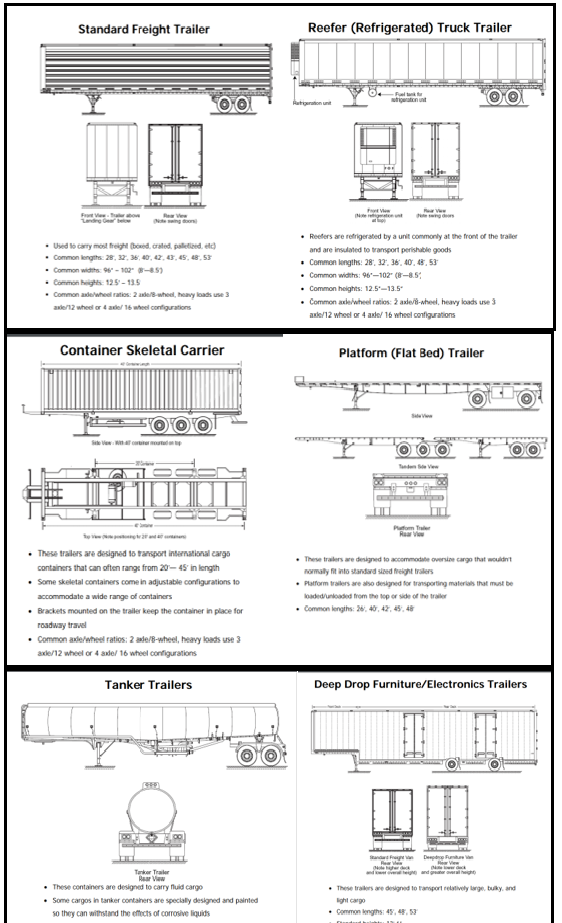
The trucking industry serves the American economy by transporting large quantities of raw materials, works in process, and finished goods over land—typically from manufacturing plants to retail distribution centers.
Trucks are also used in the construction industry, as dump trucks and portable concrete mixers move the large amounts of rocks, dirt, concrete, and other building materials used in construction. Trucks in America are responsible for the majority of freight movement over land and are tools in the manufacturing, transportation, and warehousing industries.
Driving large trucks and buses require a commercial driver's license (CDL) to operate. Obtaining a CDL requires extra education and training dealing with the special knowledge requirements and handling characteristics of such a large vehicle.
Drivers of commercial motor vehicles (CMVs) must adhere to the hours of service, which are regulations governing the driving hours of commercial drivers. These and all other rules regarding the safety of interstate commercial driving are issued by the Federal Motor Carrier Safety Administration (FMCSA).
The FMCSA is a division of the United States Department of Transportation (USDOT), which governs all transportation-related industries such as trucking, shipping, railroads, and airlines. Some other issues are handled by another branch of the USDOT, the Federal Highway Administration (FHWA).
Developments in technology, such as computers, satellite communication, and the Internet, have contributed to many improvements within the industry. These developments have increased the productivity of company operations, saved the time and effort of drivers, and provided new, more accessible forms of entertainment to men and women who often spend long periods of time away from home.
In 2006, the United States Environmental Protection Agency implemented revised emission standards for diesel trucks (reducing airborne pollutants emitted by diesel engines) which promises to improve air quality and public health.
Click on any of the following blue hyperlinks for more about the Trucking Industry in the United States:
- History
- 1990s-present
- Economic impact
- Rules and regulations
- Types of vehicles used in trucking
- Truck drivers
- Trucking organizations
- See also:
United States Department of Transportation
- YouTube Video: Infrastructure: Last Week Tonight with John Oliver (HBO)
- YouTube Video: Tacoma, WA Bridge Collapse: The Wobbliest Bridge in the World? (1940)
- YouTube Video: Scariest Bridges in the World
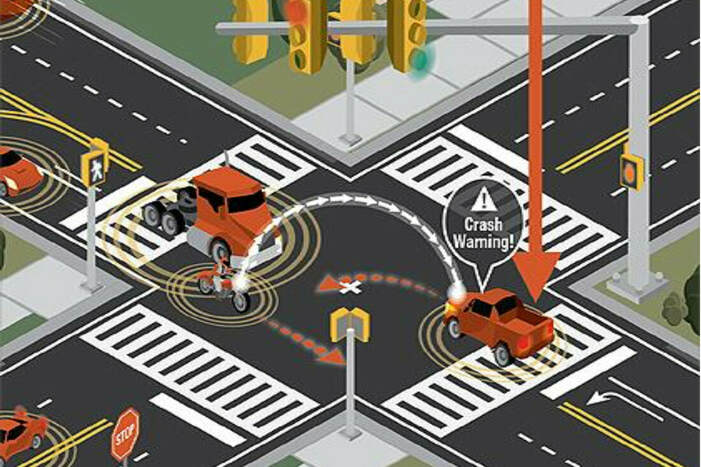
The United States Department of Transportation (USDOT or DOT) is a federal Cabinet department of the U.S. government concerned with transportation. It was established by an act of Congress on October 15, 1966, and began operation on April 1, 1967. It is governed by the United States Secretary of Transportation.
History:
Prior to the Department of Transportation, the Under Secretary of Commerce for Transportation administered the functions now associated with the DOT. In 1965, Najeeb Halaby, administrator of the Federal Aviation Agency – the future Federal Aviation Administration (FAA) – suggested to U.S. President Lyndon B. Johnson that transportation be elevated to a cabinet-level post, and that the FAA be folded into the DOT.
Administrations:
Former Administrations:
Click on any of the following blue hyperlinks for more about the United States Department of Transportation:
History:
Prior to the Department of Transportation, the Under Secretary of Commerce for Transportation administered the functions now associated with the DOT. In 1965, Najeeb Halaby, administrator of the Federal Aviation Agency – the future Federal Aviation Administration (FAA) – suggested to U.S. President Lyndon B. Johnson that transportation be elevated to a cabinet-level post, and that the FAA be folded into the DOT.
Administrations:
- Federal Aviation Administration (FAA)
- Federal Highway Administration (FHWA)
- Federal Motor Carrier Safety Administration (FMCSA)
- Federal Railroad Administration (FRA)
- Federal Transit Administration (FTA)
- Maritime Administration (MARAD)
- National Highway Traffic Safety Administration (NHTSA)
- Office of Inspector General (OIG)
- Office of the Secretary of Transportation (OST)
- Pipeline and Hazardous Materials Safety Administration (PHMSA)
- Saint Lawrence Seaway Development Corporation (SLSDC)
- John A. Volpe National Transportation Systems Center
- Bureau of Transportation Statistics (BTS)
Former Administrations:
- Transportation Security Administration – transferred to Department of Homeland Security in 2003
- United States Coast Guard – transferred to Department of Homeland Security in 2003
- Surface Transportation Board (STB) – spun off as an independent federal agency in 2015
Click on any of the following blue hyperlinks for more about the United States Department of Transportation:
- Budget
- Related legislation
- Freedom of Information Act processing performance
- See also:
- Official website
- United States Department of Transportation in the Federal Register
- Title 23 of the Code of Federal Regulations
- American Highway Users Alliance
- National Highway System (United States)
- National Transportation Safety Board
- Passenger vehicles in the United States
- United States Federal Maritime Commission
- Turner-Fairbank Highway Research Center
History of the Automobile
- YouTube Video: Top 10 Most Popular Cars of All Time by WatchMojo
- YouTube Video: Top 10 Worst Cars of All Time by WatchMojo
- YouTube Video of the History of the Automobile
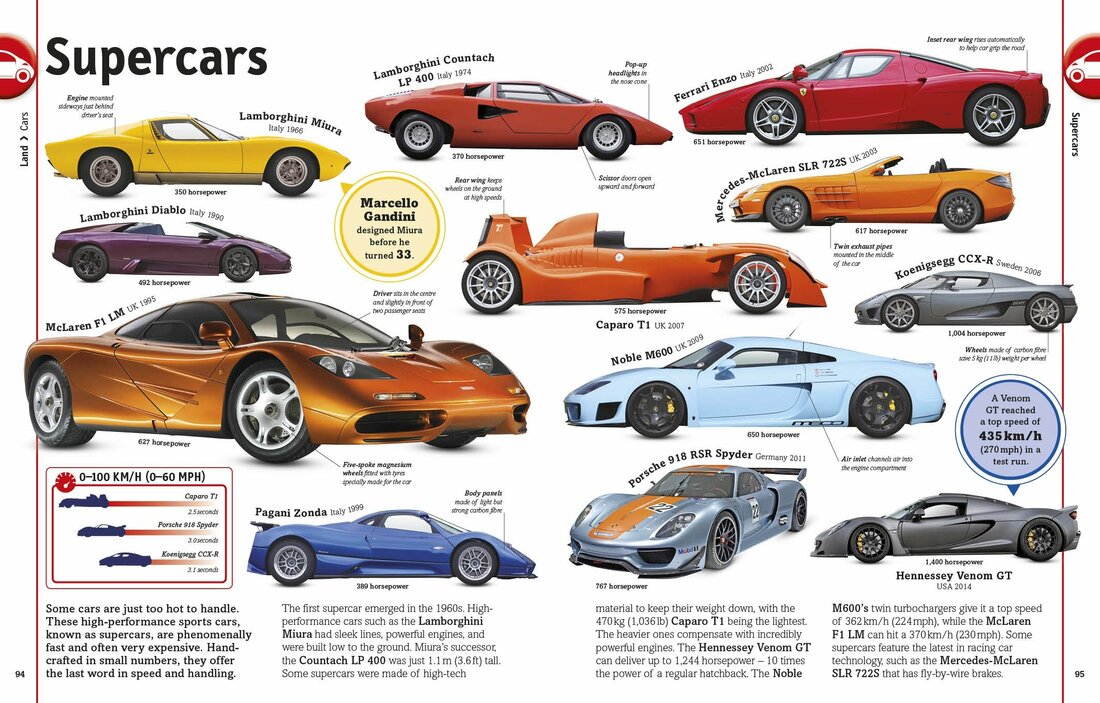
The early history of the automobile can be divided into a number of eras, based on the prevalent means of propulsion. Later periods were defined by trends in exterior styling, size, and utility preferences.
In 1769 the first steam-powered automobile capable of human transportation was built by Nicolas-Joseph Cugnot.
In 1808, François Isaac de Rivaz designed the first car powered by an internal combustion engine fueled by hydrogen.
In 1870 Siegfried Marcus built the first gasoline powered combustion engine, which he placed on a pushcart, building four progressively more sophisticated combustion-engine cars over a 10-to-15-year span that influenced later cars. Marcus created the two-cycle combustion engine. The car's second incarnation in 1880 introduced a four-cycle, gasoline-powered engine, an ingenious carburetor design and magneto ignition. He created an additional two models further refining his design with steering, a clutch and a brake.
The four-stroke petrol (gasoline) internal combustion engine that still constitutes the most prevalent form of modern automotive propulsion was patented by Nikolaus Otto. The similar four-stroke diesel engine was invented by Rudolf Diesel. The hydrogen fuel cell, one of the technologies hailed as a replacement for gasoline as an energy source for cars, was discovered in principle by Christian Friedrich Schönbein in 1838.
The battery electric car owes its beginnings to Ányos Jedlik, one of the inventors of the electric motor, and Gaston Planté, who invented the lead–acid battery in 1859.
In 1885, Karl Benz developed a petrol or gasoline powered automobile. This is also considered to be the first "production" vehicle as Benz made several other identical copies. The automobile was powered by a single cylinder four-stroke engine.
In 1913, the Ford Model T, created by the Ford Motor Company five years prior, became the first automobile to be mass-produced on a moving assembly line. By 1927, Ford had produced over 15,000,000 Model T automobiles.
Click on any of the following blue hyperlinks for more about the History of the Automobile:
- Power sources
- Eras of invention
- See also:
- Automotive industry – current production and companies
- Motocycle
- History of the internal combustion engine
- Timeline of motor vehicle brands
- Timeline of North American automobiles
- History of transport
- Automuseum Dr. Carl Benz, Ladenburg/Germany
- Bertha Benz Memorial Route
- University of Washington Libraries Digital Collections – Transportation photographs Digital collection depicting various modes of transportation (including automobiles) in the Pacific Northwest region and western United States during the first half of the 20th century.
- History of the automobile on About.com: Inventors site
- Automotive History – An ongoing photographic history of the automobile.
- Taking the Wheel, Manufacturers' catalogs from the first decade of American automobile
Collision-avoidance Vehicles
- YouTube Video: Toyota Integrated Safety - Pre-collision System with Pedestrian-avoidance Steer Assist
- YouTube Video: How Does Safe Drive System's Collision Avoidance System Work?
- YouTube Video: Collision warning systems at the test track by Consumer Reports
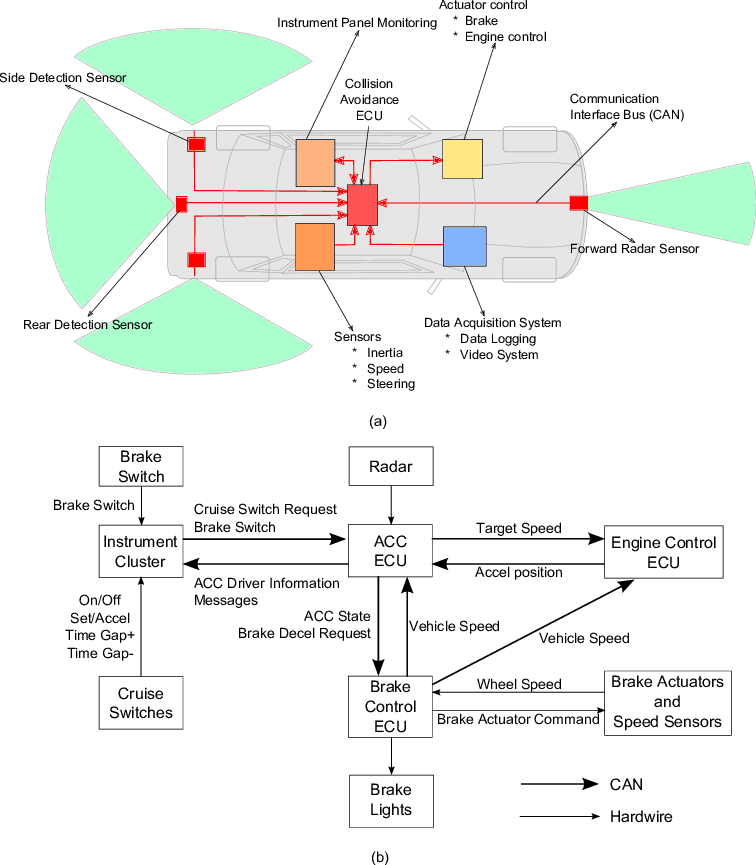
A collision avoidance system, also known as a precrash system, forward collision warning system, or collision mitigating system, is an automobile safety system designed to prevent or reduce the severity of a collision. It uses radar (all-weather) and sometimes laser (LIDAR) and camera (employing image recognition) to detect an imminent crash. GPS sensors can detect fixed dangers such as approaching stop signs through a location database.
Once an impending collision is detected, these systems provide a warning to the driver. When the collision becomes imminent, they take action autonomously without any driver input (by braking or steering or both).
Collision avoidance by braking is appropriate at low vehicle speeds (e.g. below 50 km/h (31 mph)), while collision avoidance by steering may be more appropriate at higher vehicle speeds if lanes are clear.
Cars with collision avoidance may also be equipped with adaptive cruise control, using the same forward-looking sensors.
In March 2016, the National Highway Traffic Safety Administration (NHTSA) and the Insurance Institute for Highway Safety announced the manufacturers of 99% of U.S. automobiles had agreed to include automatic emergency braking systems as standard on virtually all new cars sold in the U.S. by 2022.
In Europe, there was a related agreement about advanced emergency braking system (AEBS) or autonomous emergency braking (AEB) in 2012.
United Nations Economic Commission for Europe (UNECE) has announced that this kind of system will become mandatory for new heavy vehicles starting in 2015.
NHTSA projected that the ensuing accelerated rollout of automatic emergency braking would prevent an estimated 28,000 collisions and 12,000 injuries.
In India, Autonomous Emergency Braking system (AEB) could become mandatory on new cars by 2022.
AEB differs from Forward Collision Warning: FCW alert the driver with a warning but does not by itself brake the vehicle. According to Euro NCAP, AEB has three characteristics:
Click on any of the following blue hyperlinks for more about Collision-avoidance Systems:
Once an impending collision is detected, these systems provide a warning to the driver. When the collision becomes imminent, they take action autonomously without any driver input (by braking or steering or both).
Collision avoidance by braking is appropriate at low vehicle speeds (e.g. below 50 km/h (31 mph)), while collision avoidance by steering may be more appropriate at higher vehicle speeds if lanes are clear.
Cars with collision avoidance may also be equipped with adaptive cruise control, using the same forward-looking sensors.
In March 2016, the National Highway Traffic Safety Administration (NHTSA) and the Insurance Institute for Highway Safety announced the manufacturers of 99% of U.S. automobiles had agreed to include automatic emergency braking systems as standard on virtually all new cars sold in the U.S. by 2022.
In Europe, there was a related agreement about advanced emergency braking system (AEBS) or autonomous emergency braking (AEB) in 2012.
United Nations Economic Commission for Europe (UNECE) has announced that this kind of system will become mandatory for new heavy vehicles starting in 2015.
NHTSA projected that the ensuing accelerated rollout of automatic emergency braking would prevent an estimated 28,000 collisions and 12,000 injuries.
In India, Autonomous Emergency Braking system (AEB) could become mandatory on new cars by 2022.
AEB differs from Forward Collision Warning: FCW alert the driver with a warning but does not by itself brake the vehicle. According to Euro NCAP, AEB has three characteristics:
- Autonomous: the system acts independently of the driver to avoid or mitigate the accident.
- Emergency: the system will intervene only in a critical situation.
- Braking: the system tries to avoid the accident by applying the brakes.
Click on any of the following blue hyperlinks for more about Collision-avoidance Systems:
- History
- in the United States
- Benefits
- Features
- By Automobile manufacturer:
- List of cars with available collision avoidance features
- New car assessment program
- Cost
- See also:
- Adaptive cruise control
- Advanced Automatic Collision Notification
- Autonomous car
- Automotive night vision
- Brake Assist
- Electronic stability control
- Lane departure warning system
- LIDAR#Object detection for transportation systems
- Blind spot monitor
- Intelligent Car
- GPS tracking
- Crash Avoidance Technology Overview, IIHS
- Ratings of existing crash avoidance systems, Insurance Institute for Highway Safety, January 2017.
- Argenia Railway Technologies (2005). Collision Avoidance Systems for The Railways (2005).
- US Department of Transportation: Research and Innovative Technology Administration
- Ford: Safer Driving Through Vehicle collision avoidance systems
- Intelligent Transportation Systems: Collision Avoidance
- ERSEC Project (FP7 247955): Enhanced Road Safety by integrating Egnos-Galileo data with on-board Control system for car collision avoidance applications
- DSRC/Wave Vehicle Communication and Traffic Simulator eTEXAS
- Euro NCAP’s fitment survey
- https://www.nissanusa.com/experience-nissan/news-and-events/car-safety-features-technology.html
Transportation network company including a List of Transportation Companies by Country
From "Jimmy Kimmel Live": YouTube Video of Jimmy Kimmel as"The Uber Driver"
Click here for a Ride-sharing Comparison of Lyft.com and Uber.com (logos below)
From "Jimmy Kimmel Live": YouTube Video of Jimmy Kimmel as"The Uber Driver"
Click here for a Ride-sharing Comparison of Lyft.com and Uber.com (logos below)

Click here for a List of Transportation Companies by Country.
A transportation network company (TNC) connects paying passengers with drivers who provide the transportation on their own non-commercial vehicles.
All parties connect to the service via website and mobile apps. TNCs include:
The concept was introduced in 2011 by Jahan Khanna and Sunil Paul, who would go on to become co-founders of Sidecar.
In 2013 California Public Utilities Commission defined for regulation that a transportation network company is a company that uses an online-enabled platform to connect passengers with drivers using their personal, non-commercial, vehicles.
These platforms have sometimes been called "ridesharing", but transportation experts prefer the term "ridesourcing" to clarify that drivers do not share a destination with their passengers. (The term means the outsourcing of rides.)
An early definition of a TNC was created by the California Public Utilities Commission in 2013, as a result of a rule-making process around new and previously unregulated forms of transportation. Prior to the definition, the commission had attempted to group TNC services in the same category as limousines.
Taxi industry groups opposed the creation of the new category, arguing that TNCs, as illegal taxicab operations are taking away their business.
The commission established regulations for TNC services at the same time as the definition. These included driver background checks, driver training, drug and alcohol policies, minimum insurance coverage of $1 million, and company licensing through the Public Utilities Commission.
Legalilty:
See also: Legal status of Uber's service
Several communities, governments, organizations, and other persons consider Transportation Network Companies to be illegal and unauthorized transportation. TNCs are legally defined as technology companies and not transportation companies. TNCs have been banned in many places.
Business Model:
Further information: Uberisation
Transportation network companies develop a computing platform which creates an online marketplace in which a driver and car owner registered with the company may offer their own labor and car to people who request a ride in the marketplace.
The services offered by such companies include the maintenance of the marketplace where fare-paying customers can meet drivers for hire, vetting of drivers to ensure that they meet the standards of the company's own marketplace, and delivery of payment from customer to driver in their own financial transaction.
The services of transportation network companies can be in demand because of the convenience of requesting a ride by a mobile app, the satisfaction of being able to have experience monitored by the company as a third party, and because of competitive pricing for services.
Taxicabs can provide similar services, but while most cities require companies which provide taxicabs to meet requirements for business, transportation network companies may be exempt from such requirements due to their only providing a marketplace and not actually employing drivers or keeping automobiles.
Another variation on the business model occurs when companies use similar online marketplaces to provide drivers who drive the customer's personal vehicle for them.
Examples include Dryver, IDriveYourCar.com, and WeDrive. In these models, customers typically reserve a driver who arrives at their location, takes them wherever they need to go in the customer's own car, and then returns the car and the customer home at the end of the reservation.
A transportation network company (TNC) connects paying passengers with drivers who provide the transportation on their own non-commercial vehicles.
All parties connect to the service via website and mobile apps. TNCs include:
- Lyft,
- Sidecar (sold to General Motors),
- Cabify,
- Uber,
- goCatch,
- Via,
- Ola Cabs,
- GoCar,
- GO-JEK,
- Careem,
- Wingz,
- GrabCar
- and Didi Kuaidi.
The concept was introduced in 2011 by Jahan Khanna and Sunil Paul, who would go on to become co-founders of Sidecar.
In 2013 California Public Utilities Commission defined for regulation that a transportation network company is a company that uses an online-enabled platform to connect passengers with drivers using their personal, non-commercial, vehicles.
These platforms have sometimes been called "ridesharing", but transportation experts prefer the term "ridesourcing" to clarify that drivers do not share a destination with their passengers. (The term means the outsourcing of rides.)
An early definition of a TNC was created by the California Public Utilities Commission in 2013, as a result of a rule-making process around new and previously unregulated forms of transportation. Prior to the definition, the commission had attempted to group TNC services in the same category as limousines.
Taxi industry groups opposed the creation of the new category, arguing that TNCs, as illegal taxicab operations are taking away their business.
The commission established regulations for TNC services at the same time as the definition. These included driver background checks, driver training, drug and alcohol policies, minimum insurance coverage of $1 million, and company licensing through the Public Utilities Commission.
Legalilty:
See also: Legal status of Uber's service
Several communities, governments, organizations, and other persons consider Transportation Network Companies to be illegal and unauthorized transportation. TNCs are legally defined as technology companies and not transportation companies. TNCs have been banned in many places.
Business Model:
Further information: Uberisation
Transportation network companies develop a computing platform which creates an online marketplace in which a driver and car owner registered with the company may offer their own labor and car to people who request a ride in the marketplace.
The services offered by such companies include the maintenance of the marketplace where fare-paying customers can meet drivers for hire, vetting of drivers to ensure that they meet the standards of the company's own marketplace, and delivery of payment from customer to driver in their own financial transaction.
The services of transportation network companies can be in demand because of the convenience of requesting a ride by a mobile app, the satisfaction of being able to have experience monitored by the company as a third party, and because of competitive pricing for services.
Taxicabs can provide similar services, but while most cities require companies which provide taxicabs to meet requirements for business, transportation network companies may be exempt from such requirements due to their only providing a marketplace and not actually employing drivers or keeping automobiles.
Another variation on the business model occurs when companies use similar online marketplaces to provide drivers who drive the customer's personal vehicle for them.
Examples include Dryver, IDriveYourCar.com, and WeDrive. In these models, customers typically reserve a driver who arrives at their location, takes them wherever they need to go in the customer's own car, and then returns the car and the customer home at the end of the reservation.
Boeing (Commericial and Military Aircraft) Pictured below: Boeing Commercial Jets over the Years
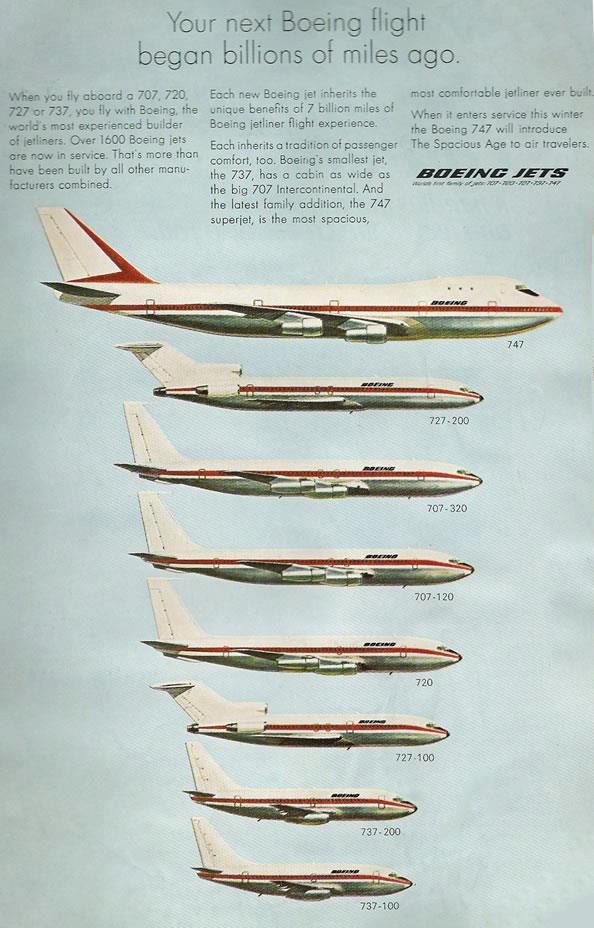
The Boeing Company is an American multinational corporation that designs, manufactures, and sells the following worldwide:
The company also provides leasing and product support services. Boeing is among the largest global aerospace manufacturers; it is the second-largest defense contractor in the world based on 2018 revenue, and is the largest exporter in the United States by dollar value. Boeing stock is included in the Dow Jones Industrial Average. Boeing is incorporated in Delaware.
Boeing was founded by William Boeing in Seattle, Washington on July 15, 1916. The present corporation is the result of the merger of Boeing with McDonnell Douglas on August 1, 1997. Then chairman and CEO of Boeing, Philip M. Condit, assumed those roles in the combined company, while Harry Stonecipher, former CEO of McDonnell Douglas, became president and COO.
The Boeing Company has its corporate headquarters in Chicago, Illinois. Boeing is organized into five primary divisions:
In 2017, Boeing recorded US$93.3 billion in sales, ranked 24th on the Fortune magazine "Fortune 500" list (2018), ranked 64th on the "Fortune Global 500" list (2018), and ranked 19th on the "World's Most Admired Companies" list (2018).
In 2019, Boeing's global reputation, commercial business, and financial rating suffered after the 737 MAX was grounded worldwide following two fatal crashes in late 2018 and early 2019.
The firm has also been criticized for supplying and profiting from wars, including the war in Yemen where its missiles were found to be used for indiscriminate attacks, killing many civilians.
History:
Main article: History of Boeing
The Boeing Company was started in 1916, when American lumber industrialist William E. Boeing founded Aero Products Company in Seattle, Washington. Shortly before doing so, he and Conrad Westervelt created the "B&W" seaplane.
In 1917, the organization was renamed Boeing Airplane Company, with William Boeing forming Boeing Airplane & Transport Corporation in 1928.
In 1929, the company was renamed United Aircraft and Transport Corporation, followed by the acquisition of several aircraft makers such as Avion, Chance Vought, Sikorsky Aviation, Stearman Aircraft, Pratt & Whitney, and Hamilton Metalplane.
In 1931, the group merged its four smaller airlines into United Airlines.
In 1934, the manufacture of aircraft was required to be separate from air transportation. Therefore, Boeing Airplane Company became one of three major groups to arise from dissolution of United Aircraft and Transport; the other two entities were United Aircraft (later United Technologies) and United Airlines.
In 1960, the company bought Vertol Corporation, which at the time, was the biggest independent fabricator of helicopters. During the 1960s and 1970s, the company diversified into industries such as outer space travel, marine craft, agriculture, energy production and transit systems.
In 1995, Boeing partnered with Russian, Ukrainian and Anglo-Norwegian organizations to create Sea Launch, a company providing commercial launch services sending satellites to geostationary orbit from floating platforms.
In 2000, Boeing acquired the satellite segment of Hughes Electronics.
Corporate headquarters were moved from Seattle to Chicago in 2001.
After two fatal crashes of the Boeing 737 MAX narrow-body passenger airplanes in 2018 and 2019, aviation regulators and airlines around the world grounded all 737 MAX airliners. A total of 387 aircraft were grounded.
Boeing's reputation, business, and financial rating has suffered after these groundings, questioning Boeing's strategy, governance, and focus on profits and cost efficiency.
The Wall Street Journal reported on May 5, 2019, that Boeing had known of the issue with the system for "about a year" before the crash in Indonesia. In December 2019, Boeing announced it will suspend 737 MAX production from January 2020. Soon after, on December 23, then CEO Dennis Muilenburg resigned and was replaced by David Calhoun.
In May 2020, the company cut 12,000 jobs due to the drop in air travel during the COVID-19 pandemic. In July 2020, Boeing reported a loss of $2.4 billion as a result of the pandemic and the grounding of its 737 MAX aircraft. As a result of the profit loss, the company announced that it is planning to do more job and production cuts.
Divisions:
The corporation's three main divisions are Boeing Commercial Airplanes (BCA), Boeing Defense, Space & Security (BDS), and Boeing Global Services.
Environmental record:
In 2006, the UCLA Center for Environmental Risk Reduction released a study showing that Boeing's Santa Susana Field Laboratory, a site that was a former Rocketdyne test and development site in the Simi Hills of eastern Ventura County in Southern California, had been contaminated by Rocketdyne with toxic and radioactive waste. Boeing agreed to a cleanup agreement with the EPA in 2017. Clean up studies and lawsuits are in progress.
Jet biofuels:
Main articles: Aviation biofuel and Algae fuel
The airline industry is responsible for about 11% of greenhouse gases emitted by the U.S. transportation sector. Aviation's share of the greenhouse gas emissions was poised to grow, as air travel increases and ground vehicles use more alternative fuels like ethanol and bio-diesel. Boeing estimates that biofuels could reduce flight-related greenhouse-gas emissions by 60 to 80%. The solution blends algae fuels with existing jet fuel.
Boeing executives said the company was collaborating with Brazilian biofuels maker Tecbio, Aquaflow Bionomic of New Zealand, and other fuel developers around the world. As of 2007, Boeing had tested six fuels from these companies, and expected to test 20 fuels "by the time we're done evaluating them". Boeing also joined other aviation-related members in the Algal Biomass Organization (ABO) in June 2008.
Air New Zealand and Boeing are researching the jatropha plant to see if it is a sustainable alternative to conventional fuel. A two-hour test flight using a 50–50 mixture of the new biofuel with Jet A-1 in a Rolls Royce RB-211 engine of a 747-400 was completed on December 30, 2008. The engine was then removed to be studied to identify any differences between the Jatropha blend and regular Jet A1. No effects on performances were found.
On August 31, 2010, Boeing worked with the U.S. Air Force to test the Boeing C-17 running on 50% JP-8, 25% Hydro-treated Renewable Jet fuel and 25% of a Fischer–Tropsch fuel with successful results.
Electric propulsion:
For NASA's N+3 future airliner program, Boeing has determined that hybrid electric engine technology is by far the best choice for its subsonic design. Hybrid electric propulsion has the potential to shorten takeoff distance and reduce noise.
Political contributions, federal contracts, advocacy:
In 2008 and 2009, Boeing was second on the list of Top 100 US Federal Contractors, with contracts totaling US$22 billion and US$23 billion respectively.
Since 1995, the company has agreed to pay US$1.6 billion to settle 39 instances of misconduct, including US$615 million in 2006 in relation to illegal hiring of government officials and improper use of proprietary information.
Boeing secured the highest ever tax breaks at the state level in 2013.
Boeing's spent US$16.9 million on lobbying expenditures in 2009. In the 2008 presidential election, Barack Obama "was by far the biggest recipient of campaign contributions from Boeing employees and executives, hauling in US$197,000 – five times as much as John McCain, and more than the top eight Republicans combined".
Boeing has a corporate citizenship program centered on charitable contributions in five areas: education, health, human services, environment, the arts, culture, and civic engagement.
In 2011, Boeing spent US$147.3 million in these areas through charitable grants and business sponsorships. In February 2012, Boeing Global Corporate Citizenship partnered with the Insight Labs to develop a new model for foundations to more effectively lead the sectors they serve.
The company is a member of the U.S. Global Leadership Coalition, a Washington D.C.-based coalition of more than 400 major companies and NGOs that advocate a larger International Affairs Budget, which funds American diplomatic and development efforts abroad.
A series of U.S. diplomatic cables show how U.S. diplomats and senior politicians intervene on behalf of Boeing to help boost the company's sales.
In 2007 and 2008, the company benefited from over US$10 billion of long-term loan guarantees, helping finance the purchase of their commercial aircraft in countries including Brazil, Canada, Ireland, and the United Arab Emirates, from the Export-Import Bank of the United States, some 65% of the total loan guarantees the bank made in the period.
In December 2011, the non-partisan organization Public Campaign criticized Boeing for spending US$52.29 million on lobbying and not paying taxes during 2008–2010, instead getting US$178 million in tax rebates, despite making a profit of US$9.7 billion, laying off 14,862 workers since 2008, and increasing executive pay by 31% to US$41.9 million in 2010 for its top five executives.
Click on the following blue hyperlinks for more about Boeing:
The company also provides leasing and product support services. Boeing is among the largest global aerospace manufacturers; it is the second-largest defense contractor in the world based on 2018 revenue, and is the largest exporter in the United States by dollar value. Boeing stock is included in the Dow Jones Industrial Average. Boeing is incorporated in Delaware.
Boeing was founded by William Boeing in Seattle, Washington on July 15, 1916. The present corporation is the result of the merger of Boeing with McDonnell Douglas on August 1, 1997. Then chairman and CEO of Boeing, Philip M. Condit, assumed those roles in the combined company, while Harry Stonecipher, former CEO of McDonnell Douglas, became president and COO.
The Boeing Company has its corporate headquarters in Chicago, Illinois. Boeing is organized into five primary divisions:
- Boeing Commercial Airplanes (BCA);
- Boeing Defense, Space & Security (BDS);
- Engineering, Operations & Technology;
- Boeing Capital;
- and Boeing Shared Services Group.
In 2017, Boeing recorded US$93.3 billion in sales, ranked 24th on the Fortune magazine "Fortune 500" list (2018), ranked 64th on the "Fortune Global 500" list (2018), and ranked 19th on the "World's Most Admired Companies" list (2018).
In 2019, Boeing's global reputation, commercial business, and financial rating suffered after the 737 MAX was grounded worldwide following two fatal crashes in late 2018 and early 2019.
The firm has also been criticized for supplying and profiting from wars, including the war in Yemen where its missiles were found to be used for indiscriminate attacks, killing many civilians.
History:
Main article: History of Boeing
The Boeing Company was started in 1916, when American lumber industrialist William E. Boeing founded Aero Products Company in Seattle, Washington. Shortly before doing so, he and Conrad Westervelt created the "B&W" seaplane.
In 1917, the organization was renamed Boeing Airplane Company, with William Boeing forming Boeing Airplane & Transport Corporation in 1928.
In 1929, the company was renamed United Aircraft and Transport Corporation, followed by the acquisition of several aircraft makers such as Avion, Chance Vought, Sikorsky Aviation, Stearman Aircraft, Pratt & Whitney, and Hamilton Metalplane.
In 1931, the group merged its four smaller airlines into United Airlines.
In 1934, the manufacture of aircraft was required to be separate from air transportation. Therefore, Boeing Airplane Company became one of three major groups to arise from dissolution of United Aircraft and Transport; the other two entities were United Aircraft (later United Technologies) and United Airlines.
In 1960, the company bought Vertol Corporation, which at the time, was the biggest independent fabricator of helicopters. During the 1960s and 1970s, the company diversified into industries such as outer space travel, marine craft, agriculture, energy production and transit systems.
In 1995, Boeing partnered with Russian, Ukrainian and Anglo-Norwegian organizations to create Sea Launch, a company providing commercial launch services sending satellites to geostationary orbit from floating platforms.
In 2000, Boeing acquired the satellite segment of Hughes Electronics.
Corporate headquarters were moved from Seattle to Chicago in 2001.
After two fatal crashes of the Boeing 737 MAX narrow-body passenger airplanes in 2018 and 2019, aviation regulators and airlines around the world grounded all 737 MAX airliners. A total of 387 aircraft were grounded.
Boeing's reputation, business, and financial rating has suffered after these groundings, questioning Boeing's strategy, governance, and focus on profits and cost efficiency.
The Wall Street Journal reported on May 5, 2019, that Boeing had known of the issue with the system for "about a year" before the crash in Indonesia. In December 2019, Boeing announced it will suspend 737 MAX production from January 2020. Soon after, on December 23, then CEO Dennis Muilenburg resigned and was replaced by David Calhoun.
In May 2020, the company cut 12,000 jobs due to the drop in air travel during the COVID-19 pandemic. In July 2020, Boeing reported a loss of $2.4 billion as a result of the pandemic and the grounding of its 737 MAX aircraft. As a result of the profit loss, the company announced that it is planning to do more job and production cuts.
Divisions:
The corporation's three main divisions are Boeing Commercial Airplanes (BCA), Boeing Defense, Space & Security (BDS), and Boeing Global Services.
- Boeing Commercial Airplanes (BCA)
- Boeing Defense, Space & Security (BDS)
- Boeing Global Services
- Boeing Capital
- Engineering, Test & Technology
- Boeing Shared Services Group
- Boeing NeXt - explores urban air mobility
Environmental record:
In 2006, the UCLA Center for Environmental Risk Reduction released a study showing that Boeing's Santa Susana Field Laboratory, a site that was a former Rocketdyne test and development site in the Simi Hills of eastern Ventura County in Southern California, had been contaminated by Rocketdyne with toxic and radioactive waste. Boeing agreed to a cleanup agreement with the EPA in 2017. Clean up studies and lawsuits are in progress.
Jet biofuels:
Main articles: Aviation biofuel and Algae fuel
The airline industry is responsible for about 11% of greenhouse gases emitted by the U.S. transportation sector. Aviation's share of the greenhouse gas emissions was poised to grow, as air travel increases and ground vehicles use more alternative fuels like ethanol and bio-diesel. Boeing estimates that biofuels could reduce flight-related greenhouse-gas emissions by 60 to 80%. The solution blends algae fuels with existing jet fuel.
Boeing executives said the company was collaborating with Brazilian biofuels maker Tecbio, Aquaflow Bionomic of New Zealand, and other fuel developers around the world. As of 2007, Boeing had tested six fuels from these companies, and expected to test 20 fuels "by the time we're done evaluating them". Boeing also joined other aviation-related members in the Algal Biomass Organization (ABO) in June 2008.
Air New Zealand and Boeing are researching the jatropha plant to see if it is a sustainable alternative to conventional fuel. A two-hour test flight using a 50–50 mixture of the new biofuel with Jet A-1 in a Rolls Royce RB-211 engine of a 747-400 was completed on December 30, 2008. The engine was then removed to be studied to identify any differences between the Jatropha blend and regular Jet A1. No effects on performances were found.
On August 31, 2010, Boeing worked with the U.S. Air Force to test the Boeing C-17 running on 50% JP-8, 25% Hydro-treated Renewable Jet fuel and 25% of a Fischer–Tropsch fuel with successful results.
Electric propulsion:
For NASA's N+3 future airliner program, Boeing has determined that hybrid electric engine technology is by far the best choice for its subsonic design. Hybrid electric propulsion has the potential to shorten takeoff distance and reduce noise.
Political contributions, federal contracts, advocacy:
In 2008 and 2009, Boeing was second on the list of Top 100 US Federal Contractors, with contracts totaling US$22 billion and US$23 billion respectively.
Since 1995, the company has agreed to pay US$1.6 billion to settle 39 instances of misconduct, including US$615 million in 2006 in relation to illegal hiring of government officials and improper use of proprietary information.
Boeing secured the highest ever tax breaks at the state level in 2013.
Boeing's spent US$16.9 million on lobbying expenditures in 2009. In the 2008 presidential election, Barack Obama "was by far the biggest recipient of campaign contributions from Boeing employees and executives, hauling in US$197,000 – five times as much as John McCain, and more than the top eight Republicans combined".
Boeing has a corporate citizenship program centered on charitable contributions in five areas: education, health, human services, environment, the arts, culture, and civic engagement.
In 2011, Boeing spent US$147.3 million in these areas through charitable grants and business sponsorships. In February 2012, Boeing Global Corporate Citizenship partnered with the Insight Labs to develop a new model for foundations to more effectively lead the sectors they serve.
The company is a member of the U.S. Global Leadership Coalition, a Washington D.C.-based coalition of more than 400 major companies and NGOs that advocate a larger International Affairs Budget, which funds American diplomatic and development efforts abroad.
A series of U.S. diplomatic cables show how U.S. diplomats and senior politicians intervene on behalf of Boeing to help boost the company's sales.
In 2007 and 2008, the company benefited from over US$10 billion of long-term loan guarantees, helping finance the purchase of their commercial aircraft in countries including Brazil, Canada, Ireland, and the United Arab Emirates, from the Export-Import Bank of the United States, some 65% of the total loan guarantees the bank made in the period.
In December 2011, the non-partisan organization Public Campaign criticized Boeing for spending US$52.29 million on lobbying and not paying taxes during 2008–2010, instead getting US$178 million in tax rebates, despite making a profit of US$9.7 billion, laying off 14,862 workers since 2008, and increasing executive pay by 31% to US$41.9 million in 2010 for its top five executives.
Click on the following blue hyperlinks for more about Boeing:
- Financials
- Employment numbers
- Corporate governance
- See also:
- Official Boeing website
- Business data for Boeing Co:
- "Annual Reports Collection". University of Washington. 1948–1984.
- Airbus
- Embraer
- Comac
- United Aircraft Corporation
- Competition between Airbus and Boeing
- Future of Flight Aviation Center & Boeing Tour – Corporate public museum
- United States Air Force Plant 42
The Importance of Maintaining Infrastructure in the United States including Critical Infrastructure.
- YouTube Video: Roads in USA vs Europe China and Russia
- CBS News Video: America's Failing Infrastructure
- YouTube Video of the Importance of Investing in Infrastructure by Senator Jeanne Shaheen
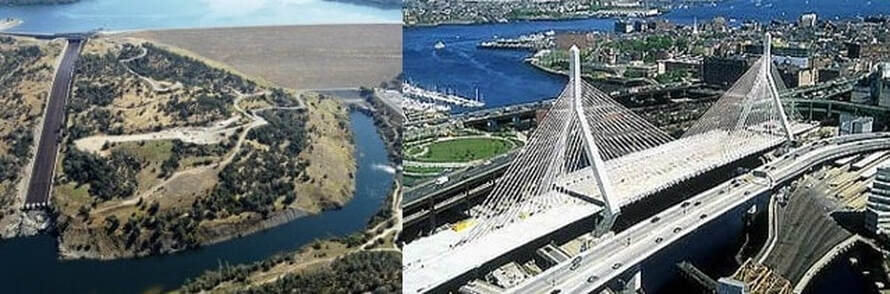
Infrastructure refers to the fundamental facilities and systems serving a country, city, or area, including the services and facilities necessary for its economy to function. It typically characterizes technical structures such as roads, bridges, tunnels, water supply, sewers, electrical grids, telecommunications, and so forth, and can be defined as "the physical components of interrelated systems providing commodities and services essential to enable, sustain, or enhance societal living conditions.
Critical infrastructure or Critical national infrastructure (CNI) is a term used by governments to describe assets that are essential for the functioning of a society and economy - the infrastructure. Most commonly associated with the term are facilities for:
The USA has had a wide-reaching Critical Infrastructure Protection Program in place since 1996. Its Patriot Act of 2001 defined critical infrastructure as those "systems and assets, whether physical or virtual, so vital to the United States that the incapacity or destruction of such systems and assets would have a debilitating impact on security, national economic security, national public health or safety, or any combination of those matters."
In 2014 the NIST Cybersecurity Framework was published, and quickly became a popular set of guidelines, despite the imposing costs of full compliance.
These have identified a number of critical infrastructures and responsible agencies:
The National Infrastructure Protection Plan (NIPP) defines critical infrastructure sector in the US. Presidential Policy Directive 21 (PPD-21), issued in February, 2013 entitled Critical Infrastructure Security and Resilience mandated an update to the NIPP. This revision of the plan established the following 16 critical infrastructure sectors:
National Monuments and Icons along with the Postal and Shipping sector were removed in 2013 update to the NIPP. The 2013 version of the NIPP has faced criticism for lacking viable risk measures. The plan assigns the following agencies sector-specific coordination responsibilities:
See also:
Critical infrastructure or Critical national infrastructure (CNI) is a term used by governments to describe assets that are essential for the functioning of a society and economy - the infrastructure. Most commonly associated with the term are facilities for:
- electricity generation, transmission and distribution;
- gas production, transport and distribution;
- oil and oil products production, transport and distribution;
- telecommunication;
- water supply (drinking water, waste water/sewage, stemming of surface water (e.g. dikes and sluices));
- agriculture, food production and distribution;
- heating (e.g. natural gas, fuel oil, district heating);
- public health (hospitals, ambulances);
- transportation systems (fuel supply, railway network, airports, harbors, inland shipping);
- financial services (banking, clearing);
- security services (police, military).
The USA has had a wide-reaching Critical Infrastructure Protection Program in place since 1996. Its Patriot Act of 2001 defined critical infrastructure as those "systems and assets, whether physical or virtual, so vital to the United States that the incapacity or destruction of such systems and assets would have a debilitating impact on security, national economic security, national public health or safety, or any combination of those matters."
In 2014 the NIST Cybersecurity Framework was published, and quickly became a popular set of guidelines, despite the imposing costs of full compliance.
These have identified a number of critical infrastructures and responsible agencies:
- Agriculture and food – Departments of Agriculture and Health and Human Services
- Water – Environmental Protection Agency
- Public Health – Department of Health and Human Services
- Emergency Services – Department of Homeland Security
- Government – Department of Homeland Security
- Defense Industrial Base – Department of Defense
- Information and Telecommunications – Department of Commerce
- Energy – Department of Energy
- Transportation and Shipping – Department of Transportation
- Banking and Finance – Department of the Treasury
- Chemical Industry and Hazardous Materials – Department of Homeland Security
- Post – Department of Homeland Security
- National Monuments and icons - Department of the Interior
- Critical Manufacturing - Department of Homeland Security (14th sector announced 03-Mar-2008; recorded 30-Apr-2008)
The National Infrastructure Protection Plan (NIPP) defines critical infrastructure sector in the US. Presidential Policy Directive 21 (PPD-21), issued in February, 2013 entitled Critical Infrastructure Security and Resilience mandated an update to the NIPP. This revision of the plan established the following 16 critical infrastructure sectors:
- Chemical
- Commercial Facilities
- Communications
- Critical Manufacturing
- Dams
- Defense Industrial Base
- Emergency Services
- Energy
- Financial Services
- Food and Agriculture
- Government Facilities
- Healthcare and Public Health
- Information Technology
- Nuclear Reactors, Materials, and Waste
- Transportation Systems
- Water and Wastewater Systems
National Monuments and Icons along with the Postal and Shipping sector were removed in 2013 update to the NIPP. The 2013 version of the NIPP has faced criticism for lacking viable risk measures. The plan assigns the following agencies sector-specific coordination responsibilities:
- Chemical -Department of Homeland Security
- Commercial Facilities -Department of Homeland Security
- Communications - Department of Homeland Security
- Critical Manufacturing -Department of Homeland Security
- Dams -Department of Homeland Security
- Defense Industrial Base -Department of Defense
- Emergency Services - Department of Homeland Security
- Energy - Department of Energy
- Financial Services - Department of the Treasury
- Food and Agriculture -Department of Agriculture
- Government Facilities - Department of Homeland Security and General Services Administration
- Healthcare and Public Health - Department of Health and Human Services
- Information Technology -Department of Homeland Security
- Nuclear Reactors, Materials, and Waste - Department of Homeland Security
- Transportation Systems -Department of Homeland Security and Department of Transportation
- Water and Wastewater Systems - Environmental Protection Agency
See also:
- Infrastructure security
- Airport infrastructure
- Asset Management Plan
- Green infrastructure
- Infrastructure as a service
- Infrastructure asset management
- Infrastructure security
- Logistics
- Megaproject
- Project finance
- Pseudo-urbanization
- Public capital
- Sustainable architecture
- Sustainable engineering
World-wide Automotive Industry, including a List of Automobiles manufactured by Country along with Major Car Manufacturers Headquartered in the United States
- YouTube Video : Best New Cars for 2020-2021 | Latest and Upcoming Cars, SUVs & Trucks
- YouTube Video: Meet Apple's Newest Invention: The Apple Car
- YouTube Video: 1927 Ford Model T - Jay Leno's Garage

Click here for a List of Automobile Manufacturers by Country.
World-wide Automotive Industry.
The automotive industry comprises a wide range of companies and organizations involved in the design, development, manufacturing, marketing, and selling of motor vehicles It is one of the world's largest industries by revenue.
The automotive industry does not include industries dedicated to the maintenance of automobiles following delivery to the end-user, such as automobile repair shops and motor fuel filling stations.
The word automotive comes from the Greek autos (self), and Latin motivus (of motion), referring to any form of self-powered vehicle. This term, as proposed by Elmer Sperry (1860-1930), first came into use with reference to automobiles in 1898.
Click on any of the following blue hyperlinks for more about the World-wide Automotive Industry:
Automotive industry in the United States:
Main articles:
The automotive industry in the United States began in the 1890s and, as a result of the size of the domestic market and the use of mass production, rapidly evolved into the largest in the world.
However, the United States was overtaken by Japan as the largest automobile producer in the 1980s, and subsequently by China in 2008. The U.S. is currently second among the largest manufacturer(s) in the world by volume.
The American manufactures produce approximately 8–10 million units annually. Notable exceptions were 5.7 million automobiles manufactured in 2009 (due to crisis), while production peaked during the 1970s and early 2000s at levels of 13–15 million units.
Starting with Duryea in 1895, at least 1900 different companies were formed, producing over 3,000 makes of American automobiles. World War I (1917–1918) and the Great Depression in the United States (1929–1939) combined to drastically reduce the number of both major and minor producers.
During World War II, all the auto companies switched to making military equipment and weapons. However, by the end of the next decade the remaining smaller producers disappeared or merged into amalgamated corporations.
The industry was dominated by three large companies: General Motors, Ford, and Chrysler, all based in Metro Detroit. Those " Big Three" continued to prosper, and the U.S. produced three quarters of all automobiles in the world by 1950 (8.0 million out of 10.6 million). Imports from abroad were a minor factor before the 1960s.
Beginning in the 1970s, a combination of high oil prices and increased competition from foreign auto manufacturers severely affected the companies. In the ensuing years, the companies periodically bounced back, but by 2008 the industry was in turmoil due to the aforementioned crisis.
As a result, General Motors and Chrysler filed for bankruptcy reorganization and were bailed out with loans and investments from the federal government. But according to Autodata Corp, June 2014 seasonally adjusted annualized sales is the biggest in history with 16.98 million vehicles and toppled previous record in July 2006.
Prior to the 1980s, most manufacturing facilities were owned by the Big Three (GM, Ford, Chrysler) and AMC. Their U.S. market share has dropped steadily as numerous foreign-owned car companies have built factories in the U.S. Toyota had 31,000 direct employees in the U.S. in 2012, meaning a total payroll of about $2.1 billion, compared to Ford's 80,000 U.S. employees supplying their 3,300 dealerships and Chrysler's 71,100 U.S. employees supplying their 2,328 dealerships.
Development history:
See also: History of the automobile
Production:
See also: U.S. Automobile Production Figures
The development of self-powered vehicles was accompanied by numerous technologies and components giving rise to numerous supplier firms and associated industries. Various types of energy sources were employed by early automobiles including steam, electric, and gasoline.
Thousands of entrepreneurs were involved in developing, assembling, and marketing of early automobiles on a small and local scale. Increasing sales facilitated production on a larger scale in factories with broader market distribution. Ransom E. Olds and Thomas B. Jeffery began mass production of their automobiles. Henry Ford focused on producing an automobile that many middle class Americans could afford.
Originally purchased by wealthy individuals, by 1916 cars began selling at $875. Soon, the market widened with the mechanical betterment of the cars, the reduction in prices, as well as the introduction of installment sales and payment plans.
During the period from 1917 to 1926, the annual rate of increase in sales was considerably less than from 1903 to 1916. In the years 1918, 1919, 1921, and 1924 there were absolute declines in automotive production.
The automotive industry caused a massive shift in the industrial revolution because it accelerated growth by a rate never before seen in the U.S. economy. The combined efforts of innovation and industrialization allowed the automotive industry to take off during this period and it proved to be the backbone of United States manufacturing during the 20th century.
American road system
See also: Interstate Highway System
The practicality of the automobile was initially limited because of the lack of suitable roads. Travel between cities was mostly done by railroad, waterways, or carriages. Roads were mostly dirt and hard to travel, particularly in bad weather.
The League of American Wheelmen maintained and improved roads as it was viewed as a local responsibility with limited government assistance. During this time, there was an increase in production of automobiles coupled with a swell of auto dealerships, marking their growth in popularity.
State involvement:
State governments began to use the corvee system to maintain roads, an implementation of required physical labor on a public project on the local citizens. Part of their motivation was the needs of farmers in rural areas attempting to transport their goods across rough, barely functioning roads (article).
The other reason was the weight of the wartime vehicles. The materials involved altered during World War I to accommodate the heavier trucks on the road and were responsible for widespread shift to macadam highways and roadways.
However, rural roads were still a problem for military vehicles, so four wheel drive was developed by automobile manufacturers to assist in powering through. As the prevalence of automobiles grew, it became clear funding would need to improve as well and the addition of government financing reflected that change.
Federal involvement:
The Federal Aid Road Act of 1916 allocated $75 million for building roads. It was also responsible for approving a refocusing of military vehicles to road maintenance equipment. It was followed by the Federal Aid Highway Act of 1921 provided additional funding for road construction. By 1924, there were 31,000 miles of paved road in the U.S
Click here for a graphical comparison on International trade.
The Big Three automakers:
See also:
About 3,000 automobile companies have existed in the United States.
In the early 1900s, the U.S. saw the rise of the Big Three automakers; Ford, GM, and Chrysler. The industry became centered around Detroit, in Michigan, and adjacent states (and nearby Ontario, Canada).
Historian John Rae summarizes the explanations provided by historians: a central geographic location, water access, and an established industrial base with many skilled engineers. The key factor was that Detroit was the base for highly talented entrepreneurs who saw the potential of the automobile:
From 1900 to 1915 these men transformed the fledgling industry into an international business.
Henry Ford began building cars in 1896 and started his own company in 1903. The Ford Motor Company improved mass-production with the first conveyor belt-based assembly line in 1913, producing the Model T (which had been introduced in 1908). These assembly lines significantly reduced costs. The first models were priced at $850, but by 1924 had dropped to $290. The Model T sold extremely well and Ford became the largest automobile company in the U.S. By the time it was retired in 1927, more than 15 million Model Ts had been sold.
Ford introduced the Model A in 1927 (after a six-month production stoppage to convert from the Model T), and produced it through 1931. However, while the Model A was successful, Ford lost ground to GM and eventually Chrysler, as auto buyers looked to more upscale cars and newer styling.
Ford was also a pioneer in establishing foreign manufacturing facilities, with production facilities created in England in 1911, and Germany and Australia in 1925. Ford purchased the luxury Lincoln automaker in 1922 and established the Mercury division in 1938.
General Motors Corporation (GM), the company that would soon become the world's largest automaker, was founded in 1908 by William Durant. Durant had previously been a carriage maker, and had taken control of Buick in 1904. The company initially acquired Buick, Oldsmobile and Oakland (later to become Pontiac) in 1908.
The next year GM acquired Cadillac, along with a number of other car companies and parts suppliers. Durant also was interested in acquiring Ford, but after initial merger talks, Henry Ford decided to keep his company independent.
In 1910, Durant lost control of GM after over-extending the company with its acquisitions. A group of banks took over control of GM and ousted Durant.
Durant and Louis Chevrolet founded Chevrolet in 1913 and it quickly became very successful. Durant began acquiring stock in GM and by 1915 had majority control. Chevrolet was acquired by GM in 1917 and Durant was back in charge of GM. In 1921, Durant was again forced out of the company.
During the late 1920s, General Motors overtook Ford to become the largest automaker. Under the leadership of Alfred P. Sloan, General Motors instituted decentralized management and separate divisions for each price class.
They also introduced annual model changes. GM also became an innovator in technology under the leadership of Charles F. Kettering. GM followed Ford by expanding overseas, including purchasing England's Vauxhall Motors in 1925, Germany's Opel in 1929, and Australia's Holden in 1931. GM also established GMAC (now Ally Financial) in 1919 to provide credit for buyers of its cars.
Walter Chrysler was formerly president of Buick and an executive of GM. After leaving GM in 1920, he took control of the Maxwell Motor Company, revitalized the company and, in 1925, reorganized it into Chrysler Corporation. He then acquired Dodge in 1927. The acquisition of Dodge gave Chrysler the manufacturing facilities and dealer network that it needed to significantly expand production and sales.
In 1928, Chrysler introduced the Plymouth and DeSoto brands. Chrysler also overtook Ford to become the second largest auto maker by the 1930s, following similar strategies as General Motors.
General Motors wanted automobiles to be not just utilitarian devices, which Ford emphasized, but also status symbols that were highly visible indicators of an individual's wealth. Through offering different makes and models they offered different levels in social status meeting the demands of consumers needing to display wealth.
Ford and General Motors each had their own impact on social status and the type of market they were targeting. Henry Ford focused on delivering one inexpensive, efficient product for the masses. Ford's offer was one car, one color, for one price. He not only manufactured a product for the masses, but he provided a $5 a day wage so that there was a local market to buy this product.
By contrast General Motors offered a product that catered to those looking to gain status by having that sense of individualism and offering different make, models, and quality.
Great Depression and World War II:
The 1930s saw the demise of many auto makers due to the economic effects of the Great Depression, stiff competition from the Big Three, and/or mismanagement.
Luxury car makers were particularly affected by the economy, with companies like the following going out of business:
The decade also saw several companies with innovative engineering, such as the Doble Steam Motors Corporation (advanced steam engines) and Franklin Automobile Company (air-cooled aluminum engines) going out of business.
Errett Lobban Cord, who controlled the Auburn Automobile Company (which also sold the Cord) and the Duesenberg Motor Company, was under investigation by the Securities and Exchange Commission and the Internal Revenue Service. His auto empire collapsed in 1937 and production ceased.
Major technological innovations were introduced or were widely adopted during the 1930s, such as:
The Cord 810 used front-wheel drive, had hidden headlights, and was offered with a supercharger. Exterior styling designs were more flowing, as shown most noticeably on the Auburn Speedster and the Cord 810/812.
Radical air-streamed design was introduced on the Chrysler Airflow, a sales flop, and the Lincoln-Zephyr (both of which used unit-body construction). Packard introduced their "Air Cool-ditioned" car in 1940.
When World War II started in 1939, the economy speeded up. After the U.S. entered the war in December 1941, all auto plants were converted to war production, including jeeps, trucks, tanks, and aircraft engines; all passenger automobile production ceased by February 1942.
The industry received $10 billion in war-related orders by that month, compared to $4 billion three months before. All factories were enlarged and converted, many new ones such as Ford's Willow Run and Chrysler's Detroit Arsenal Tank Plant were built, and hundreds of thousands more workers were hired. Many were new arrivals from Appalachia.
The most distinctive new product was the Jeep, with Willys making 352,000 and Ford another 295,000.
The industry produced an astonishing amount of material, including 5.9 million weapons, 2.8 million tanks and trucks, and 27,000 aircraft. This production was a major factor in the victory of the allies. Experts anticipated that Detroit would learn advanced engineering methods from the aviation industry that would result in great improvements for postwar civilian automobiles.
Unionization of the auto manufacturers workforce:
See also: United Automobile Workers
Due to the difficult working conditions in the auto production plants, auto workers began to seek representation to help improve conditions and ensure fair pay.
The United Automobile Workers union won recognition from GM and Chrysler in 1937, and Ford in 1941. In 1950, the automakers granted workers a company-paid pension to those 65 years old and with 30 years seniority.
In the mid-1950s, the automakers agreed to set up a trust fund for unemployed auto workers. In 1973, the automakers agreed to offer pensions to any worker with 30 years seniority, regardless of age. By then the automakers had also agreed to cover the entire health insurance bill for its employees, survivors, and retirees.
Decline of the independent automakers:
The only major auto companies to survive the Great Depression were:
The former three companies, known as the Big Three, enjoyed significant advantages over the smaller independent auto companies due to their financial strength, which gave them a big edge in marketing, production, and technological innovation. Most of the Big Three's competitors ended production by the 1960s, and their last major domestic competitor was acquired in the 1980s.
Crosley Motors ceased auto production in 1952. Packard and Studebaker merged in 1954, but ended production of Packard-branded cars in 1958 and ceased all auto production in 1966.
Kaiser-Frazer Corporation was started in 1945 and acquired Willys-Overland Motors (maker of the Jeep) in 1953. Production of passenger cars was discontinued in 1955. In 1970, the company was sold to American Motors Corporation.
In 1954, Nash-Kelvinator and Hudson merged to form American Motors Corporation (AMC). The company introduced numerous product and marketing innovations, but its small size made it difficult to compete with the Big Three and struggled financially.
The French auto maker Renault took control of AMC in the early 1980s, but financial difficulties continued and AMC was purchased by Chrysler Corporation in 1987.
Periodically, other entrepreneurs would found automobile companies, but most would soon fail and none achieved major sales success. Some of the best known included:
Post-war years:
See also:
Initial auto production after World War II was slowed by the retooling process, shortages of materials, and labor unrest. However, the American auto industry reflected the post-war prosperity of the late-1940s and the 1950s. Cars grew in overall size, as well as engine size during the 1950s.
The Overhead valve V-8 engine developed by GM in the late-1940s proved to be very successful and helped ignite the horsepower race, the second salvo of which was Chrysler's 1951 Hemi engine.
Longer, lower, and wider tended to be the general trend. Exterior styling was influenced by jets and rockets as the space-age dawned. Rear fins were popular and continued to grow larger, and front bumpers and taillights were sometimes designed in the shape of rockets.
Chrome plating was very popular, as was two-tone paint. The most extreme version of these styling trends were found in the 1959 Cadillac Eldorado and Chrysler Corporation's 1957 Imperial. The Chevrolet Corvette and the Ford Thunderbird, introduced in 1953 and 1955 respectively, were designed to capture the sports car market.
However, the Thunderbird grew in size in 1958 and evolved into a personal luxury car. The 1950s were also noted for perhaps one of the biggest miscues in auto marketing with the Ford Edsel, which was the result of unpopular styling and being introduced during an economic recession.
The introduction of the Interstate Highway System (see next topic) and the suburbanization of America made automobiles more necessary and helped change the landscape and culture in the United States.
Individuals began to see the automobile as an extension of themselves.
1960s:
Big changes were taking place in automobile development in the 1960s, with the Big Three dominating the industry. Meanwhile, with the passage of the $33 billion Federal Aid Highway Act of 1956, a network of regional and interstate roads continued to enhance transportation. As urban areas became more congested, more families migrated to the suburbs. Between 1960 and 1970, 70 percent of the population's growth occurred in the suburbs.
Imported vehicles grew during the 1950s and 1960s – from a very low base. In 1966, the Big Three (GM, Ford, Chrysler) had market share of 89.6% (44.5% in 2014). From 1966 to 1969, net imports increased at an average annual rate of 84%. The Volkswagen Beetle was the biggest seller.
The compact Nash Rambler had been around since 1950, and American Motors Corporation (AMC) expanded into a range of smaller cars than were offered by the Big Three.
By 1960, Rambler was the third most popular brand of automobile in the United States, behind Ford and Chevrolet. In response to this the domestic auto makers developed compact-sized cars, such as the Ford Falcon, Chevrolet Corvair, Studebaker Lark, and Plymouth Valiant.
The four-seat 1958 Ford Thunderbird (second generation) was arguably the first personal luxury car, which became a large market segment.
Pony cars were introduced with the Ford Mustang in 1964. This car combined sporty looks with a long hood, small rear deck, and a small rear seat. The car proved highly successful and imitators soon arose, including:
Muscle cars were also introduced in 1964 with the Pontiac GTO. These combined an intermediate-sized body with a large high-output engine.
Competitors were also quickly introduced, including:
Muscle cars reached their peak in the late-1960s, but soon fell out of favor due to high insurance premiums along with the combination of emission controls and high gas prices in the early 1970s.
While the personal luxury, pony, and muscle cars got most of the attention, the full sized cars formed the bulk of auto sales in the 1960s, helped by low oil prices. The styling excesses and technological gimmicks (such as the retractable hardtop and the pushbutton automatic transmission) of the 1950s were de-emphasized. The rear fins were downsized and largely gone by the mid-1960s, as was the excessive chrome.
Federal regulation of the auto industry:
Safety and environmental issues during the 1960s led to stricter government regulation of the auto industry, spurred in part by Ralph Nader and his book: Unsafe at Any Speed: The Designed-in Dangers of the American Automobile. This resulted in higher costs and eventually to weaker performance for cars in the 1970s, a period known as the Malaise Era of auto design during which American cars suffered from very poor performance.
Seat lap belts were mandated by many states effective in 1962. Under the National Traffic and Motor Vehicle Safety Act of 1966, Federal Motor Vehicle Safety Standards required shoulder belts for front passengers, front head restraints, energy-absorbing steering columns, ignition-key warning systems, anti-theft steering column/transmission locks, side marker lights and padded interiors starting in 1968.
Beginning in 1972, bumpers were required to be reinforced to meet 5-mph impact standards, a decision that was revised in 1982.
With the Clean Air Act (United States) of 1963 and the Vehicle Air Pollution and Control Act of 1965, emission controls began being instituted in 1968. The use of leaded gasoline began being curtailed in the early 1970s, which resulted in lower-compression engines being used, and thus reducing horsepower and performance. Catalytic converters began being widely used by the mid-1970s.
During his first term as EPA Administrator, William Ruckelshaus spent 60% of his time on the automobile industry, whose emissions were to be reduced 90% under the 1970 Clean Air Act after senators became frustrated at the industry's failure to cut emissions under previous, weaker air laws.
1970s:
As bold and confident as the Big Three automakers were in the 1950s and 1960s, the American auto makers in the 1970s and 1980s stumbled badly, going from one engineering, manufacturing, or marketing disaster to another, and this time is often referred to as the Malaise era of American auto design.
By 1969, imports had increased their share of the U.S. auto market with smaller, inexpensive vehicles. Volkswagen sold over 500,000 vehicles, followed by Toyota with over 100,000. In 1986 South Korea entered the American market.
In response to this, the domestic auto makers introduced new compact and sub-compact cars, such as the Ford Pinto and Maverick, the Chevrolet Vega, and the AMC Gremlin, Hornet and Pacer.
(Chrysler had to make do with importing the Dodge Colt from Mitsubishi Motors and the Plymouth Cricket from their affiliated Rootes Group.) However, design and manufacturing problems plagued a number of these cars, leading to unfavorable consumer perceptions.
GM had a string of miscues starting with the Chevrolet Vega, which developed a reputation for rapidly rusting and having major problems with the aluminium engine.
The problems with Ford's Pinto became nationally famous and Ford's reputation was harmed after media accusations that it's fuel system was prone to fire when the car was struck from behind. It was also alleged that Ford knew about this vulnerability but did not design any safeguards in order to save a few dollars per vehicle and that the company rationalized that the cost of lawsuits would be less than the cost of redesigning the car. Historical analysis of the facts don't support the "death trap" reputation attached to the Pinto but the damage to Ford's reputation had been done.
Auto sales were hurt by the 1973 oil crisis Arab embargo as the price of gasoline soared. Small fuel-efficient cars from foreign automakers took a sharply higher share of the U.S. auto sales market.
Under the Energy Policy and Conservation Act the federal government initiated fuel efficiency standards (known as Corporate Average Fuel Economy, or CAFE) in 1975, effective as of 1978 for passenger cars, and as of 1979 for light trucks.
For passenger cars, the initial standard was 18 miles per gallon (mpg), and increased to 27.5 mpg by 1985.
General Motors began responding first to the high gas prices by downsizing most of their models by 1977, and lowering their performance.
In 1979, the second oil price spike occurred, precipitated by political events in Iran, resulting in the 1979 energy crisis. By 1980, the economy slid into turmoil, with high inflation, high unemployment, and high interest rates. The automakers suffered large operating losses.
Chrysler was hurt most severely and in 1979 received a bailout from the federal government in the form of $1.5 billion in loan guarantees. One quick fix was a Detroit-built version of their then-new French (Simca) economy car, the Horizon. As a result of its financial difficulties, Chrysler sold its British and French subsidiaries, Rootes Group and Simca to the French automaker Groupe PSA for $1.
Cadillac damaged their reputation when the four-cylinder Cadillac Cimarron was introduced in 1981 (a gussied-up Chevrolet Cavalier at twice the price) and the "V8-6-4" engine didn't work as advertised.
GM's reputation was also damaged when it revealed in 1977 that they were installing Chevrolet engines in Oldsmobiles, and lawsuits from aggrieved Oldsmobile owners followed.
Likewise litigation ensued when a trio of diesel engines, designed from gasoline engines and used in GM cars from 1978 to 1985 suffered major problems. Class action lawsuits and efforts from the Federal Trade Commission resulted in buybacks of the cars from GM.
Chrysler also suffered damage to its reputation when its compact cars, the Plymouth Volaré and Dodge Aspen, were developed quickly and suffered from massive recalls and poor quality.
1980s:
In 1981, Japanese automakers entered into the "voluntary export restraint" limiting the number of autos that they could export to the U.S. to 1.68 million per year. One side effect of this quota was that Japanese car companies opened new divisions through which they began developing luxury cars that had higher profit margins, such as with Toyota's Lexus, Honda's Acura, and Nissan's Infiniti.
Another consequence was that the Japanese car makers began opening auto production plants in the U.S., with the three largest Japanese auto manufacturers all opening production facilities by 1985. These facilities were opened primarily in the southern states because of financial incentives offered by state governments, access to the nation via the interstate highways, the availability of a large pool of cheaper labor, and the weakness of unions.
The Southern states passed right-to-work laws and the UAW failed in its repeated union-organizing efforts at these plants.
The Big Three began investing in and/or developing joint manufacturing facilities with several of the Japanese automakers
Despite the financial and marketing upheavals during the 1970s and 1980s, these decades led to technological innovations and/or widespread use of such improvements as:
By the mid-1980s, oil prices had fallen sharply, helping lead to the revitalization of the American auto industry.
Under the leadership of Lee Iacocca, Chrysler Corporation mounted a comeback after its flirtation with bankruptcy in 1979. The minivan was introduced in the 1984 model year by Chrysler with the Plymouth Voyager and Dodge Caravan, and proved very popular. These vehicles were built on a passenger-car chassis and seated up to seven people as well as being able to hold bulky loads. Chrysler also introduced their "K-cars" in the 1980s, which came with front-wheel drive and fuel-efficient OHC engines.
In 1987, Chrysler bought American Motors Corporation, which produced the Jeep. This proved to be excellent timing to take advantage of the sport utility vehicle boom.
Ford also began a comeback after losses of $3.3 billion in the early 1980s. In 1985, the company introduced the very successful, aerodynamic Taurus.
General Motors, under the leadership of Roger Smith, was not as successful as its competitors in turning itself around, and its market share fell significantly. While Ford and Chrysler were cutting production costs, GM was investing heavily in new technology.
The company's attempts at overhauling its management structure and using increased technology for manufacturing production were not successful. Several large acquisitions (Electronic Data Systems and Hughes Aircraft Company) also diverted management attention away from their main industry.
(Ford and Chrysler also joined in the acquisition and diversification trend, with Ford buying Jaguar Cars, Aston Martin, The Associates (a finance company), and First Nationwide Financial Corp. (a savings and loan).
Chrysler purchased Lamborghini, an interest in Maserati, and Gulfstream Aerospace jets.)
GM started the Saturn brand in the late 1980s as a way to retake sales from imported cars. While Saturn initially succeeded, GM later neglected to provide it much support. Around this time GM also began development on the General Motors EV1 electric car, which debuted in 1996.
1990s:
The 1990s began the decade in a recession, which resulted in weak auto sales and operating losses. In addition, the Invasion of Kuwait by Iraq caused a temporary jump in oil prices.
However, the automakers recovered fairly quickly. In the mid-1990s, light truck sales (which included Sport utility vehicles, Pickup trucks and Minivans) began to rise sharply.
Due to the Corporate Average Fuel Economy standards differentiating between passenger cars and light trucks, the automakers were able to sell large and heavy vehicles without fear of the CAFE fines. Low oil prices also gave incentives for consumers to buy these gas-guzzling vehicles. The American automakers sold combined, and even separately, millions of pickup trucks and body-on-frame SUVs during this period. Imports such as the Toyota 4Runner, Land Cruiser, Tacoma, and Nissan Pathfinder and Frontier were also popular during this time period.
The automakers also continued their trend of purchasing or investing in foreign automakers. GM purchased a controlling interest in Saab in 1990 and Daewoo Motors in 2001, and invested in Subaru in 1999 and Fiat in 2000. They also purchased the Hummer name from AM General in 1998.
Ford purchased Volvo in 1999 and Land Rover in 2000. GM and Ford also established joint ventures with Chinese auto companies during this period:
While the American automakers were investing in or buying foreign competitors, the foreign automakers continued to establish more production facilities in the United States. In the 1990s, BMW and Daimler-Benz opened SUV factories in Spartanburg County, South Carolina and Tuscaloosa County, Alabama, respectively.
In the 2000s, the following assembly plants were opened:
Toyota opened an engine plant in Huntsville, Alabama in 2003 (along with a truck assembly plant in San Antonio, Texas) and is building an assembly plant in Blue Springs, Mississippi.
Volkswagen has announced a new plant for Chattanooga, Tennessee. Also, several of the Japanese auto manufacturers expanded or opened additional plants during this period. For example, while new, the Alabama Daimler-Benz and Honda plants have expanded several times since their original construction.
The opening of Daimler-Benz plant in the 1990s had a cascade effect. It created a hub of new sub-assembly suppliers in the Alabama area. This hub of sub-assemblies suppliers helped in attracting several new assembly plants into Alabama plus new plants in nearby Mississippi, Georgia and Tennessee.
In 1998, Chrysler and the German automaker Daimler-Benz entered into a "merger of equals" although in reality it turned out be an acquisition by Daimler-Benz. Thus the Big Three American-owned automakers turned into the Big Two automakers.
However, a culture clash emerged between the two divisions, and there was an exodus of engineering and manufacturing management from the Chrysler division. The Chrysler division struggled financially, with only a brief recovery when the Chrysler 300 was introduced.
In 2007, Daimler-Benz sold the company to a private equity firm, Cerberus Capital Management, thus again making it American-owned.
2000s:
See also: Effects of the 2008–10 automotive industry crisis on the United States
The 2000s began with a recession in early 2001 and the effects of the September 11 attacks, significantly affecting auto industry sales and profitability. The stock market decline affected the pension fund levels of the automakers, requiring significant contributions to the funds by the automakers (with GM financing these contributions by raising debt).
In 2001, Chrysler discontinued their Plymouth brand, and in 2004 GM ended their Oldsmobile division.
In 2005, oil prices began rising and peaked in 2008. With the American automakers heavily dependent upon the gas-guzzling light truck sales for their profits, their sales fell sharply.
Additionally, the finance subsidiaries of the Big Three became of increasing importance to their overall profitability (and their eventual downfall). GMAC (now Ally Financial), began making home mortgage loans, especially subprime loans. With the subsequent collapse of the sub-prime mortgage industry, GM suffered heavy losses.
The Automotive industry crisis of 2008–10 happened when the Big Three were in weak financial condition and the beginning of an economic recession, and the financial crisis resulted in the automakers looking to the federal government for help.
Ford was in the best position, as under new CEO Alan Mulally they had fortuitously raised $23 billion in cash in 2006 by mortgaging most of their assets.
Chrysler, purchased in 2007 by a private equity firm, had weak financial backing, was the most heavily dependent on light truck sales, and had few new products in their pipeline.
General Motors was highly leveraged, also heavily dependent on light truck sales, and burdened by high health care costs.
The CEOs of the Big Three requested government aid in November 2008, but sentiment in Congress was against the automakers, especially after it was revealed that they had flown to Washington D.C. on their private corporate jets.
In December 2008, President Bush gave $17.4 billion to GM and Chrysler from the Troubled Asset Relief Program as temporary relief for their cash flow problems.
Several months later, President Obama formed the Presidential Task Force on the Auto Industry to decide how to handle GM and Chrysler. Chrysler received a total of $12.5 billion in TARP funds and entered Chapter 11 bankruptcy in April 2009.
Automaker Fiat was given management control and a 20% ownership stake (adjusted to 35% under certain conditions), the U.S. and Canadian governments were given a 10% holding, and the remaining ownership was given to a Voluntary Employee Beneficiary Association (VEBA), which was a trust fund established to administer employee health care benefits.
The Automotive Task Force requested that GM CEO Rick Wagoner resign (although he was replaced by another long-time GM executive, Frederick Henderson). GM received a total of $49.5 billion in TARP funds and entered Chapter 11 bankruptcy in June 2009. The U.S. and Canadian governments received a 72.5% ownership stake, a VEBA received 17.5%, and the unsecured creditors received 10%.
As part of the bailout GM and Chrysler closed numerous production plants and eliminated hundreds of dealerships and thousands of jobs. They also required a number of major labor union concessions.
GM also sold off the Saab division and eliminated the Pontiac, Hummer, and Saturn Corporation brands. In addition to the $62 billion that the automakers received from TARP, their financing arms, Ally Financial and TD Auto Finance received an additional $17.8 billion.
In addition to the funding from the United States government, the Canadian government provided $10.8 billion to GM and $2.9 billion to Chrysler as incentives to maintain production facilities in Canada.
Ford did not request any government assistance, but as part of their downsizing sold Volvo in 2010 and phased out their Mercury division in 2011. (They had previously sold Aston Martin in 2007, and Land Rover and Jaguar Cars in 2008). Under the Advanced Technology Vehicles Manufacturing Loan Program Ford borrowed $5.9 billion to help their vehicles meet higher mileage requirements.
2010s:
Ford went through 2012 having recovered to the point of having 80,000 total U.S. employees, supplying their 3,300 dealerships. In comparison, Chrysler had 71,100 U.S. employees supplying their 2,328 dealerships during that year.
Data for the beginning of 2014 put the four companies of GM, Ford, Toyota, and Chrysler, in that order, at the top as having the most U.S. car sales. In terms of specific types of vehicles, the new decade has meant Chrysler having an emphasis on its Ram trucks and the Jeep Cherokee SUV, both of which had "hefty sales" for 2014 according to a news report.
In 2017, it is reported that auto makers spent more on incentives, US$3,830 per vehicle sold, than labor, which is estimated to be less than US$2,500 per vehicle.
In 2017, General Motors sold its European brands, Opel and Vauxhall, to Groupe PSA due to low profits. It also announced the closure of the Holden plant in Australia, making Holden an import brand. In 2019, General Motors closed 5 plants. It also pulled out of Uzbekistan.
Near the end of the decade, it became clear that the market now has a preference for crossover SUVs over passenger cars.
In 2016, Fiat Chrysler announced that it would be discontinuing the Dodge Dart and Chrysler 200 sedans. CEO Sergio Marchionne said that, even though they were good cars, they were the least financially rewarding investments the company has made recently.
Ford, in 2018, announced that it will be discontinuing all of its passenger cars save for the Ford Mustang, and the Ford Focus would come back as a crossover-hatchback vehicle. General Motors followed by saying it would not follow Ford, however, backtracked on that and announced that it would be discontinuing most of its passenger cars by 2022.
2020s:
In 2020, General Motors announced the end of Holden and will leave Australia and New Zealand by 2021. General Motors has also announced its exit from the Thailand market and plans to sell their Rayong plant.
See also:
World-wide Automotive Industry.
The automotive industry comprises a wide range of companies and organizations involved in the design, development, manufacturing, marketing, and selling of motor vehicles It is one of the world's largest industries by revenue.
The automotive industry does not include industries dedicated to the maintenance of automobiles following delivery to the end-user, such as automobile repair shops and motor fuel filling stations.
The word automotive comes from the Greek autos (self), and Latin motivus (of motion), referring to any form of self-powered vehicle. This term, as proposed by Elmer Sperry (1860-1930), first came into use with reference to automobiles in 1898.
Click on any of the following blue hyperlinks for more about the World-wide Automotive Industry:
- History
- Safety
- Economy
- World motor vehicle production
- Notable company relationships
- Top vehicle manufacturing groups by volume
- See also:
- Alliance of Automobile Manufacturers
- Automotive industry crisis of 2008–2010
- Big Three (automobile manufacturers)
- Effects of the 2008–10 automotive industry crisis on the United States
- List of countries by motor vehicle production
- Motocycle
- List of largest automotive companies by revenue
- Media related to Automotive industry at Wikimedia Commons
- Alliance of Automobile Manufacturers
Automotive industry in the United States:
Main articles:
- Automobile,
- Automobile Industry,
- Driving license in the United States,
- and Transport in the United States
The automotive industry in the United States began in the 1890s and, as a result of the size of the domestic market and the use of mass production, rapidly evolved into the largest in the world.
However, the United States was overtaken by Japan as the largest automobile producer in the 1980s, and subsequently by China in 2008. The U.S. is currently second among the largest manufacturer(s) in the world by volume.
The American manufactures produce approximately 8–10 million units annually. Notable exceptions were 5.7 million automobiles manufactured in 2009 (due to crisis), while production peaked during the 1970s and early 2000s at levels of 13–15 million units.
Starting with Duryea in 1895, at least 1900 different companies were formed, producing over 3,000 makes of American automobiles. World War I (1917–1918) and the Great Depression in the United States (1929–1939) combined to drastically reduce the number of both major and minor producers.
During World War II, all the auto companies switched to making military equipment and weapons. However, by the end of the next decade the remaining smaller producers disappeared or merged into amalgamated corporations.
The industry was dominated by three large companies: General Motors, Ford, and Chrysler, all based in Metro Detroit. Those " Big Three" continued to prosper, and the U.S. produced three quarters of all automobiles in the world by 1950 (8.0 million out of 10.6 million). Imports from abroad were a minor factor before the 1960s.
Beginning in the 1970s, a combination of high oil prices and increased competition from foreign auto manufacturers severely affected the companies. In the ensuing years, the companies periodically bounced back, but by 2008 the industry was in turmoil due to the aforementioned crisis.
As a result, General Motors and Chrysler filed for bankruptcy reorganization and were bailed out with loans and investments from the federal government. But according to Autodata Corp, June 2014 seasonally adjusted annualized sales is the biggest in history with 16.98 million vehicles and toppled previous record in July 2006.
Prior to the 1980s, most manufacturing facilities were owned by the Big Three (GM, Ford, Chrysler) and AMC. Their U.S. market share has dropped steadily as numerous foreign-owned car companies have built factories in the U.S. Toyota had 31,000 direct employees in the U.S. in 2012, meaning a total payroll of about $2.1 billion, compared to Ford's 80,000 U.S. employees supplying their 3,300 dealerships and Chrysler's 71,100 U.S. employees supplying their 2,328 dealerships.
Development history:
See also: History of the automobile
Production:
See also: U.S. Automobile Production Figures
The development of self-powered vehicles was accompanied by numerous technologies and components giving rise to numerous supplier firms and associated industries. Various types of energy sources were employed by early automobiles including steam, electric, and gasoline.
Thousands of entrepreneurs were involved in developing, assembling, and marketing of early automobiles on a small and local scale. Increasing sales facilitated production on a larger scale in factories with broader market distribution. Ransom E. Olds and Thomas B. Jeffery began mass production of their automobiles. Henry Ford focused on producing an automobile that many middle class Americans could afford.
Originally purchased by wealthy individuals, by 1916 cars began selling at $875. Soon, the market widened with the mechanical betterment of the cars, the reduction in prices, as well as the introduction of installment sales and payment plans.
During the period from 1917 to 1926, the annual rate of increase in sales was considerably less than from 1903 to 1916. In the years 1918, 1919, 1921, and 1924 there were absolute declines in automotive production.
The automotive industry caused a massive shift in the industrial revolution because it accelerated growth by a rate never before seen in the U.S. economy. The combined efforts of innovation and industrialization allowed the automotive industry to take off during this period and it proved to be the backbone of United States manufacturing during the 20th century.
American road system
See also: Interstate Highway System
The practicality of the automobile was initially limited because of the lack of suitable roads. Travel between cities was mostly done by railroad, waterways, or carriages. Roads were mostly dirt and hard to travel, particularly in bad weather.
The League of American Wheelmen maintained and improved roads as it was viewed as a local responsibility with limited government assistance. During this time, there was an increase in production of automobiles coupled with a swell of auto dealerships, marking their growth in popularity.
State involvement:
State governments began to use the corvee system to maintain roads, an implementation of required physical labor on a public project on the local citizens. Part of their motivation was the needs of farmers in rural areas attempting to transport their goods across rough, barely functioning roads (article).
The other reason was the weight of the wartime vehicles. The materials involved altered during World War I to accommodate the heavier trucks on the road and were responsible for widespread shift to macadam highways and roadways.
However, rural roads were still a problem for military vehicles, so four wheel drive was developed by automobile manufacturers to assist in powering through. As the prevalence of automobiles grew, it became clear funding would need to improve as well and the addition of government financing reflected that change.
Federal involvement:
The Federal Aid Road Act of 1916 allocated $75 million for building roads. It was also responsible for approving a refocusing of military vehicles to road maintenance equipment. It was followed by the Federal Aid Highway Act of 1921 provided additional funding for road construction. By 1924, there were 31,000 miles of paved road in the U.S
Click here for a graphical comparison on International trade.
The Big Three automakers:
See also:
About 3,000 automobile companies have existed in the United States.
In the early 1900s, the U.S. saw the rise of the Big Three automakers; Ford, GM, and Chrysler. The industry became centered around Detroit, in Michigan, and adjacent states (and nearby Ontario, Canada).
Historian John Rae summarizes the explanations provided by historians: a central geographic location, water access, and an established industrial base with many skilled engineers. The key factor was that Detroit was the base for highly talented entrepreneurs who saw the potential of the automobile:
- Henry Ford,
- Ransom E. Olds,
- Roy D. Chapin,
- Henry Joy,
- William C. Durant,
- Howard E. Coffin,
- John Dodge and Horace Dodge,
- and Benjamin Briscoe and Frank Briscoe.
From 1900 to 1915 these men transformed the fledgling industry into an international business.
Henry Ford began building cars in 1896 and started his own company in 1903. The Ford Motor Company improved mass-production with the first conveyor belt-based assembly line in 1913, producing the Model T (which had been introduced in 1908). These assembly lines significantly reduced costs. The first models were priced at $850, but by 1924 had dropped to $290. The Model T sold extremely well and Ford became the largest automobile company in the U.S. By the time it was retired in 1927, more than 15 million Model Ts had been sold.
Ford introduced the Model A in 1927 (after a six-month production stoppage to convert from the Model T), and produced it through 1931. However, while the Model A was successful, Ford lost ground to GM and eventually Chrysler, as auto buyers looked to more upscale cars and newer styling.
Ford was also a pioneer in establishing foreign manufacturing facilities, with production facilities created in England in 1911, and Germany and Australia in 1925. Ford purchased the luxury Lincoln automaker in 1922 and established the Mercury division in 1938.
General Motors Corporation (GM), the company that would soon become the world's largest automaker, was founded in 1908 by William Durant. Durant had previously been a carriage maker, and had taken control of Buick in 1904. The company initially acquired Buick, Oldsmobile and Oakland (later to become Pontiac) in 1908.
The next year GM acquired Cadillac, along with a number of other car companies and parts suppliers. Durant also was interested in acquiring Ford, but after initial merger talks, Henry Ford decided to keep his company independent.
In 1910, Durant lost control of GM after over-extending the company with its acquisitions. A group of banks took over control of GM and ousted Durant.
Durant and Louis Chevrolet founded Chevrolet in 1913 and it quickly became very successful. Durant began acquiring stock in GM and by 1915 had majority control. Chevrolet was acquired by GM in 1917 and Durant was back in charge of GM. In 1921, Durant was again forced out of the company.
During the late 1920s, General Motors overtook Ford to become the largest automaker. Under the leadership of Alfred P. Sloan, General Motors instituted decentralized management and separate divisions for each price class.
They also introduced annual model changes. GM also became an innovator in technology under the leadership of Charles F. Kettering. GM followed Ford by expanding overseas, including purchasing England's Vauxhall Motors in 1925, Germany's Opel in 1929, and Australia's Holden in 1931. GM also established GMAC (now Ally Financial) in 1919 to provide credit for buyers of its cars.
Walter Chrysler was formerly president of Buick and an executive of GM. After leaving GM in 1920, he took control of the Maxwell Motor Company, revitalized the company and, in 1925, reorganized it into Chrysler Corporation. He then acquired Dodge in 1927. The acquisition of Dodge gave Chrysler the manufacturing facilities and dealer network that it needed to significantly expand production and sales.
In 1928, Chrysler introduced the Plymouth and DeSoto brands. Chrysler also overtook Ford to become the second largest auto maker by the 1930s, following similar strategies as General Motors.
General Motors wanted automobiles to be not just utilitarian devices, which Ford emphasized, but also status symbols that were highly visible indicators of an individual's wealth. Through offering different makes and models they offered different levels in social status meeting the demands of consumers needing to display wealth.
Ford and General Motors each had their own impact on social status and the type of market they were targeting. Henry Ford focused on delivering one inexpensive, efficient product for the masses. Ford's offer was one car, one color, for one price. He not only manufactured a product for the masses, but he provided a $5 a day wage so that there was a local market to buy this product.
By contrast General Motors offered a product that catered to those looking to gain status by having that sense of individualism and offering different make, models, and quality.
Great Depression and World War II:
The 1930s saw the demise of many auto makers due to the economic effects of the Great Depression, stiff competition from the Big Three, and/or mismanagement.
Luxury car makers were particularly affected by the economy, with companies like the following going out of business:
- Stutz Motor Company,
- Pierce-Arrow Motor Car Company,
- Peerless Motor Company,
- Cunningham, and the Marmon Motor Car Company
The decade also saw several companies with innovative engineering, such as the Doble Steam Motors Corporation (advanced steam engines) and Franklin Automobile Company (air-cooled aluminum engines) going out of business.
Errett Lobban Cord, who controlled the Auburn Automobile Company (which also sold the Cord) and the Duesenberg Motor Company, was under investigation by the Securities and Exchange Commission and the Internal Revenue Service. His auto empire collapsed in 1937 and production ceased.
Major technological innovations were introduced or were widely adopted during the 1930s, such as:
- synchromesh manual transmissions,
- semi-automatic transmissions,
- automatic transmissions,
- hydraulic brakes,
- independent front suspension,
- and overhead-valve engines.
The Cord 810 used front-wheel drive, had hidden headlights, and was offered with a supercharger. Exterior styling designs were more flowing, as shown most noticeably on the Auburn Speedster and the Cord 810/812.
Radical air-streamed design was introduced on the Chrysler Airflow, a sales flop, and the Lincoln-Zephyr (both of which used unit-body construction). Packard introduced their "Air Cool-ditioned" car in 1940.
When World War II started in 1939, the economy speeded up. After the U.S. entered the war in December 1941, all auto plants were converted to war production, including jeeps, trucks, tanks, and aircraft engines; all passenger automobile production ceased by February 1942.
The industry received $10 billion in war-related orders by that month, compared to $4 billion three months before. All factories were enlarged and converted, many new ones such as Ford's Willow Run and Chrysler's Detroit Arsenal Tank Plant were built, and hundreds of thousands more workers were hired. Many were new arrivals from Appalachia.
The most distinctive new product was the Jeep, with Willys making 352,000 and Ford another 295,000.
The industry produced an astonishing amount of material, including 5.9 million weapons, 2.8 million tanks and trucks, and 27,000 aircraft. This production was a major factor in the victory of the allies. Experts anticipated that Detroit would learn advanced engineering methods from the aviation industry that would result in great improvements for postwar civilian automobiles.
Unionization of the auto manufacturers workforce:
See also: United Automobile Workers
Due to the difficult working conditions in the auto production plants, auto workers began to seek representation to help improve conditions and ensure fair pay.
The United Automobile Workers union won recognition from GM and Chrysler in 1937, and Ford in 1941. In 1950, the automakers granted workers a company-paid pension to those 65 years old and with 30 years seniority.
In the mid-1950s, the automakers agreed to set up a trust fund for unemployed auto workers. In 1973, the automakers agreed to offer pensions to any worker with 30 years seniority, regardless of age. By then the automakers had also agreed to cover the entire health insurance bill for its employees, survivors, and retirees.
Decline of the independent automakers:
The only major auto companies to survive the Great Depression were:
- General Motors Corporation,
- Ford Motor Company,
- Chrysler Corporation,
- Hudson Motor Car Company,
- Nash-Kelvinator Corporation,
- Packard Motor Car Company,
- Studebaker Corporation,
- and Crosley Motors.
The former three companies, known as the Big Three, enjoyed significant advantages over the smaller independent auto companies due to their financial strength, which gave them a big edge in marketing, production, and technological innovation. Most of the Big Three's competitors ended production by the 1960s, and their last major domestic competitor was acquired in the 1980s.
Crosley Motors ceased auto production in 1952. Packard and Studebaker merged in 1954, but ended production of Packard-branded cars in 1958 and ceased all auto production in 1966.
Kaiser-Frazer Corporation was started in 1945 and acquired Willys-Overland Motors (maker of the Jeep) in 1953. Production of passenger cars was discontinued in 1955. In 1970, the company was sold to American Motors Corporation.
In 1954, Nash-Kelvinator and Hudson merged to form American Motors Corporation (AMC). The company introduced numerous product and marketing innovations, but its small size made it difficult to compete with the Big Three and struggled financially.
The French auto maker Renault took control of AMC in the early 1980s, but financial difficulties continued and AMC was purchased by Chrysler Corporation in 1987.
Periodically, other entrepreneurs would found automobile companies, but most would soon fail and none achieved major sales success. Some of the best known included:
- Preston Tucker's 1948 sedan,
- Earl Muntz's Muntz Car Company,
- Malcolm Bricklin's Bricklin SV-1,
- the modern Stutz Blackhawk,
- Clénet Coachworks,
- Zimmer,
- Excalibur,
- and John DeLorean's DeLorean.
Post-war years:
See also:
Initial auto production after World War II was slowed by the retooling process, shortages of materials, and labor unrest. However, the American auto industry reflected the post-war prosperity of the late-1940s and the 1950s. Cars grew in overall size, as well as engine size during the 1950s.
The Overhead valve V-8 engine developed by GM in the late-1940s proved to be very successful and helped ignite the horsepower race, the second salvo of which was Chrysler's 1951 Hemi engine.
Longer, lower, and wider tended to be the general trend. Exterior styling was influenced by jets and rockets as the space-age dawned. Rear fins were popular and continued to grow larger, and front bumpers and taillights were sometimes designed in the shape of rockets.
Chrome plating was very popular, as was two-tone paint. The most extreme version of these styling trends were found in the 1959 Cadillac Eldorado and Chrysler Corporation's 1957 Imperial. The Chevrolet Corvette and the Ford Thunderbird, introduced in 1953 and 1955 respectively, were designed to capture the sports car market.
However, the Thunderbird grew in size in 1958 and evolved into a personal luxury car. The 1950s were also noted for perhaps one of the biggest miscues in auto marketing with the Ford Edsel, which was the result of unpopular styling and being introduced during an economic recession.
The introduction of the Interstate Highway System (see next topic) and the suburbanization of America made automobiles more necessary and helped change the landscape and culture in the United States.
Individuals began to see the automobile as an extension of themselves.
1960s:
Big changes were taking place in automobile development in the 1960s, with the Big Three dominating the industry. Meanwhile, with the passage of the $33 billion Federal Aid Highway Act of 1956, a network of regional and interstate roads continued to enhance transportation. As urban areas became more congested, more families migrated to the suburbs. Between 1960 and 1970, 70 percent of the population's growth occurred in the suburbs.
Imported vehicles grew during the 1950s and 1960s – from a very low base. In 1966, the Big Three (GM, Ford, Chrysler) had market share of 89.6% (44.5% in 2014). From 1966 to 1969, net imports increased at an average annual rate of 84%. The Volkswagen Beetle was the biggest seller.
The compact Nash Rambler had been around since 1950, and American Motors Corporation (AMC) expanded into a range of smaller cars than were offered by the Big Three.
By 1960, Rambler was the third most popular brand of automobile in the United States, behind Ford and Chevrolet. In response to this the domestic auto makers developed compact-sized cars, such as the Ford Falcon, Chevrolet Corvair, Studebaker Lark, and Plymouth Valiant.
The four-seat 1958 Ford Thunderbird (second generation) was arguably the first personal luxury car, which became a large market segment.
Pony cars were introduced with the Ford Mustang in 1964. This car combined sporty looks with a long hood, small rear deck, and a small rear seat. The car proved highly successful and imitators soon arose, including:
- the Chevrolet Camaro,
- Pontiac Firebird,
- Plymouth Barracuda (actually introduced two weeks prior to the Mustang),
- AMC Javelin,
- and the two-seat AMX,
- as well as the "luxury" version of the Mustang, the Mercury Cougar.
Muscle cars were also introduced in 1964 with the Pontiac GTO. These combined an intermediate-sized body with a large high-output engine.
Competitors were also quickly introduced, including:
- the Chevrolet Chevelle SS,
- Dodge R/T (Coronet and Charger),
- Plymouth Road Runner/GTX,
- Ford Torino,
- and AMC's compact SC/Rambler.
Muscle cars reached their peak in the late-1960s, but soon fell out of favor due to high insurance premiums along with the combination of emission controls and high gas prices in the early 1970s.
While the personal luxury, pony, and muscle cars got most of the attention, the full sized cars formed the bulk of auto sales in the 1960s, helped by low oil prices. The styling excesses and technological gimmicks (such as the retractable hardtop and the pushbutton automatic transmission) of the 1950s were de-emphasized. The rear fins were downsized and largely gone by the mid-1960s, as was the excessive chrome.
Federal regulation of the auto industry:
Safety and environmental issues during the 1960s led to stricter government regulation of the auto industry, spurred in part by Ralph Nader and his book: Unsafe at Any Speed: The Designed-in Dangers of the American Automobile. This resulted in higher costs and eventually to weaker performance for cars in the 1970s, a period known as the Malaise Era of auto design during which American cars suffered from very poor performance.
Seat lap belts were mandated by many states effective in 1962. Under the National Traffic and Motor Vehicle Safety Act of 1966, Federal Motor Vehicle Safety Standards required shoulder belts for front passengers, front head restraints, energy-absorbing steering columns, ignition-key warning systems, anti-theft steering column/transmission locks, side marker lights and padded interiors starting in 1968.
Beginning in 1972, bumpers were required to be reinforced to meet 5-mph impact standards, a decision that was revised in 1982.
With the Clean Air Act (United States) of 1963 and the Vehicle Air Pollution and Control Act of 1965, emission controls began being instituted in 1968. The use of leaded gasoline began being curtailed in the early 1970s, which resulted in lower-compression engines being used, and thus reducing horsepower and performance. Catalytic converters began being widely used by the mid-1970s.
During his first term as EPA Administrator, William Ruckelshaus spent 60% of his time on the automobile industry, whose emissions were to be reduced 90% under the 1970 Clean Air Act after senators became frustrated at the industry's failure to cut emissions under previous, weaker air laws.
1970s:
As bold and confident as the Big Three automakers were in the 1950s and 1960s, the American auto makers in the 1970s and 1980s stumbled badly, going from one engineering, manufacturing, or marketing disaster to another, and this time is often referred to as the Malaise era of American auto design.
By 1969, imports had increased their share of the U.S. auto market with smaller, inexpensive vehicles. Volkswagen sold over 500,000 vehicles, followed by Toyota with over 100,000. In 1986 South Korea entered the American market.
In response to this, the domestic auto makers introduced new compact and sub-compact cars, such as the Ford Pinto and Maverick, the Chevrolet Vega, and the AMC Gremlin, Hornet and Pacer.
(Chrysler had to make do with importing the Dodge Colt from Mitsubishi Motors and the Plymouth Cricket from their affiliated Rootes Group.) However, design and manufacturing problems plagued a number of these cars, leading to unfavorable consumer perceptions.
GM had a string of miscues starting with the Chevrolet Vega, which developed a reputation for rapidly rusting and having major problems with the aluminium engine.
The problems with Ford's Pinto became nationally famous and Ford's reputation was harmed after media accusations that it's fuel system was prone to fire when the car was struck from behind. It was also alleged that Ford knew about this vulnerability but did not design any safeguards in order to save a few dollars per vehicle and that the company rationalized that the cost of lawsuits would be less than the cost of redesigning the car. Historical analysis of the facts don't support the "death trap" reputation attached to the Pinto but the damage to Ford's reputation had been done.
Auto sales were hurt by the 1973 oil crisis Arab embargo as the price of gasoline soared. Small fuel-efficient cars from foreign automakers took a sharply higher share of the U.S. auto sales market.
Under the Energy Policy and Conservation Act the federal government initiated fuel efficiency standards (known as Corporate Average Fuel Economy, or CAFE) in 1975, effective as of 1978 for passenger cars, and as of 1979 for light trucks.
For passenger cars, the initial standard was 18 miles per gallon (mpg), and increased to 27.5 mpg by 1985.
General Motors began responding first to the high gas prices by downsizing most of their models by 1977, and lowering their performance.
In 1979, the second oil price spike occurred, precipitated by political events in Iran, resulting in the 1979 energy crisis. By 1980, the economy slid into turmoil, with high inflation, high unemployment, and high interest rates. The automakers suffered large operating losses.
Chrysler was hurt most severely and in 1979 received a bailout from the federal government in the form of $1.5 billion in loan guarantees. One quick fix was a Detroit-built version of their then-new French (Simca) economy car, the Horizon. As a result of its financial difficulties, Chrysler sold its British and French subsidiaries, Rootes Group and Simca to the French automaker Groupe PSA for $1.
Cadillac damaged their reputation when the four-cylinder Cadillac Cimarron was introduced in 1981 (a gussied-up Chevrolet Cavalier at twice the price) and the "V8-6-4" engine didn't work as advertised.
GM's reputation was also damaged when it revealed in 1977 that they were installing Chevrolet engines in Oldsmobiles, and lawsuits from aggrieved Oldsmobile owners followed.
Likewise litigation ensued when a trio of diesel engines, designed from gasoline engines and used in GM cars from 1978 to 1985 suffered major problems. Class action lawsuits and efforts from the Federal Trade Commission resulted in buybacks of the cars from GM.
Chrysler also suffered damage to its reputation when its compact cars, the Plymouth Volaré and Dodge Aspen, were developed quickly and suffered from massive recalls and poor quality.
1980s:
In 1981, Japanese automakers entered into the "voluntary export restraint" limiting the number of autos that they could export to the U.S. to 1.68 million per year. One side effect of this quota was that Japanese car companies opened new divisions through which they began developing luxury cars that had higher profit margins, such as with Toyota's Lexus, Honda's Acura, and Nissan's Infiniti.
Another consequence was that the Japanese car makers began opening auto production plants in the U.S., with the three largest Japanese auto manufacturers all opening production facilities by 1985. These facilities were opened primarily in the southern states because of financial incentives offered by state governments, access to the nation via the interstate highways, the availability of a large pool of cheaper labor, and the weakness of unions.
The Southern states passed right-to-work laws and the UAW failed in its repeated union-organizing efforts at these plants.
The Big Three began investing in and/or developing joint manufacturing facilities with several of the Japanese automakers
- Ford invested in Mazda as well as setting up a joint facility with them called AutoAlliance International.
- Chrysler bought stock in Mitsubishi Motors and established a joint facility with them called Diamond-Star Motors.
- GM invested in Suzuki and Isuzu Motors, and set up a joint manufacturing facility with Toyota, called NUMMI (New United Motor Manufacturing, Inc.).
Despite the financial and marketing upheavals during the 1970s and 1980s, these decades led to technological innovations and/or widespread use of such improvements as:
- disc brakes,
- fuel injection,
- electronic engine control units,
- and electronic ignition.
- Front-wheel drive became the standard drive system by the late 1980s.
By the mid-1980s, oil prices had fallen sharply, helping lead to the revitalization of the American auto industry.
Under the leadership of Lee Iacocca, Chrysler Corporation mounted a comeback after its flirtation with bankruptcy in 1979. The minivan was introduced in the 1984 model year by Chrysler with the Plymouth Voyager and Dodge Caravan, and proved very popular. These vehicles were built on a passenger-car chassis and seated up to seven people as well as being able to hold bulky loads. Chrysler also introduced their "K-cars" in the 1980s, which came with front-wheel drive and fuel-efficient OHC engines.
In 1987, Chrysler bought American Motors Corporation, which produced the Jeep. This proved to be excellent timing to take advantage of the sport utility vehicle boom.
Ford also began a comeback after losses of $3.3 billion in the early 1980s. In 1985, the company introduced the very successful, aerodynamic Taurus.
General Motors, under the leadership of Roger Smith, was not as successful as its competitors in turning itself around, and its market share fell significantly. While Ford and Chrysler were cutting production costs, GM was investing heavily in new technology.
The company's attempts at overhauling its management structure and using increased technology for manufacturing production were not successful. Several large acquisitions (Electronic Data Systems and Hughes Aircraft Company) also diverted management attention away from their main industry.
(Ford and Chrysler also joined in the acquisition and diversification trend, with Ford buying Jaguar Cars, Aston Martin, The Associates (a finance company), and First Nationwide Financial Corp. (a savings and loan).
Chrysler purchased Lamborghini, an interest in Maserati, and Gulfstream Aerospace jets.)
GM started the Saturn brand in the late 1980s as a way to retake sales from imported cars. While Saturn initially succeeded, GM later neglected to provide it much support. Around this time GM also began development on the General Motors EV1 electric car, which debuted in 1996.
1990s:
The 1990s began the decade in a recession, which resulted in weak auto sales and operating losses. In addition, the Invasion of Kuwait by Iraq caused a temporary jump in oil prices.
However, the automakers recovered fairly quickly. In the mid-1990s, light truck sales (which included Sport utility vehicles, Pickup trucks and Minivans) began to rise sharply.
Due to the Corporate Average Fuel Economy standards differentiating between passenger cars and light trucks, the automakers were able to sell large and heavy vehicles without fear of the CAFE fines. Low oil prices also gave incentives for consumers to buy these gas-guzzling vehicles. The American automakers sold combined, and even separately, millions of pickup trucks and body-on-frame SUVs during this period. Imports such as the Toyota 4Runner, Land Cruiser, Tacoma, and Nissan Pathfinder and Frontier were also popular during this time period.
The automakers also continued their trend of purchasing or investing in foreign automakers. GM purchased a controlling interest in Saab in 1990 and Daewoo Motors in 2001, and invested in Subaru in 1999 and Fiat in 2000. They also purchased the Hummer name from AM General in 1998.
Ford purchased Volvo in 1999 and Land Rover in 2000. GM and Ford also established joint ventures with Chinese auto companies during this period:
- GM's joint ventures are with:
- Ford's joint ventures are with Chang'an Ford and Jiangling Ford.
While the American automakers were investing in or buying foreign competitors, the foreign automakers continued to establish more production facilities in the United States. In the 1990s, BMW and Daimler-Benz opened SUV factories in Spartanburg County, South Carolina and Tuscaloosa County, Alabama, respectively.
In the 2000s, the following assembly plants were opened:
- by Honda in Lincoln, Alabama,
- Nissan in Canton, Mississippi,
- Hyundai in Montgomery, Alabama and Kia in West Point, Georgia.
Toyota opened an engine plant in Huntsville, Alabama in 2003 (along with a truck assembly plant in San Antonio, Texas) and is building an assembly plant in Blue Springs, Mississippi.
Volkswagen has announced a new plant for Chattanooga, Tennessee. Also, several of the Japanese auto manufacturers expanded or opened additional plants during this period. For example, while new, the Alabama Daimler-Benz and Honda plants have expanded several times since their original construction.
The opening of Daimler-Benz plant in the 1990s had a cascade effect. It created a hub of new sub-assembly suppliers in the Alabama area. This hub of sub-assemblies suppliers helped in attracting several new assembly plants into Alabama plus new plants in nearby Mississippi, Georgia and Tennessee.
In 1998, Chrysler and the German automaker Daimler-Benz entered into a "merger of equals" although in reality it turned out be an acquisition by Daimler-Benz. Thus the Big Three American-owned automakers turned into the Big Two automakers.
However, a culture clash emerged between the two divisions, and there was an exodus of engineering and manufacturing management from the Chrysler division. The Chrysler division struggled financially, with only a brief recovery when the Chrysler 300 was introduced.
In 2007, Daimler-Benz sold the company to a private equity firm, Cerberus Capital Management, thus again making it American-owned.
2000s:
See also: Effects of the 2008–10 automotive industry crisis on the United States
The 2000s began with a recession in early 2001 and the effects of the September 11 attacks, significantly affecting auto industry sales and profitability. The stock market decline affected the pension fund levels of the automakers, requiring significant contributions to the funds by the automakers (with GM financing these contributions by raising debt).
In 2001, Chrysler discontinued their Plymouth brand, and in 2004 GM ended their Oldsmobile division.
In 2005, oil prices began rising and peaked in 2008. With the American automakers heavily dependent upon the gas-guzzling light truck sales for their profits, their sales fell sharply.
Additionally, the finance subsidiaries of the Big Three became of increasing importance to their overall profitability (and their eventual downfall). GMAC (now Ally Financial), began making home mortgage loans, especially subprime loans. With the subsequent collapse of the sub-prime mortgage industry, GM suffered heavy losses.
The Automotive industry crisis of 2008–10 happened when the Big Three were in weak financial condition and the beginning of an economic recession, and the financial crisis resulted in the automakers looking to the federal government for help.
Ford was in the best position, as under new CEO Alan Mulally they had fortuitously raised $23 billion in cash in 2006 by mortgaging most of their assets.
Chrysler, purchased in 2007 by a private equity firm, had weak financial backing, was the most heavily dependent on light truck sales, and had few new products in their pipeline.
General Motors was highly leveraged, also heavily dependent on light truck sales, and burdened by high health care costs.
The CEOs of the Big Three requested government aid in November 2008, but sentiment in Congress was against the automakers, especially after it was revealed that they had flown to Washington D.C. on their private corporate jets.
In December 2008, President Bush gave $17.4 billion to GM and Chrysler from the Troubled Asset Relief Program as temporary relief for their cash flow problems.
Several months later, President Obama formed the Presidential Task Force on the Auto Industry to decide how to handle GM and Chrysler. Chrysler received a total of $12.5 billion in TARP funds and entered Chapter 11 bankruptcy in April 2009.
Automaker Fiat was given management control and a 20% ownership stake (adjusted to 35% under certain conditions), the U.S. and Canadian governments were given a 10% holding, and the remaining ownership was given to a Voluntary Employee Beneficiary Association (VEBA), which was a trust fund established to administer employee health care benefits.
The Automotive Task Force requested that GM CEO Rick Wagoner resign (although he was replaced by another long-time GM executive, Frederick Henderson). GM received a total of $49.5 billion in TARP funds and entered Chapter 11 bankruptcy in June 2009. The U.S. and Canadian governments received a 72.5% ownership stake, a VEBA received 17.5%, and the unsecured creditors received 10%.
As part of the bailout GM and Chrysler closed numerous production plants and eliminated hundreds of dealerships and thousands of jobs. They also required a number of major labor union concessions.
GM also sold off the Saab division and eliminated the Pontiac, Hummer, and Saturn Corporation brands. In addition to the $62 billion that the automakers received from TARP, their financing arms, Ally Financial and TD Auto Finance received an additional $17.8 billion.
In addition to the funding from the United States government, the Canadian government provided $10.8 billion to GM and $2.9 billion to Chrysler as incentives to maintain production facilities in Canada.
Ford did not request any government assistance, but as part of their downsizing sold Volvo in 2010 and phased out their Mercury division in 2011. (They had previously sold Aston Martin in 2007, and Land Rover and Jaguar Cars in 2008). Under the Advanced Technology Vehicles Manufacturing Loan Program Ford borrowed $5.9 billion to help their vehicles meet higher mileage requirements.
2010s:
Ford went through 2012 having recovered to the point of having 80,000 total U.S. employees, supplying their 3,300 dealerships. In comparison, Chrysler had 71,100 U.S. employees supplying their 2,328 dealerships during that year.
Data for the beginning of 2014 put the four companies of GM, Ford, Toyota, and Chrysler, in that order, at the top as having the most U.S. car sales. In terms of specific types of vehicles, the new decade has meant Chrysler having an emphasis on its Ram trucks and the Jeep Cherokee SUV, both of which had "hefty sales" for 2014 according to a news report.
In 2017, it is reported that auto makers spent more on incentives, US$3,830 per vehicle sold, than labor, which is estimated to be less than US$2,500 per vehicle.
In 2017, General Motors sold its European brands, Opel and Vauxhall, to Groupe PSA due to low profits. It also announced the closure of the Holden plant in Australia, making Holden an import brand. In 2019, General Motors closed 5 plants. It also pulled out of Uzbekistan.
Near the end of the decade, it became clear that the market now has a preference for crossover SUVs over passenger cars.
In 2016, Fiat Chrysler announced that it would be discontinuing the Dodge Dart and Chrysler 200 sedans. CEO Sergio Marchionne said that, even though they were good cars, they were the least financially rewarding investments the company has made recently.
Ford, in 2018, announced that it will be discontinuing all of its passenger cars save for the Ford Mustang, and the Ford Focus would come back as a crossover-hatchback vehicle. General Motors followed by saying it would not follow Ford, however, backtracked on that and announced that it would be discontinuing most of its passenger cars by 2022.
2020s:
In 2020, General Motors announced the end of Holden and will leave Australia and New Zealand by 2021. General Motors has also announced its exit from the Thailand market and plans to sell their Rayong plant.
See also:
- Big Three automobile manufacturers
- 1950s American automobile culture
- American automobile industry in the 1950s
- Canada–United States Automotive Products Agreement
- Effects of the 2008–10 automotive industry crisis on the United States
- Good Roads Movement
- History of Chrysler
- History of Ford Motor Company
- History of General Motors
- List of defunct automobile manufacturers of the United States
- Passenger vehicles in the United States
- Effects of the car on societies
- Air pollution
- Automobile dependency
- Automobile safety
- Car costs
- Car-free movement
- Compact City
- Congestion pricing
- Environmental impact of transport
- Externalities of automobiles
- Freeway and expressway revolts
- Green vehicle
- Jaywalking
- Motor vehicle fatality rate in U.S. by year
- New Urbanism
- Roadway noise
- Traffic collision
- Traffic congestion
- Transit Oriented Development
- Urban decay
- Urban sprawl
Interstate Highway System
- YouTube Video: Interstate Highway System
- YouTube Video: How to Navigate Interstates & Freeways | New Driver Smart
- YouTube Video: How Are Highways Designed?
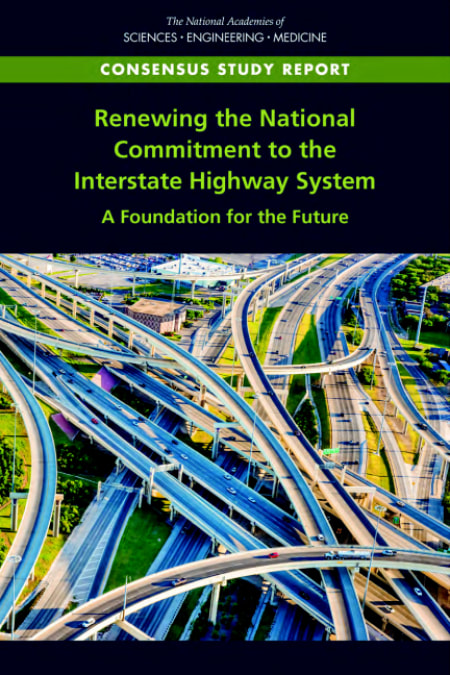
The Dwight D. Eisenhower National System of Interstate and Defense Highways, commonly known as the Interstate Highway System, is a network of freeways that forms part of the National Highway System in the United States. Construction of the system was authorized by the Federal Aid Highway Act of 1956.
The system extends throughout the contiguous United States and has routes in Hawaii, Alaska, and Puerto Rico.
The U.S. federal government first funded roadways through the Federal Aid Road Act of 1916, and began an effort to construct a national road grid with the passage of the Federal Aid Highway Act of 1921.
After Dwight D. Eisenhower became president in 1953, his administration developed a proposal for an interstate highway system, eventually resulting in the passage of the Federal Aid Highway Act of 1956.
Construction of the Interstate Highway System was proclaimed complete in 1992, though some planned routes were canceled and several routes have stretches that do not fully conform with federal standards.
The cost of construction of the Interstate Highway System was approximately $114 billion (equivalent to $530 billion in 2019). The original system has been expanded numerous times through the creation of new designations and the extension of existing designations.
Though much of their construction was funded by the federal government, Interstate Highways are owned by the state in which they were built. All Interstates must meet specific standards such as having controlled access, avoiding at-grade intersections, and complying with federal traffic sign specifications.
Interstate Highways use a numbering scheme in which primary Interstates are assigned one- or two-digit numbers, and shorter routes are assigned three-digit numbers where the last two digits match the parent route.
The Interstate Highway System is partially financed through the Highway Trust Fund, which itself is funded by a federal fuel tax. Though federal legislation initially banned the collection of tolls, some Interstate routes are toll roads.
As of 2018, about one-quarter of all vehicle miles driven in the country used the Interstate Highway System, which had a total length of 48,440 miles (77,960 km). Several future routes are in development.
Standards:
Main article: Interstate Highway standards
The American Association of State Highway and Transportation Officials (AASHTO) has defined a set of standards that all new Interstates must meet unless a waiver from the Federal Highway Administration (FHWA) is obtained. One almost absolute standard is the controlled access nature of the roads. With few exceptions, traffic lights (and cross traffic in general) are limited to toll booths and ramp meters (metered flow control for lane merging during rush hour).
Speed limits:
Further information: Speed limits in the United States and National Maximum Speed Law
Being freeways, Interstate Highways usually have the highest speed limits in a given area. Speed limits are determined by individual states. From 1975 to 1986, the maximum speed limit on any highway in the United States was 55 miles per hour (90 km/h), in accordance with federal law.
Typically, lower limits are established in Northeastern and coastal states, while higher speed limits are established in inland states west of the Mississippi River. For example, the maximum speed limit is 75 mph (120 km/h) in northern Maine, varies between 50 and 70 mph (80 and 115 km/h) from southern Maine to New Jersey, and is 50 mph (80 km/h) in New York City and the District of Columbia.
Currently, rural speed limits elsewhere generally range from 65 to 80 miles per hour (105 to 130 km/h). Several portions of various highways such as I-10 and I-20 in rural western Texas, I-80 in Nevada between Fernley and Winnemucca (except around Lovelock) and portions of I-15, I-70, I-80, and I-84 in Utah have a speed limit of 80 mph (130 km/h). Other Interstates in Idaho, Montana, Oklahoma, South Dakota and Wyoming also have the same high speed limits.
In some areas, speed limits on Interstates can be significantly lower in areas where they traverse significantly hazardous areas.
The maximum speed limit on I-90 is 50 mph (80 km/h) in downtown Cleveland because of two sharp curves with a suggested limit of 35 mph (55 km/h) in a heavily congested area; I-70 through Wheeling, West Virginia, has a maximum speed limit of 45 mph (70 km/h) through the Wheeling Tunnel and most of downtown Wheeling; and I-68 has a maximum speed limit of 40 mph (65 km/h) through Cumberland, Maryland, because of multiple hazards including sharp curves and narrow lanes through the city.
In some locations, low speed limits are the result of lawsuits and resident demands; after holding up the completion of I-35E in St. Paul, Minnesota, for nearly 30 years in the courts, residents along the stretch of the freeway from the southern city limit to downtown successfully lobbied for a 45 mph (70 km/h) speed limit in addition to a prohibition on any vehicle weighing more than 9,000 pounds (4,100 kg) gross vehicle weight. I-93 in Franconia Notch State Park in northern New Hampshire has a speed limit of 45 mph (70 km/h) because it is a parkway that consists of only one lane per side of the highway.
On the other hand, Interstates 15, 80 and 84 in Utah have speed limits as high as 70 mph (115 km/h) within the Salt Lake City, Cedar City, and St. George areas, and I-25 in New Mexico within the Santa Fe and Las Vegas areas along with I-20 in Texas along Odessa and Midland and I-29 in North Dakota along the Grand Forks area have higher speed limits of 75 mph (120 km/h).
Other uses:
As one of the components of the National Highway System, Interstate Highways improve the mobility of military troops to and from airports, seaports, rail terminals, and other military bases. Interstate Highways also connect to other roads that are a part of the Strategic Highway Network, a system of roads identified as critical to the U.S. Department of Defense.
The system has also been used to facilitate evacuations in the face of hurricanes and other natural disasters. An option for maximizing traffic throughput on a highway is to reverse the flow of traffic on one side of a divider so that all lanes become outbound lanes. This procedure, known as contraflow lane reversal, has been employed several times for hurricane evacuations.
After public outcry regarding the inefficiency of evacuating from southern Louisiana prior to Hurricane Georges' landfall in September 1998, government officials looked towards contraflow to improve evacuation times. In Savannah, Georgia, and Charleston, South Carolina, in 1999, lanes of I-16 and I-26 were used in a contraflow configuration in anticipation of Hurricane Floyd with mixed results.
In 2004 contraflow was employed ahead of Hurricane Charley in the Tampa, Florida area and on the Gulf Coast before the landfall of Hurricane Ivan; however, evacuation times there were no better than previous evacuation operations.
Engineers began to apply lessons learned from the analysis of prior contraflow operations, including limiting exits, removing troopers (to keep traffic flowing instead of having drivers stop for directions), and improving the dissemination of public information. As a result, the 2005 evacuation of New Orleans, Louisiana, prior to Hurricane Katrina ran much more smoothly.
According to urban legend, early regulations required that one out of every five miles of the Interstate Highway System must be built straight and flat, so as to be usable by aircraft during times of war. There is no evidence of this rule being included in any Interstate legislation.
Numbering system:
Primary (one- and two-digit) Interstates:
See also: List of Interstate Highways
The numbering scheme for the Interstate Highway System was developed in 1957 by the American Association of State Highway and Transportation Officials (AASHTO). The association's present numbering policy dates back to August 10, 1973. Within the contiguous United States, primary Interstates—also called main line Interstates or two-digit Interstates—are assigned numbers less than 100.
While numerous exceptions do exist, there is a general scheme for numbering Interstates. Primary Interstates are assigned one- or two-digit numbers, while shorter routes (such as spurs, loops, and short connecting roads) are assigned three-digit numbers where the last two digits match the parent route (thus, I-294 is a loop that connects at both ends to I-94, while I-787 is a short spur route attached to I-87).
In the numbering scheme for the primary routes, east–west highways are assigned even numbers and north–south highways are assigned odd numbers. Odd route numbers increase from west to east, and even-numbered routes increase from south to north (to avoid confusion with the U.S. Highways, which increase from east to west and north to south).
This numbering system usually holds true even if the local direction of the route does not match the compass directions. Numbers divisible by five are intended to be major arteries among the primary routes, carrying traffic long distances.
Primary north–south Interstates increase in number from I-5 between Canada and Mexico along the West Coast to I‑95 between Canada and Miami, Florida along the East Coast.
Major west–east arterial Interstates increase in number from I-10 between Santa Monica, California, and Jacksonville, Florida, to I-90 between Seattle, Washington, and Boston, Massachusetts, with two exceptions.
There are no I-50 and I-60, as routes with those numbers would likely pass through states that currently have U.S. Highways with the same numbers, which is generally disallowed under highway administration guidelines.
Several two-digit numbers are shared between road segments at opposite ends of the country for various reasons. Some such highways are incomplete Interstates (such as I-69 and I-74) and some just happen to share route designations (such as I-76, I-84, I‑86, I-87, and I-88).
Some of these were due to a change in the numbering system as a result of a new policy adopted in 1973. Previously, letter-suffixed numbers were used for long spurs off primary routes; for example, western I‑84 was I‑80N, as it went north from I‑80.
The new policy stated, "No new divided numbers (such as I-35W and I-35E, etc.) shall be adopted." The new policy also recommended that existing divided numbers be eliminated as quickly as possible; however, an I-35W and I-35E still exist in the Dallas–Fort Worth metroplex in Texas, and an I-35W and I-35E that run through Minneapolis and Saint Paul, Minnesota, still exist.
Additionally, due to Congressional requirements, three sections of I-69 in southern Texas will be divided into I-69W, I-69E, and I-69C (for Central).
AASHTO policy allows dual numbering to provide continuity between major control points. This is referred to as a concurrency or overlap. For example, I‑75 and I‑85 share the same roadway in Atlanta; this 7.4-mile (11.9 km) section, called the Downtown Connector, is labeled both I‑75 and I‑85. Concurrencies between Interstate and U.S. Route numbers are also allowed in accordance with AASHTO policy, as long as the length of the concurrency is reasonable.
In rare instances, two highway designations sharing the same roadway are signed as traveling in opposite directions; one such wrong-way concurrency is found between Wytheville and Fort Chiswell, Virginia, where I‑81 north and I‑77 south are equivalent (with that section of road traveling almost due east), as are I‑81 south and I‑77 north.
Auxiliary (three-digit) Interstates:
See also: List of auxiliary Interstate Highways
Auxiliary Interstate Highways are circumferential, radial, or spur highways that principally serve urban areas. These types of Interstate Highways are given three-digit route numbers, which consist of a single digit prefixed to the two-digit number of its parent Interstate Highway.
Spur routes deviate from their parent and do not return; these are given an odd first digit. Circumferential and radial loop routes return to the parent, and are given an even first digit.
Unlike primary Interstates, three-digit Interstates are signed as either east–west or north–south, depending on the general orientation of the route, without regard to the route number. For instance, I-190 in Massachusetts is labeled north–south, while I-195 in New Jersey is labeled east–west.
Some looped Interstate routes use inner–outer directions instead of compass directions, when the use of compass directions would create ambiguity. Due to the large number of these routes, auxiliary route numbers may be repeated in different states along the mainline. Some auxiliary highways do not follow these guidelines, however.
Alaska, Hawaii, and Puerto Rico:
The Interstate Highway System also extends to Alaska, Hawaii, and Puerto Rico, even though they have no direct land connections to any other states or territories. However, their residents still pay federal fuel and tire taxes.
The Interstates in Hawaii, all located on the most populous island of Oahu, carry the prefix H. There are three one-digit routes in the state (H-1, H-2, and H-3) and one auxiliary route (H-201). These Interstates connect several military and naval bases together, as well as the important cities and towns spread across Oahu, and especially the metropolis of Honolulu.
Both Alaska and Puerto Rico also have public highways that receive 90 percent of their funding from the Interstate Highway program. The Interstates of Alaska and Puerto Rico are numbered sequentially in order of funding without regard to the rules on odd and even numbers. They also carry the prefixes A and PR, respectively. However, these highways are signed according to their local designations, not their Interstate Highway numbers.
Furthermore, these routes were neither planned according to nor constructed to the official Interstate Highway standards.
Mile markers and exit numbers:
On one- or two-digit Interstates, the mile marker numbering almost always begins at the southern or western state line. If an Interstate originates within a state, the numbering begins from the location where the road begins in the south or west. As with all guidelines for Interstate routes, however, numerous exceptions exist.
Three-digit Interstates with an even first number that form a complete circumferential (circle) bypass around a city feature mile markers that are numbered in a clockwise direction, beginning just west of an Interstate that bisects the circumferential route near a south polar location.
In other words, mile marker 1 on I-465, a 53-mile (85 km) route around Indianapolis, is just west of its junction with I-65 on the south side of Indianapolis (on the south leg of I-465), and mile marker 53 is just east of this same junction.
An exception is I-495 in the Washington metropolitan area, with mileposts increasing counterclockwise because part of that road is also part of I-95.
The exit numbers of interchanges are either sequential or distance-based so that the exit number is the same as the nearest mile marker. Under the latter system, a single mile with multiple exits may be assigned letter suffixes, for example on I‑890 in New York.
Business routes:
AASHTO defines a category of special routes separate from primary and auxiliary Interstate designations. These routes do not have to comply to Interstate construction or limited-access standards but are routes that may be identified and approved by the association.
The same route marking policy applies to both US Numbered Highways and Interstate Highways; however, business route designations are sometimes used for Interstate Highways.
Known as Business Loops & Business Spurs, these routes principally travel through the corporate limits of a city, passing through the central business district when the regular route is directed around the city. They also use a green shield instead of the red and blue shield.
Financing:
Interstate Highways and their rights-of-way are owned by the state in which they were built. The last federally owned portion of the Interstate System was the Woodrow Wilson Bridge on the Washington Capital Beltway. The new bridge was completed in 2009 and is collectively owned by Virginia and Maryland. Maintenance is generally the responsibility of the state department of transportation. However, there are some segments of Interstate owned and maintained by local authorities.
About 70 percent of the construction and maintenance costs of Interstate Highways in the United States have been paid through user fees, primarily the fuel taxes collected by the federal, state, and local governments.
To a much lesser extent they have been paid for by tolls collected on toll highways and bridges. The federal gasoline tax was first imposed in 1932 at one cent per gallon; during the Eisenhower administration, the Highway Trust Fund, established by the Highway Revenue Act in 1956, prescribed a three-cent-per-gallon fuel tax, soon increased to 4.5 cents per gallon. Since 1993 the tax has remained at 18.4 cents per gallon.
Other excise taxes related to highway travel also accumulated in the Highway Trust Fund. Initially, that fund was sufficient for the federal portion of building the Interstate system, built in the early years with "10 cent dollars", from the perspective of the states, as the federal government paid 90% of the costs while the state paid 10%. The system grew more rapidly than the rate of the taxes on fuel and other aspects of driving (e. g., excise tax on tires).
The rest of the costs of these highways are borne by general fund receipts, bond issues, designated property taxes, and other taxes. The federal contribution comes overwhelmingly from motor vehicle and fuel taxes (93.5 percent in 2007), as does about 60 percent of the state contribution. However, any local government contributions are overwhelmingly from sources besides user fees.
As decades passed in the 20th century and into the 21st century, the portion of the user fees spent on highways themselves covers about 57 percent of their costs, with about one-sixth of the user fees being sent to other programs, including the mass transit systems in large cities.
Some large sections of Interstate Highways that were planned or constructed before 1956 are still operated as toll roads. Others have had their construction bonds paid off and they have become toll-free, such as in:
As American suburbs have expanded, the costs incurred in maintaining freeway infrastructure have also grown, leaving little in the way of funds for new Interstate construction.
This has led to the proliferation of toll roads (turnpikes) as the new method of building limited-access highways in suburban areas. Some Interstates are privately maintained (for example, the VMS company maintains I‑35 in Texas) to meet rising costs of maintenance and allow state departments of transportation to focus on serving the fastest-growing regions in their states.
Parts of the Interstate System might have to be tolled in the future to meet maintenance and expansion demands, as has been done with adding toll HOV/HOT lanes in cities such as Atlanta, Dallas, and Los Angeles.
Although part of the tolling is an effect of the SAFETEA‑LU act, which has put an emphasis on toll roads as a means to reduce congestion, present federal law does not allow for a state to change a freeway section to a tolled section for all traffic.
Tolls:
See also: Category: Tolled sections of Interstate Highways.
About 2,900 miles (4,700 km) of toll roads are included in the Interstate Highway System. While federal legislation initially banned the collection of tolls on Interstates, many of the toll roads on the system were either completed or under construction when the Interstate Highway System was established.
Since these highways provided logical connections to other parts of the system, they were designated as Interstate highways. Congress also decided that it was too costly to either build toll-free Interstates parallel to these toll roads, or directly repay all the bondholders who financed these facilities and remove the tolls. Thus, these toll roads were grandfathered into the Interstate Highway System.
Toll roads designated as Interstates (such as the Massachusetts Turnpike) were typically allowed to continue collecting tolls, but are generally ineligible to receive federal funds for maintenance and improvements.
Some toll roads that did receive federal funds to finance emergency repairs (notably the Connecticut Turnpike (I-95) following the Mianus River Bridge collapse) were required to remove tolls as soon as the highway's construction bonds were paid off.
In addition, these toll facilities were grandfathered from Interstate Highway standards. A notable example is the western approach to the Benjamin Franklin Bridge in Philadelphia, where I-676 has a surface street section through a historic area.
Policies on toll facilities and Interstate Highways have since changed. The Federal Highway Administration has allowed some states to collect tolls on existing Interstate Highways, while a recent extension of I-376 included a section of Pennsylvania Route 60 that was tolled by the Pennsylvania Turnpike Commission before receiving Interstate designation.
Also, newer toll facilities (like the tolled section of I-376, which was built in the early 1990s) must conform to Interstate standards. A new addition of the Manual on Uniform Traffic Control Devices in 2009 requires a black-on-yellow "Toll" sign to be placed above the Interstate trailblazer on Interstate Highways that collect tolls.
Legislation passed in 2005 known as SAFETEA-LU, encouraged states to construct new Interstate Highways through "innovative financing" methods. SAFETEA-LU facilitated states to pursue innovative financing by easing the restrictions on building interstates as toll roads, either through state agencies or through public–private partnerships.
However, SAFETEA-LU left in place a prohibition of installing tolls on existing toll-free Interstates, and states wishing to toll such routes to finance upgrades and repairs must first seek approval from Congress.
Chargeable and non-chargeable Interstate routes:
Interstate Highways financed with federal funds are known as "chargeable" Interstate routes, and are considered part of the 42,000-mile (68,000 km) network of highways. Federal laws also allow "non-chargeable" Interstate routes, highways funded similarly to state and U.S. Highways to be signed as Interstates, if they both meet the Interstate Highway standards and are logical additions or connections to the system.
These additions fall under two categories: routes that already meet Interstate standards, and routes not yet upgraded to Interstate standards. Only routes that meet Interstate standards may be signed as Interstates once their proposed number is approved.
Signage:
Interstate shield:
Interstate Highways are signed by a number placed on a red, white, and blue sign. The shield design itself is a registered trademark of the American Association of State Highway and Transportation Officials. The colors red, white, and blue were chosen because they are the colors of the American flag.
In the original design, the name of the state was displayed above the highway number, but in many states, this area is now left blank, allowing for the printing of larger and more-legible digits. Signs with the shield alone are placed periodically throughout each Interstate as reassurance markers. These signs usually measure 36 inches (91 cm) high, and is 36 inches (91 cm) wide for two-digit Interstates or 45 inches (110 cm) for three-digit Interstates.
Interstate business loops and spurs use a special shield in which the red and blue are replaced with green, the word "BUSINESS" appears instead of "INTERSTATE", and the word "SPUR" or "LOOP" usually appears above the number.
The green shield is employed to mark the main route through a city's central business district, which intersects the associated Interstate at one (spur) or both (loop) ends of the business route.
The route usually traverses the main thoroughfare(s) of the city's downtown area or other major business district. A city may have more than one Interstate-derived business route, depending on the number of Interstates passing through a city and the number of significant business districts therein.
Over time, the design of the Interstate shield has changed. In 1957 the Interstate shield designed by Texas Highway Department employee Richard Oliver was introduced, the winner of a contest that included 100 entries; at the time, the shield color was a dark navy blue and only 17 inches (43 cm) wide. The Manual on Uniform Traffic Control Devices (MUTCD) standards revised the shield in the 1961, 1971, and 1978 editions.
Exit numbering:
The majority of Interstates have exit numbers. Like other highways, Interstates feature guide signs that list control cities to help direct drivers through interchanges and exits toward their desired destination.
All traffic signs and lane markings on the Interstates are supposed to be designed in compliance with the Manual on Uniform Traffic Control Devices (MUTCD). There are, however, many local and regional variations in signage.
For many years, California was the only state that did not use an exit numbering system. It was granted an exemption in the 1950s due to having an already largely completed and signed highway system; placing exit number signage across the state was deemed too expensive.
To control costs, California began to incorporate exit numbers on its freeways in 2002—Interstate, U.S., and state routes alike. Caltrans commonly installs exit number signage only when a freeway or interchange is built, reconstructed, retrofitted, or repaired, and it is usually tacked onto the top-right corner of an already existing sign.
Newer signs along the freeways follow this practice as well. Most exits along California's Interstates now have exit number signage, particularly in rural areas. California, however, still does not use mileposts, although a few exist for experiments or for special purposes.
In 2010–2011, the Illinois State Toll Highway Authority posted all new mile markers to be uniform with the rest of the state on I‑90 (Jane Addams Memorial/Northwest Tollway) and the I‑94 section of the Tri‑State Tollway, which previously had matched the I‑294 section starting in the south at I‑80/I‑94/IL Route 394. The tollway also added exit number tabs to the exits.
Exit numbers correspond to Interstate mileage markers in most states. On I‑19 in Arizona, however, length is measured in kilometers instead of miles because, at the time of construction, a push for the United States to change to a metric system of measurement had gained enough traction that it was mistakenly assumed that all highway measurements would eventually be changed to metric; proximity to metric-using Mexico may also have been a factor, as I‑19 indirectly connects I‑10 to the Mexican Federal Highway system via surface streets in Nogales.
Mileage count increases from west to east on most even-numbered Interstates; on odd-numbered Interstates mileage count increases from south to north.
Some highways, including the New York State Thruway, use sequential exit-numbering schemes. Exits on the New York State Thruway count up from Yonkers traveling north, and then west from Albany. I‑87 in New York State is numbered in three sections.
The first section makes up the Major Deegan Expressway in the Bronx, with interchanges numbered sequentially from 1 to 14. The second section of I‑87 is a part of the New York State Thruway that starts in Yonkers (exit 1) and continues north to Albany (exit 24); at Albany, the Thruway turns west and becomes I‑90 for exits 25 to 61. From Albany north to the Canadian border, the exits on I‑87 are numbered sequentially from 1 to 44 along the Adirondack Northway.
This often leads to confusion as there is more than one exit on I‑87 with the same number. For example, exit 4 on Thruway section of I‑87 connects with the Cross County Parkway in Yonkers, but exit 4 on the Northway is the exit for the Albany airport. These two exits share a number but are located 150 miles (240 km) apart.
Many northeastern states label exit numbers sequentially, regardless of how many miles have passed between exits. States in which Interstate exits are still numbered sequentially are Connecticut, Delaware, Massachusetts (although efforts to use mile-based exit numbers began in 2020), New Hampshire, New York, Rhode Island, and Vermont; as such, five of the main Interstate Highways that remain completely within these states (87, 88, 89, 91, and 93) have interchanges numbered sequentially along their entire routes.
Maine, Pennsylvania, Virginia, Georgia, and Florida followed this system for a number of years, but have since converted to mileage-based exit numbers. Georgia renumbered in 2000, while Maine did so in 2004. The Pennsylvania Turnpike uses both mile marker numbers and sequential numbers.
Mile marker numbers are used for signage, while sequential numbers are used for numbering interchanges internally. The New Jersey Turnpike, including the portions that are signed as I‑95 and I‑78, also has sequential numbering, but other Interstates within New Jersey use mile markers.
Sign locations:
There are four common signage methods on Interstates:
Statistics:
Volume:
Impact and reception:
Following the passage of the Federal Aid Highway Act of 1956, the railroad system for passengers and freight declined sharply, but the trucking industry expanded dramatically and the cost of shipping and travel fell sharply.
Suburbanization became possible, with the rapid growth of easily accessible, larger, cheaper housing than was available in central cities. Tourism dramatically expanded as well, creating a demand for more service stations, motels, restaurants and visitor attractions.
There was much more long-distance movement to the Sun Belt for winter vacations, or for permanent relocation, with convenient access to visits to relatives back home. In rural areas, towns and small cities off the grid lost out as shoppers followed the interstate and new factories were located near them.
The system had a particularly strong effect in the Southern United States, as most Southern states had not previously been able to afford the construction of major highways. The construction of the Interstate Highway System facilitated the relocation of heavy manufacturing to the South and spurred the development of Southern-based corporations like Walmart and FedEx.
The Interstate Highway System has been criticized for contributing to the decline of some cities and for destroying predominantly African-American neighborhoods in urban centers.
Other critics have blamed the Interstate Highway System for the decline of public transportation in the United States since the 1950s.
See also:
The system extends throughout the contiguous United States and has routes in Hawaii, Alaska, and Puerto Rico.
The U.S. federal government first funded roadways through the Federal Aid Road Act of 1916, and began an effort to construct a national road grid with the passage of the Federal Aid Highway Act of 1921.
After Dwight D. Eisenhower became president in 1953, his administration developed a proposal for an interstate highway system, eventually resulting in the passage of the Federal Aid Highway Act of 1956.
Construction of the Interstate Highway System was proclaimed complete in 1992, though some planned routes were canceled and several routes have stretches that do not fully conform with federal standards.
The cost of construction of the Interstate Highway System was approximately $114 billion (equivalent to $530 billion in 2019). The original system has been expanded numerous times through the creation of new designations and the extension of existing designations.
Though much of their construction was funded by the federal government, Interstate Highways are owned by the state in which they were built. All Interstates must meet specific standards such as having controlled access, avoiding at-grade intersections, and complying with federal traffic sign specifications.
Interstate Highways use a numbering scheme in which primary Interstates are assigned one- or two-digit numbers, and shorter routes are assigned three-digit numbers where the last two digits match the parent route.
The Interstate Highway System is partially financed through the Highway Trust Fund, which itself is funded by a federal fuel tax. Though federal legislation initially banned the collection of tolls, some Interstate routes are toll roads.
As of 2018, about one-quarter of all vehicle miles driven in the country used the Interstate Highway System, which had a total length of 48,440 miles (77,960 km). Several future routes are in development.
Standards:
Main article: Interstate Highway standards
The American Association of State Highway and Transportation Officials (AASHTO) has defined a set of standards that all new Interstates must meet unless a waiver from the Federal Highway Administration (FHWA) is obtained. One almost absolute standard is the controlled access nature of the roads. With few exceptions, traffic lights (and cross traffic in general) are limited to toll booths and ramp meters (metered flow control for lane merging during rush hour).
Speed limits:
Further information: Speed limits in the United States and National Maximum Speed Law
Being freeways, Interstate Highways usually have the highest speed limits in a given area. Speed limits are determined by individual states. From 1975 to 1986, the maximum speed limit on any highway in the United States was 55 miles per hour (90 km/h), in accordance with federal law.
Typically, lower limits are established in Northeastern and coastal states, while higher speed limits are established in inland states west of the Mississippi River. For example, the maximum speed limit is 75 mph (120 km/h) in northern Maine, varies between 50 and 70 mph (80 and 115 km/h) from southern Maine to New Jersey, and is 50 mph (80 km/h) in New York City and the District of Columbia.
Currently, rural speed limits elsewhere generally range from 65 to 80 miles per hour (105 to 130 km/h). Several portions of various highways such as I-10 and I-20 in rural western Texas, I-80 in Nevada between Fernley and Winnemucca (except around Lovelock) and portions of I-15, I-70, I-80, and I-84 in Utah have a speed limit of 80 mph (130 km/h). Other Interstates in Idaho, Montana, Oklahoma, South Dakota and Wyoming also have the same high speed limits.
In some areas, speed limits on Interstates can be significantly lower in areas where they traverse significantly hazardous areas.
The maximum speed limit on I-90 is 50 mph (80 km/h) in downtown Cleveland because of two sharp curves with a suggested limit of 35 mph (55 km/h) in a heavily congested area; I-70 through Wheeling, West Virginia, has a maximum speed limit of 45 mph (70 km/h) through the Wheeling Tunnel and most of downtown Wheeling; and I-68 has a maximum speed limit of 40 mph (65 km/h) through Cumberland, Maryland, because of multiple hazards including sharp curves and narrow lanes through the city.
In some locations, low speed limits are the result of lawsuits and resident demands; after holding up the completion of I-35E in St. Paul, Minnesota, for nearly 30 years in the courts, residents along the stretch of the freeway from the southern city limit to downtown successfully lobbied for a 45 mph (70 km/h) speed limit in addition to a prohibition on any vehicle weighing more than 9,000 pounds (4,100 kg) gross vehicle weight. I-93 in Franconia Notch State Park in northern New Hampshire has a speed limit of 45 mph (70 km/h) because it is a parkway that consists of only one lane per side of the highway.
On the other hand, Interstates 15, 80 and 84 in Utah have speed limits as high as 70 mph (115 km/h) within the Salt Lake City, Cedar City, and St. George areas, and I-25 in New Mexico within the Santa Fe and Las Vegas areas along with I-20 in Texas along Odessa and Midland and I-29 in North Dakota along the Grand Forks area have higher speed limits of 75 mph (120 km/h).
Other uses:
As one of the components of the National Highway System, Interstate Highways improve the mobility of military troops to and from airports, seaports, rail terminals, and other military bases. Interstate Highways also connect to other roads that are a part of the Strategic Highway Network, a system of roads identified as critical to the U.S. Department of Defense.
The system has also been used to facilitate evacuations in the face of hurricanes and other natural disasters. An option for maximizing traffic throughput on a highway is to reverse the flow of traffic on one side of a divider so that all lanes become outbound lanes. This procedure, known as contraflow lane reversal, has been employed several times for hurricane evacuations.
After public outcry regarding the inefficiency of evacuating from southern Louisiana prior to Hurricane Georges' landfall in September 1998, government officials looked towards contraflow to improve evacuation times. In Savannah, Georgia, and Charleston, South Carolina, in 1999, lanes of I-16 and I-26 were used in a contraflow configuration in anticipation of Hurricane Floyd with mixed results.
In 2004 contraflow was employed ahead of Hurricane Charley in the Tampa, Florida area and on the Gulf Coast before the landfall of Hurricane Ivan; however, evacuation times there were no better than previous evacuation operations.
Engineers began to apply lessons learned from the analysis of prior contraflow operations, including limiting exits, removing troopers (to keep traffic flowing instead of having drivers stop for directions), and improving the dissemination of public information. As a result, the 2005 evacuation of New Orleans, Louisiana, prior to Hurricane Katrina ran much more smoothly.
According to urban legend, early regulations required that one out of every five miles of the Interstate Highway System must be built straight and flat, so as to be usable by aircraft during times of war. There is no evidence of this rule being included in any Interstate legislation.
Numbering system:
Primary (one- and two-digit) Interstates:
See also: List of Interstate Highways
The numbering scheme for the Interstate Highway System was developed in 1957 by the American Association of State Highway and Transportation Officials (AASHTO). The association's present numbering policy dates back to August 10, 1973. Within the contiguous United States, primary Interstates—also called main line Interstates or two-digit Interstates—are assigned numbers less than 100.
While numerous exceptions do exist, there is a general scheme for numbering Interstates. Primary Interstates are assigned one- or two-digit numbers, while shorter routes (such as spurs, loops, and short connecting roads) are assigned three-digit numbers where the last two digits match the parent route (thus, I-294 is a loop that connects at both ends to I-94, while I-787 is a short spur route attached to I-87).
In the numbering scheme for the primary routes, east–west highways are assigned even numbers and north–south highways are assigned odd numbers. Odd route numbers increase from west to east, and even-numbered routes increase from south to north (to avoid confusion with the U.S. Highways, which increase from east to west and north to south).
This numbering system usually holds true even if the local direction of the route does not match the compass directions. Numbers divisible by five are intended to be major arteries among the primary routes, carrying traffic long distances.
Primary north–south Interstates increase in number from I-5 between Canada and Mexico along the West Coast to I‑95 between Canada and Miami, Florida along the East Coast.
Major west–east arterial Interstates increase in number from I-10 between Santa Monica, California, and Jacksonville, Florida, to I-90 between Seattle, Washington, and Boston, Massachusetts, with two exceptions.
There are no I-50 and I-60, as routes with those numbers would likely pass through states that currently have U.S. Highways with the same numbers, which is generally disallowed under highway administration guidelines.
Several two-digit numbers are shared between road segments at opposite ends of the country for various reasons. Some such highways are incomplete Interstates (such as I-69 and I-74) and some just happen to share route designations (such as I-76, I-84, I‑86, I-87, and I-88).
Some of these were due to a change in the numbering system as a result of a new policy adopted in 1973. Previously, letter-suffixed numbers were used for long spurs off primary routes; for example, western I‑84 was I‑80N, as it went north from I‑80.
The new policy stated, "No new divided numbers (such as I-35W and I-35E, etc.) shall be adopted." The new policy also recommended that existing divided numbers be eliminated as quickly as possible; however, an I-35W and I-35E still exist in the Dallas–Fort Worth metroplex in Texas, and an I-35W and I-35E that run through Minneapolis and Saint Paul, Minnesota, still exist.
Additionally, due to Congressional requirements, three sections of I-69 in southern Texas will be divided into I-69W, I-69E, and I-69C (for Central).
AASHTO policy allows dual numbering to provide continuity between major control points. This is referred to as a concurrency or overlap. For example, I‑75 and I‑85 share the same roadway in Atlanta; this 7.4-mile (11.9 km) section, called the Downtown Connector, is labeled both I‑75 and I‑85. Concurrencies between Interstate and U.S. Route numbers are also allowed in accordance with AASHTO policy, as long as the length of the concurrency is reasonable.
In rare instances, two highway designations sharing the same roadway are signed as traveling in opposite directions; one such wrong-way concurrency is found between Wytheville and Fort Chiswell, Virginia, where I‑81 north and I‑77 south are equivalent (with that section of road traveling almost due east), as are I‑81 south and I‑77 north.
Auxiliary (three-digit) Interstates:
See also: List of auxiliary Interstate Highways
Auxiliary Interstate Highways are circumferential, radial, or spur highways that principally serve urban areas. These types of Interstate Highways are given three-digit route numbers, which consist of a single digit prefixed to the two-digit number of its parent Interstate Highway.
Spur routes deviate from their parent and do not return; these are given an odd first digit. Circumferential and radial loop routes return to the parent, and are given an even first digit.
Unlike primary Interstates, three-digit Interstates are signed as either east–west or north–south, depending on the general orientation of the route, without regard to the route number. For instance, I-190 in Massachusetts is labeled north–south, while I-195 in New Jersey is labeled east–west.
Some looped Interstate routes use inner–outer directions instead of compass directions, when the use of compass directions would create ambiguity. Due to the large number of these routes, auxiliary route numbers may be repeated in different states along the mainline. Some auxiliary highways do not follow these guidelines, however.
Alaska, Hawaii, and Puerto Rico:
The Interstate Highway System also extends to Alaska, Hawaii, and Puerto Rico, even though they have no direct land connections to any other states or territories. However, their residents still pay federal fuel and tire taxes.
The Interstates in Hawaii, all located on the most populous island of Oahu, carry the prefix H. There are three one-digit routes in the state (H-1, H-2, and H-3) and one auxiliary route (H-201). These Interstates connect several military and naval bases together, as well as the important cities and towns spread across Oahu, and especially the metropolis of Honolulu.
Both Alaska and Puerto Rico also have public highways that receive 90 percent of their funding from the Interstate Highway program. The Interstates of Alaska and Puerto Rico are numbered sequentially in order of funding without regard to the rules on odd and even numbers. They also carry the prefixes A and PR, respectively. However, these highways are signed according to their local designations, not their Interstate Highway numbers.
Furthermore, these routes were neither planned according to nor constructed to the official Interstate Highway standards.
Mile markers and exit numbers:
On one- or two-digit Interstates, the mile marker numbering almost always begins at the southern or western state line. If an Interstate originates within a state, the numbering begins from the location where the road begins in the south or west. As with all guidelines for Interstate routes, however, numerous exceptions exist.
Three-digit Interstates with an even first number that form a complete circumferential (circle) bypass around a city feature mile markers that are numbered in a clockwise direction, beginning just west of an Interstate that bisects the circumferential route near a south polar location.
In other words, mile marker 1 on I-465, a 53-mile (85 km) route around Indianapolis, is just west of its junction with I-65 on the south side of Indianapolis (on the south leg of I-465), and mile marker 53 is just east of this same junction.
An exception is I-495 in the Washington metropolitan area, with mileposts increasing counterclockwise because part of that road is also part of I-95.
The exit numbers of interchanges are either sequential or distance-based so that the exit number is the same as the nearest mile marker. Under the latter system, a single mile with multiple exits may be assigned letter suffixes, for example on I‑890 in New York.
Business routes:
AASHTO defines a category of special routes separate from primary and auxiliary Interstate designations. These routes do not have to comply to Interstate construction or limited-access standards but are routes that may be identified and approved by the association.
The same route marking policy applies to both US Numbered Highways and Interstate Highways; however, business route designations are sometimes used for Interstate Highways.
Known as Business Loops & Business Spurs, these routes principally travel through the corporate limits of a city, passing through the central business district when the regular route is directed around the city. They also use a green shield instead of the red and blue shield.
Financing:
Interstate Highways and their rights-of-way are owned by the state in which they were built. The last federally owned portion of the Interstate System was the Woodrow Wilson Bridge on the Washington Capital Beltway. The new bridge was completed in 2009 and is collectively owned by Virginia and Maryland. Maintenance is generally the responsibility of the state department of transportation. However, there are some segments of Interstate owned and maintained by local authorities.
About 70 percent of the construction and maintenance costs of Interstate Highways in the United States have been paid through user fees, primarily the fuel taxes collected by the federal, state, and local governments.
To a much lesser extent they have been paid for by tolls collected on toll highways and bridges. The federal gasoline tax was first imposed in 1932 at one cent per gallon; during the Eisenhower administration, the Highway Trust Fund, established by the Highway Revenue Act in 1956, prescribed a three-cent-per-gallon fuel tax, soon increased to 4.5 cents per gallon. Since 1993 the tax has remained at 18.4 cents per gallon.
Other excise taxes related to highway travel also accumulated in the Highway Trust Fund. Initially, that fund was sufficient for the federal portion of building the Interstate system, built in the early years with "10 cent dollars", from the perspective of the states, as the federal government paid 90% of the costs while the state paid 10%. The system grew more rapidly than the rate of the taxes on fuel and other aspects of driving (e. g., excise tax on tires).
The rest of the costs of these highways are borne by general fund receipts, bond issues, designated property taxes, and other taxes. The federal contribution comes overwhelmingly from motor vehicle and fuel taxes (93.5 percent in 2007), as does about 60 percent of the state contribution. However, any local government contributions are overwhelmingly from sources besides user fees.
As decades passed in the 20th century and into the 21st century, the portion of the user fees spent on highways themselves covers about 57 percent of their costs, with about one-sixth of the user fees being sent to other programs, including the mass transit systems in large cities.
Some large sections of Interstate Highways that were planned or constructed before 1956 are still operated as toll roads. Others have had their construction bonds paid off and they have become toll-free, such as in:
- Connecticut (I‑95),
- Maryland (I‑95),
- Virginia (I‑95),
- and Kentucky (I‑65).
As American suburbs have expanded, the costs incurred in maintaining freeway infrastructure have also grown, leaving little in the way of funds for new Interstate construction.
This has led to the proliferation of toll roads (turnpikes) as the new method of building limited-access highways in suburban areas. Some Interstates are privately maintained (for example, the VMS company maintains I‑35 in Texas) to meet rising costs of maintenance and allow state departments of transportation to focus on serving the fastest-growing regions in their states.
Parts of the Interstate System might have to be tolled in the future to meet maintenance and expansion demands, as has been done with adding toll HOV/HOT lanes in cities such as Atlanta, Dallas, and Los Angeles.
Although part of the tolling is an effect of the SAFETEA‑LU act, which has put an emphasis on toll roads as a means to reduce congestion, present federal law does not allow for a state to change a freeway section to a tolled section for all traffic.
Tolls:
See also: Category: Tolled sections of Interstate Highways.
About 2,900 miles (4,700 km) of toll roads are included in the Interstate Highway System. While federal legislation initially banned the collection of tolls on Interstates, many of the toll roads on the system were either completed or under construction when the Interstate Highway System was established.
Since these highways provided logical connections to other parts of the system, they were designated as Interstate highways. Congress also decided that it was too costly to either build toll-free Interstates parallel to these toll roads, or directly repay all the bondholders who financed these facilities and remove the tolls. Thus, these toll roads were grandfathered into the Interstate Highway System.
Toll roads designated as Interstates (such as the Massachusetts Turnpike) were typically allowed to continue collecting tolls, but are generally ineligible to receive federal funds for maintenance and improvements.
Some toll roads that did receive federal funds to finance emergency repairs (notably the Connecticut Turnpike (I-95) following the Mianus River Bridge collapse) were required to remove tolls as soon as the highway's construction bonds were paid off.
In addition, these toll facilities were grandfathered from Interstate Highway standards. A notable example is the western approach to the Benjamin Franklin Bridge in Philadelphia, where I-676 has a surface street section through a historic area.
Policies on toll facilities and Interstate Highways have since changed. The Federal Highway Administration has allowed some states to collect tolls on existing Interstate Highways, while a recent extension of I-376 included a section of Pennsylvania Route 60 that was tolled by the Pennsylvania Turnpike Commission before receiving Interstate designation.
Also, newer toll facilities (like the tolled section of I-376, which was built in the early 1990s) must conform to Interstate standards. A new addition of the Manual on Uniform Traffic Control Devices in 2009 requires a black-on-yellow "Toll" sign to be placed above the Interstate trailblazer on Interstate Highways that collect tolls.
Legislation passed in 2005 known as SAFETEA-LU, encouraged states to construct new Interstate Highways through "innovative financing" methods. SAFETEA-LU facilitated states to pursue innovative financing by easing the restrictions on building interstates as toll roads, either through state agencies or through public–private partnerships.
However, SAFETEA-LU left in place a prohibition of installing tolls on existing toll-free Interstates, and states wishing to toll such routes to finance upgrades and repairs must first seek approval from Congress.
Chargeable and non-chargeable Interstate routes:
Interstate Highways financed with federal funds are known as "chargeable" Interstate routes, and are considered part of the 42,000-mile (68,000 km) network of highways. Federal laws also allow "non-chargeable" Interstate routes, highways funded similarly to state and U.S. Highways to be signed as Interstates, if they both meet the Interstate Highway standards and are logical additions or connections to the system.
These additions fall under two categories: routes that already meet Interstate standards, and routes not yet upgraded to Interstate standards. Only routes that meet Interstate standards may be signed as Interstates once their proposed number is approved.
Signage:
Interstate shield:
Interstate Highways are signed by a number placed on a red, white, and blue sign. The shield design itself is a registered trademark of the American Association of State Highway and Transportation Officials. The colors red, white, and blue were chosen because they are the colors of the American flag.
In the original design, the name of the state was displayed above the highway number, but in many states, this area is now left blank, allowing for the printing of larger and more-legible digits. Signs with the shield alone are placed periodically throughout each Interstate as reassurance markers. These signs usually measure 36 inches (91 cm) high, and is 36 inches (91 cm) wide for two-digit Interstates or 45 inches (110 cm) for three-digit Interstates.
Interstate business loops and spurs use a special shield in which the red and blue are replaced with green, the word "BUSINESS" appears instead of "INTERSTATE", and the word "SPUR" or "LOOP" usually appears above the number.
The green shield is employed to mark the main route through a city's central business district, which intersects the associated Interstate at one (spur) or both (loop) ends of the business route.
The route usually traverses the main thoroughfare(s) of the city's downtown area or other major business district. A city may have more than one Interstate-derived business route, depending on the number of Interstates passing through a city and the number of significant business districts therein.
Over time, the design of the Interstate shield has changed. In 1957 the Interstate shield designed by Texas Highway Department employee Richard Oliver was introduced, the winner of a contest that included 100 entries; at the time, the shield color was a dark navy blue and only 17 inches (43 cm) wide. The Manual on Uniform Traffic Control Devices (MUTCD) standards revised the shield in the 1961, 1971, and 1978 editions.
Exit numbering:
The majority of Interstates have exit numbers. Like other highways, Interstates feature guide signs that list control cities to help direct drivers through interchanges and exits toward their desired destination.
All traffic signs and lane markings on the Interstates are supposed to be designed in compliance with the Manual on Uniform Traffic Control Devices (MUTCD). There are, however, many local and regional variations in signage.
For many years, California was the only state that did not use an exit numbering system. It was granted an exemption in the 1950s due to having an already largely completed and signed highway system; placing exit number signage across the state was deemed too expensive.
To control costs, California began to incorporate exit numbers on its freeways in 2002—Interstate, U.S., and state routes alike. Caltrans commonly installs exit number signage only when a freeway or interchange is built, reconstructed, retrofitted, or repaired, and it is usually tacked onto the top-right corner of an already existing sign.
Newer signs along the freeways follow this practice as well. Most exits along California's Interstates now have exit number signage, particularly in rural areas. California, however, still does not use mileposts, although a few exist for experiments or for special purposes.
In 2010–2011, the Illinois State Toll Highway Authority posted all new mile markers to be uniform with the rest of the state on I‑90 (Jane Addams Memorial/Northwest Tollway) and the I‑94 section of the Tri‑State Tollway, which previously had matched the I‑294 section starting in the south at I‑80/I‑94/IL Route 394. The tollway also added exit number tabs to the exits.
Exit numbers correspond to Interstate mileage markers in most states. On I‑19 in Arizona, however, length is measured in kilometers instead of miles because, at the time of construction, a push for the United States to change to a metric system of measurement had gained enough traction that it was mistakenly assumed that all highway measurements would eventually be changed to metric; proximity to metric-using Mexico may also have been a factor, as I‑19 indirectly connects I‑10 to the Mexican Federal Highway system via surface streets in Nogales.
Mileage count increases from west to east on most even-numbered Interstates; on odd-numbered Interstates mileage count increases from south to north.
Some highways, including the New York State Thruway, use sequential exit-numbering schemes. Exits on the New York State Thruway count up from Yonkers traveling north, and then west from Albany. I‑87 in New York State is numbered in three sections.
The first section makes up the Major Deegan Expressway in the Bronx, with interchanges numbered sequentially from 1 to 14. The second section of I‑87 is a part of the New York State Thruway that starts in Yonkers (exit 1) and continues north to Albany (exit 24); at Albany, the Thruway turns west and becomes I‑90 for exits 25 to 61. From Albany north to the Canadian border, the exits on I‑87 are numbered sequentially from 1 to 44 along the Adirondack Northway.
This often leads to confusion as there is more than one exit on I‑87 with the same number. For example, exit 4 on Thruway section of I‑87 connects with the Cross County Parkway in Yonkers, but exit 4 on the Northway is the exit for the Albany airport. These two exits share a number but are located 150 miles (240 km) apart.
Many northeastern states label exit numbers sequentially, regardless of how many miles have passed between exits. States in which Interstate exits are still numbered sequentially are Connecticut, Delaware, Massachusetts (although efforts to use mile-based exit numbers began in 2020), New Hampshire, New York, Rhode Island, and Vermont; as such, five of the main Interstate Highways that remain completely within these states (87, 88, 89, 91, and 93) have interchanges numbered sequentially along their entire routes.
Maine, Pennsylvania, Virginia, Georgia, and Florida followed this system for a number of years, but have since converted to mileage-based exit numbers. Georgia renumbered in 2000, while Maine did so in 2004. The Pennsylvania Turnpike uses both mile marker numbers and sequential numbers.
Mile marker numbers are used for signage, while sequential numbers are used for numbering interchanges internally. The New Jersey Turnpike, including the portions that are signed as I‑95 and I‑78, also has sequential numbering, but other Interstates within New Jersey use mile markers.
Sign locations:
There are four common signage methods on Interstates:
- Locating a sign on the ground to the side of the highway, mostly the right, and is used to denote exits, as well as rest areas, motorist services such as gas and lodging, recreational sites, and freeway names
- Attaching the sign to an overpass
- Mounting on full gantries that bridge the entire width of the highway and often show two or more signs
- Mounting on half-gantries that are located on one side of the highway, like a ground-mounted sign
Statistics:
Volume:
- Heaviest traveled: 374,000 vehicles per day: I-405 in Los Angeles, California (2008 estimate).
- Highest: 11,158 feet (3,401 m): I-70 in the Eisenhower Tunnel at the Continental Divide in the Colorado Rocky Mountains.
- Lowest (land): −52 feet (−16 m): I-8 at the New River near Seeley, California.
- Lowest (underwater): −103 feet (−31 m): I-95 in the Fort McHenry Tunnel under the Baltimore Inner Harbor.
- Longest (east–west): 3,020.54 miles (4,861.09 km): I-90 from Boston, Massachusetts, to Seattle, Washington.
- Longest (north–south): 1,908 mi (3,071 km): I-95 from the Canadian border near Houlton, Maine, to Miami, Florida.
- Shortest (two-digit): 1.69 mi (2.72 km): I-69W in Laredo, Texas.
- Longest segment between state lines: 881 mi (1,418 km): I-10 in Texas from the New Mexico state line near El Paso to the Louisiana state line near Orange, Texas.
- Shortest segment between state lines: 453 ft (138 m): Interstate 95/I-495 (Capital Beltway) on the Woodrow Wilson Bridge across the Potomac River where they briefly cross the southernmost tip of the District of Columbia between its borders with Maryland and Virginia.
- Longest concurrency: 278.4 mi (448.0 km): I-80 and I-90; Gary, Indiana, to Elyria, Ohio.
- Most states served by an Interstate: 15 states plus the District of Columbia:
- I-95 through Florida, THEN (in order, South to North):
- Georgia,
- South Carolina,
- North Carolina,
- Virginia,
- DC,
- Maryland,
- Delaware,
- Pennsylvania,
- New Jersey,
- New York,
- Connecticut,
- Rhode Island,
- Massachusetts,
- New Hampshire,
- and Maine.
- Most Interstates in a state: 32 routes: New York, totaling 1,750.66 mi (2,817.41 km)
- Most primary Interstates in a state: 13 routes: Illinois
- Most Interstate mileage in a state: 3,233.45 mi (5,203.73 km): Texas, in 17 different routes.
- Fewest Interstates in a state: 3 routes: Delaware, New Mexico, North Dakota, Puerto Rico, and Rhode Island
- Fewest primary Interstates in a state: 1 route: Delaware, Maine, and Rhode Island (I-95 in each case).
- Least Interstate mileage in a state: 40.61 mi (65.36 km): Delaware, in 3 different routes.
Impact and reception:
Following the passage of the Federal Aid Highway Act of 1956, the railroad system for passengers and freight declined sharply, but the trucking industry expanded dramatically and the cost of shipping and travel fell sharply.
Suburbanization became possible, with the rapid growth of easily accessible, larger, cheaper housing than was available in central cities. Tourism dramatically expanded as well, creating a demand for more service stations, motels, restaurants and visitor attractions.
There was much more long-distance movement to the Sun Belt for winter vacations, or for permanent relocation, with convenient access to visits to relatives back home. In rural areas, towns and small cities off the grid lost out as shoppers followed the interstate and new factories were located near them.
The system had a particularly strong effect in the Southern United States, as most Southern states had not previously been able to afford the construction of major highways. The construction of the Interstate Highway System facilitated the relocation of heavy manufacturing to the South and spurred the development of Southern-based corporations like Walmart and FedEx.
The Interstate Highway System has been criticized for contributing to the decline of some cities and for destroying predominantly African-American neighborhoods in urban centers.
Other critics have blamed the Interstate Highway System for the decline of public transportation in the United States since the 1950s.
See also:
- History
- Highway systems by country
- List of controlled-access highway systems
- Non-motorized access on freeways
- Dwight D. Eisenhower National System of Interstate and Defense Highways, Federal Highway Administration (FHWA)
- Route Log and Finder List, FHWA
- "Keep on Trucking?: Would you pay more in taxes to fix roads and rail?", NOW on PBS
Cargo Ships vs. Container Ships and Why container ships probably won't get bigger (BBC)
(T): Why container ships probably won't get bigger
(B): Container Ship Stuck in Suez Canal
- YouTube Video: Loading cargo onto a Container Ship
- YouTube Video: 10 Biggest Container Ships in the World
- YouTube Video: How it looks inside Container Ship (Amazing Video Tour)
(T): Why container ships probably won't get bigger
(B): Container Ship Stuck in Suez Canal
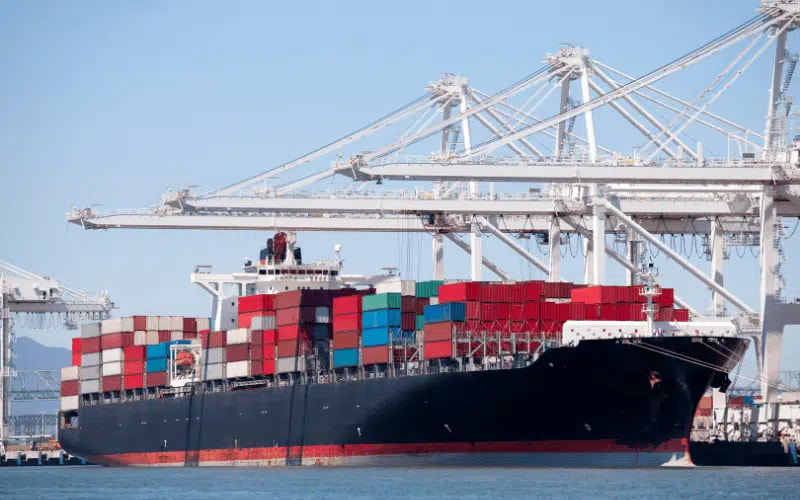
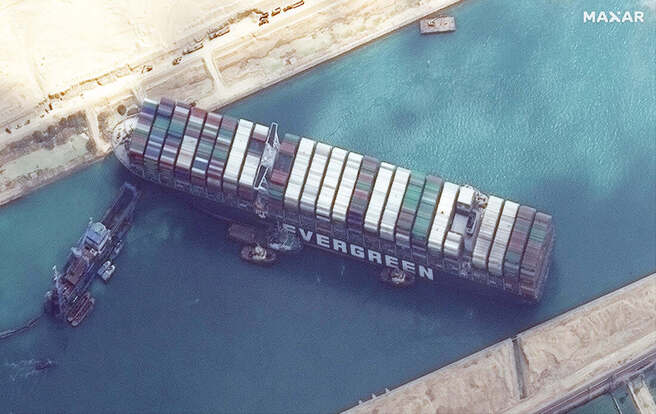
A cargo ship or freighter is a merchant ship that carries cargo, goods, and materials from one port to another. Thousands of cargo carriers ply the world's seas and oceans each year, handling the bulk of international trade.
Cargo ships are usually specially designed for the task, often being equipped with cranes and other mechanisms to load and unload, and come in all sizes. Today, they are almost always built of welded steel, and with some exceptions generally have a life expectancy of 25 to 30 years before being scrapped.
Definitions:
The words cargo and freight have become interchangeable in casual usage. Technically, "cargo" refers to the goods carried aboard the ship for hire, while "freight" refers to the act of carrying of such cargo, but the terms have been used interchangeably for centuries.
Generally, the modern ocean shipping business is divided into two classes:
Larger cargo ships are generally operated by shipping lines: companies that specialize in the handling of cargo in general. Smaller vessels, such as coasters, are often owned by their operators.
Types:
Cargo ships/freighters can be divided into seven groups, according to the type of cargo they carry. These groups are:
Click on any of the following blue hyperlinks for more about Cargo Ships:
A container ship (also called boxship or spelled containership) is a cargo ship that carries all of its load in truck-size intermodal containers, in a technique called containerization.
Container ships are a common means of commercial intermodal freight transport and now carry most seagoing non-bulk cargo.Container ship capacity is measured in twenty-foot equivalent units (TEU). Typical loads are a mix of 20-foot (1-TEU) and 40-foot (2-TEU) ISO-standard containers, with the latter predominant.
Today, about 90% of non-bulk cargo worldwide is transported by container ships, and the largest modern container ships can carry up to 24,000 TEU (e.g., Ever Ace). Container ships now rival crude oil tankers and bulk carriers as the largest commercial seaborne vessels.
Click on any of the following blue hyperlinks for more about Container Ships:
Cargo ships are usually specially designed for the task, often being equipped with cranes and other mechanisms to load and unload, and come in all sizes. Today, they are almost always built of welded steel, and with some exceptions generally have a life expectancy of 25 to 30 years before being scrapped.
Definitions:
The words cargo and freight have become interchangeable in casual usage. Technically, "cargo" refers to the goods carried aboard the ship for hire, while "freight" refers to the act of carrying of such cargo, but the terms have been used interchangeably for centuries.
Generally, the modern ocean shipping business is divided into two classes:
- Liner business: typically (but not exclusively) container vessels (wherein "general cargo" is carried in 20- or 40-foot containers), operating as "common carriers", calling at a regularly published schedule of ports. A common carrier refers to a regulated service where any member of the public may book cargo for shipment, according to long-established and internationally agreed rules.
- Tramp-tanker business: generally this is private business arranged between the shipper and receiver and facilitated by the vessel owners or operators, who offer their vessels for hire to carry bulk (dry or liquid) or break bulk (cargoes with individually handled pieces) to any suitable port(s) in the world, according to a specifically drawn contract, called a charter party.
Larger cargo ships are generally operated by shipping lines: companies that specialize in the handling of cargo in general. Smaller vessels, such as coasters, are often owned by their operators.
Types:
Cargo ships/freighters can be divided into seven groups, according to the type of cargo they carry. These groups are:
- Feeder ship
- General cargo vessels
- Container ships: see next article below.
- Tankers
- Dry bulk carriers
- Multi-purpose vessels
- Reefer ships
- Roll-on/roll-off vessels.
Click on any of the following blue hyperlinks for more about Cargo Ships:
- Rough synopses of cargo ship types
- Specialized cargo ship types
- Size categories
- History
- Piracy
- Vessel prefixes
- Famous cargo ships
- Pollution
- See also:
- Classification of European Inland Waterways—standards determining vessel sizes on rivers and canals of Europe
- MARPOL 73/78—related to pollution: "Amended Regulation 14 concerns mandatory fuel oil change over procedures for vessels entering or leaving SECA areas and FO sulphur limits."
- Merchant Navy (United Kingdom)
- Merchant vessel
- Ship transport
- United States Merchant Marine
- Vessel size groups
- Cargo ship: general structure and arrangement by picture
A container ship (also called boxship or spelled containership) is a cargo ship that carries all of its load in truck-size intermodal containers, in a technique called containerization.
Container ships are a common means of commercial intermodal freight transport and now carry most seagoing non-bulk cargo.Container ship capacity is measured in twenty-foot equivalent units (TEU). Typical loads are a mix of 20-foot (1-TEU) and 40-foot (2-TEU) ISO-standard containers, with the latter predominant.
Today, about 90% of non-bulk cargo worldwide is transported by container ships, and the largest modern container ships can carry up to 24,000 TEU (e.g., Ever Ace). Container ships now rival crude oil tankers and bulk carriers as the largest commercial seaborne vessels.
Click on any of the following blue hyperlinks for more about Container Ships:
- History
- Architecture
- Fleet characteristics
- Container ports
- Losses and safety problems
- See also:
- BBC Box
- Container on barge
- Environmental impact of shipping
- List of largest container ships
- List of world's longest ships
- Ship resistance and propulsion
- Ancient and modern mariners: The romance of the high seas in an age of quantification – article in The Economist about a voyage on a 21st-century container ship
- Rodrigo de Larrucea, Jaime. "Container Ship Safety" (PDF). Retrieved 19 April 2012.
Tesla, Inc. (American multinational automotive and clean energy company)
TOP: Tesla Model S and Tesla Model X
BOTTOM: Tesla Model 3 and Tesla Model Y
Below Pictures: Tesla Motors Logo
- YouTube Video: How does the Tesla Model S Electric Car work ?
- YouTube Video: Tesla Model S - Official Walkthrough HD
- YouTube Video: Tesla Model 3 vs Model S Motor
TOP: Tesla Model S and Tesla Model X
BOTTOM: Tesla Model 3 and Tesla Model Y
Below Pictures: Tesla Motors Logo
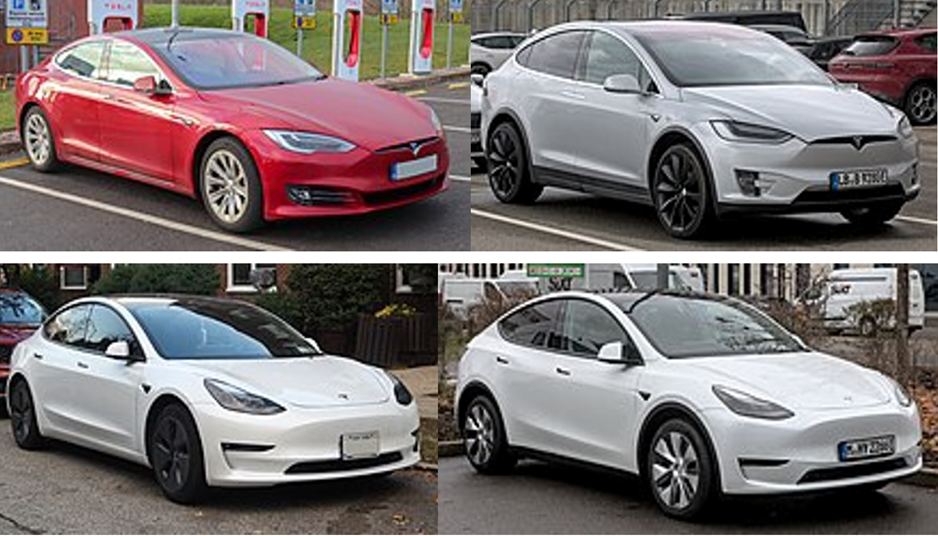
LEFT: Tesla Motors Logo
Tesla, Inc. is an American multinational automotive and clean energy company headquartered in Austin, Texas.
Tesla designs and manufactures:
Its subsidiary Tesla Energy develops and is a major installer of photovoltaic systems in the United States and is one of the largest global suppliers of battery energy storage systems with 6.5 gigawatt-hours (GWh) installed in 2022.
Tesla is one of the world's most valuable companies and, as of 2023, is the world's most valuable automaker. In 2022, the company led the battery electric vehicle market, with 18% share.
Tesla was incorporated in July 2003 by Martin Eberhard and Marc Tarpenning as Tesla Motors. The company's name is a tribute to inventor and electrical engineer Nikola Tesla.
In February 2004, via a $6.5 million investment, Elon Musk became the company's largest shareholder. He became CEO in 2008. Tesla's announced mission is to create products which help "accelerate the world’s transition to sustainable energy."
Tesla began production of its first car model, the Roadster sports car, in 2008. This was followed by:
The company plans production of the Cybertruck light-duty pickup truck in 2023. The Model 3 is the all-time bestselling plug-in electric car worldwide, and in June 2021 became the first electric car to sell 1 million units globally.
Tesla's 2022 deliveries were around 1.31 million vehicles, a 40% increase over the previous year, and cumulative sales totaled 4 million cars as of April 2023. In October 2021, Tesla's market capitalization temporarily reached $1 trillion, the sixth company to do so in U.S. history.
Tesla has been the subject of lawsuits, government scrutiny, and journalistic criticism, stemming from allegations of whistleblower retaliation, worker rights violations, product defects, and Musk's many controversial statements.
History:
Main article: History of Tesla, Inc.
Founding (2003–2004):
The company was incorporated as Tesla Motors, Inc. on July 1, 2003, by Martin Eberhard and Marc Tarpenning. Eberhard and Tarpenning served as CEO and CFO, respectively. Eberhard said he wanted to build "a car manufacturer that is also a technology company", with its core technologies as "the battery, the computer software, and the proprietary motor".
Ian Wright was Tesla's third employee, joining a few months later.
In February 2004, the company raised US$7.5 million (equivalent to $12 million in 2022) in series A funding, including $6.5 million (equivalent to $10 million in 2022) from Elon Musk, who had received $100 million from the sale of his interest in PayPal two years earlier.
Musk became the chairman of the board of directors and the largest shareholder of Tesla. J. B. Straubel joined Tesla in May 2004 as chief technical officer.
A lawsuit settlement agreed to by Eberhard and Tesla in September 2009 allows all five – Eberhard, Tarpenning, Wright, Musk, and Straubel – to call themselves co-founders.
Roadster (2005–2009):
Main article: Tesla Roadster (first generation)
Elon Musk took an active role within the company and oversaw Roadster product design at a detailed level, but was not deeply involved in day-to-day business operations. The company's strategy was to start with a premium sports car aimed at early adopters and then move into more mainstream vehicles, including sedans and affordable compacts.
In February 2006, Musk led Tesla's Series B venture capital funding round of $13 million, which added Valor Equity Partners to the funding team.
Musk co-led the third, $40 million round in May 2006 which saw investment from prominent entrepreneurs including Google co-founders Sergey Brin and Larry Page, and former eBay President Jeff Skoll.
A fourth round worth $45 million in May 2007 brought the total private financing investment to over $105 million.
Tesla's first car, the Roadster, was officially revealed to the public on July 19, 2006, in Santa Monica, California, at a 350-person invitation-only event held in Barker Hangar at Santa Monica Airport.
In August 2007, Eberhard was asked by the board, led by Elon Musk, to step down as CEO.
Eberhard then took the title of "President of Technology" before ultimately leaving the company in January 2008.
Co-founder Marc Tarpenning, who served as the Vice President of Electrical Engineering of the company, also left the company in January 2008.
In August 2007, Michael Marks was brought in as interim CEO, and in December 2007, Ze'ev Drori became CEO and President. Musk succeeded Drori as CEO in October 2008.
In June 2009, Eberhard filed a lawsuit against Musk for allegedly forcing him out.
Tesla began production of the Roadster in 2008 inside the service bays of a former Chevrolet dealership in Menlo Park. By January 2009, Tesla had raised $187 million and delivered 147 cars. Musk had contributed $70 million of his own money to the company.
In June 2009, Tesla was approved to receive $465 million in interest-bearing loans from the United States Department of Energy. The funding, part of the $8 billion Advanced Technology Vehicles Manufacturing Loan Program, supported the engineering and production of the Model S sedan, as well as the development of commercial powertrain technology. Tesla repaid the loan in May 2013, with $12 million in interest.
IPO, Model S, and Model X (2010–2015):
In May 2010, Tesla purchased what would later become the Tesla Factory in Fremont, California, from Toyota for $42 million, and opened the facility in October 2010 to start production of the Model S.
On June 29, 2010, the company became a public company via an initial public offering (IPO) on NASDAQ, the first American car company to do so since the Ford Motor Company had its IPO in 1956. The company issued 13.3 million shares of common stock at a price of $17 per share, raising $226 million.
In January 2012, Tesla ceased production of the Roadster, and in June the company launched its second car, the Model S luxury sedan. The Model S won several automotive awards during 2012 and 2013, including the 2013 Motor Trend Car of the Year, and became the first electric car to top the monthly sales ranking of a country, when it achieved first place in the Norwegian new car sales list in September 2013. The Model S was also the bestselling plug-in electric car worldwide for the years 2015 and 2016.
Tesla announced the Tesla Autopilot, a driver-assistance system, in 2014. In September that year, all Tesla cars started shipping with sensors and software to support the feature, with what would later be called "hardware version 1".
Tesla entered the energy storage market, unveiling its Tesla Powerwall (home) and Tesla Powerpack (business) battery packs in April 2015. The company received orders valued at $800 million within a week of the unveiling.
Tesla began shipping its third vehicle, the luxury SUV Tesla Model X, in September 2015, at which time it had 25,000 pre-orders.
SolarCity and Model 3 (2016–2018):
Tesla entered the solar installation business in November 2016 with the purchase of SolarCity, in an all-stock $2.6 billion deal. The business was merged with Tesla's existing battery energy storage products division to form the Tesla Energy subsidiary.
The deal was controversial because at the time of the acquisition, SolarCity was facing liquidity issues of which Tesla's shareholders were not informed. In February 2017, Tesla Motors changed its name to Tesla, Inc. to better reflect the scope of its expanded business.
Tesla unveiled its first mass market vehicle in April 2016, the Model 3 sedan. Compared Tesla's previous luxury vehicles, the Model 3 was less expensive and within a week the company received over 325,000 paid reservations.
In an effort to speed up production and control costs, Tesla invested heavily in robotics and automation to assemble the Model 3. Instead, the robotics actually slowed the production of the vehicles, leading to significant delays and production problems, a period which the company would later come to describe as "production hell."
By the end of 2018, the production problems had been overcome, and the Model 3 would become the world's bestselling electric car from 2018 to 2021. This period of production hell put significant financial pressure on Tesla, and during this time it became one of the most shorted companies in the market.
On August 8, 2018, amid the financial issues, Musk posted on social media that he was considering taking Tesla private. The plan did not materialize and gave rise to much controversy and many lawsuits including a securities fraud charge from the SEC, which would force Musk to step down as the company's chairman, although he was allowed to remain CEO.
Global expansion and Model Y (2019–present):
From July 2019 to June 2020, Tesla reported four consecutive profitable quarters for the first time, which made it eligible for inclusion in the S&P 500.
Tesla was added to the index on December 21, 2020. It was the most valuable company ever added, already the sixth-largest member. During 2020, the share price increased 740%, and on January 26, 2021, its market capitalization reached $848 billion, more than the next nine largest automakers combined and becoming the US' 5th most valuable company.
In July 2020, Tesla reached a valuation of $206 billion, surpassing Toyota to become the world's most valuable automaker. On August 31, 2020, Tesla completed a 5-for-1 stock split.
Tesla introduced its second mass-market vehicle in March 2019, the Model Y mid-size crossover SUV, based on the Model 3. Deliveries started in March 2020.
During this period, Tesla invested heavily in expanding its production capacity, opening three new Gigafactories in quick succession. Construction of Gigafactory Shanghai started in January 2019, as the first automobile factory in China fully owned by a foreign company (not a joint venture).
The first production vehicle, a Model 3, rolled out of the factory in December, less than one year after groundbreaking.
Gigafactory Berlin-Brandenburg broke ground in February 2020, and production of the Model Y began in March 2022.
Gigafactory Texas broke ground in June 2020, and production of the Model Y began in April 2022. Tesla has also announced plans for a Gigafactory Mexico to open in 2025.
The COVID-19 pandemic had a significant impact on the entire automotive industry, and Tesla was no exception. Government officials in China closed Gigafactory Shanghai and lawmakers in California shut down production at the Tesla Fremont Factory.
While China allowed Tesla to resume production a few weeks later, California did not. Tesla would ultimately defy state orders, and restart production on May 11, 2020.
After the dispute with California officials, on December 1, 2021, Tesla moved its legal headquarters to Gigafactory Texas. However, Tesla continued to use its former headquarters building in Palo Alto, and over the next two years significantly expanded its footprint in California.
The company opened its Megafactory to build Megapack batteries in Lathrop, California in 2022, and announced in February 2023 that it would establish a large global engineering headquarters in Palo Alto, moving into a corporate campus once owned by Hewlett Packard.
Tesla became a major investor in bitcoin, acquiring $1.5 billion of the cryptocurrency, and on March 24, 2021, the company started accepting bitcoin as a form of payment for US vehicle purchases.
However, after 49 days, the company ended bitcoin payments over concerns that the production of bitcoin was contributing to the consumption of fossil fuels, against the company's mission of encouraging the transition to sustainable energy. After the announcement, the price of bitcoin dropped around 12%. In July 2022 it was reported that Tesla had sold about 75% of its bitcoin holdings at a loss, citing that the cryptocurrency was hurting the company's profitability.
Automotive products and services:
"Tesla electric car" redirects here. Not to be confused with Nikola Tesla electric car hoax.
As of December 2022, Tesla offers five vehicle models: Model S, Model X, Model 3, Model Y, and the Tesla Semi. Tesla's first vehicle, the first-generation Tesla Roadster, is no longer sold. Tesla has plans for a second-generation Roadster and a pickup called the Cybertruck.
Available
Model S
Main article: Tesla Model S
The Model S is a full-size luxury car with a liftback body style and a dual motor, all-wheel drive layout. Development of the Model S began prior to 2007 and deliveries started in June 2012. The Model S has seen two major design refreshes, first in April 2016 which introduced a new front-end design and again in June 2021 which revised the interior. The Model S was the top-selling plug-in electric car worldwide in 2015 and 2016. Since its introduction, more than 250,000 vehicles have been sold.
Model X
Main article: Tesla Model X
The Model X is a mid-size luxury crossover SUV offered in 5-, 6- and 7-passenger configurations with either a dual- or tri-motor, all-wheel drive layout. The rear passenger doors open vertically with an articulating "falcon-wing" design. A prototype Model X was first shown in February 2012 and deliveries started in September 2015. The Model X shares around 30 percent of its content with the Model S. The vehicle has seen one major design refresh in June 2021 which revised the interior.
Model 3
Main article: Tesla Model 3
The Model 3 is a mid-size car with a fastback body style and either a dual-motor, all-wheel drive layout or a rear-motor, rear-wheel drive layout. The vehicle was designed to be more affordable than the luxury Model S sedan. A prototype Model 3 was first shown in 2016 and within a week the company received over 325,000 paid reservations. Deliveries started in July 2017. The Model 3 ranked as the world's bestselling electric car from 2018 to 2021, and cumulative sales passed 1 million in June 2021. The vehicle has seen one major design refresh in September 2023 which revised the exterior and interior.
Model Y
Main article: Tesla Model Y
The Model Y is a mid-size crossover SUV offered in 5- and 7-passenger configurations with a dual-motor, all-wheel drive layout. The vehicle was designed to be more affordable than the luxury Model X SUV. A prototype Model Y was first shown in March 2019, and deliveries started in March 2020. The Model Y shared around 75 percent of its content with the Model 3. In the first quarter of 2023, the Model Y outsold the Toyota Corolla to become the world's best-selling car, the first ever electric vehicle to claim the title.
Tesla Semi
Main article: Tesla Semi
The Tesla Semi Class 8 semi-truck by Tesla, Inc. with a tri-motor, rear-wheel drive layout. Tesla claims that the Semi has approximately three times the power of a typical diesel semi truck, a range of 500 miles (800 km). Two prototype trucks were first shown in November 2017 and initial deliveries were made to PepsiCo on December 1, 2022. As of July 2023, the truck remains in pilot production, and Tesla does not expect the truck to enter volume production before 2024, due to limited availability of the required 4680 battery cells.
Announced products:
Cybertruck
Main article: Tesla Cybertruck
The Cybertruck is a pickup truck unveiled on November 21, 2019. The truck's novel design made of flat sheets of unpainted stainless steel and bulletproof glass windows earned a mixed reception. As of February 2023, Musk has stated that deliveries are planned to begin by the end of Q3 2023.
Roadster (second generation)
Main article: Tesla Roadster (second generation)
On November 16, 2017, Tesla unveiled the second generation Roadster with a purported range of 620 miles (1,000 km) with a 200 kilowatt-hours (720 MJ) battery pack that would achieve 0–60 miles per hour (0–97 km/h) in 1.9 seconds; and 0–100 mph (0–161 km/h) in 4.2 seconds, and a top speed over 250 mph (400 km/h). A "SpaceX Package" would include cold-gas thrusters. The vehicle would have three electric motors, allowing all-wheel drive and torque vectoring during cornering. The base price was set at $200,000. Musk has said that the Roadster should ship in 2024.
Tesla next-generation vehicle
Main article: Tesla next-generation vehicle
The Tesla next-generation vehicle is an announced battery electric platform. It would become the third platform for the company. Vehicles based on this platform are not expected before 2025.
Discontinued
Tesla Roadster
Main article: Tesla Roadster (first generation)
The original Tesla Roadster was a two-seater sports car, evolved from the Lotus Elise chassis. It was produced from 2008 to 2012. The Roadster was the first highway-legal serial production electric car to use lithium-ion battery cells and the first production all-electric car to travel more than 200 miles (320 km) per charge.
Services:
Tesla uses over-the-air updates to deliver software and firmware updates, adding features, fixing defects, and resolving product recalls. The Tesla App can be used to enable/disable features such as enhanced connectivity, and Autopilot/Full-Self Driving. acceleration boost (for Model 3 owners), and rear-heated seats (for Model 3 owners).
Connectivity:
Tesla cars come with "Standard Connectivity", which provides navigation using a cellular connection, and the following: over Wi-Fi or Bluetooth:
Vehicle servicing:
Tesla service strategy is to service its vehicles first through remote diagnosis and repair. If it is not possible to resolve a problem remotely, customers are referred to a local Tesla-owned service center, or a mobile technician is dispatched. Tesla has said that it does not want to make a profit on vehicle servicing, which has traditionally been a large profit center for most auto dealerships.
In 2016, Tesla recommended having any Tesla car inspected every 12,500 miles or once a year, whichever comes first. In early 2019, the manual was changed to say: "your Tesla does not require annual maintenance and regular fluid changes," and instead it recommends periodic servicing of the brake fluid, air conditioning, tires and air filters.
Charging:
Supercharger network
Main article: Tesla Supercharger
The Supercharger network was introduced on September 24, 2012, as the Tesla Model S entered production, with six sites in California, Nevada and Arizona. As of September 2023, Tesla operates a network of 5,500 Supercharger stations with 50,000 connectors. The stations are primarily deployed in three regions: Asia Pacific (over 2,000), North America (over 2,000) and Europe (over 1,000). Superchargers supply electrical power at 72 kilowatts (kW), 100 kW, 150 kW or 250 kW, with the maximum amount increasing over the years as the company improves its technology.
Destination charging location network
In 2014, Tesla launched the Destination Charging location network that provides chargers to hotels, restaurants, shopping centers, resorts, and other locations. It offers twice the power of a typical home charging station. Destination chargers are installed free of charge. Larger locations may charge for power.
North American Charging Standard
Main article: North American Charging Standard
The North American Charging Standard (NACS) is an electric vehicle charging connector system developed and owned by Tesla. It has been used on all North American market Tesla vehicles since 2012 and was opened for use to other manufacturers in 2022. The following have announced that they intended to equip future vehicles with NACS charging inlets:
Several electric vehicle charging network operators and equipment manufacturers have announced plans to add NACS connectors.
Insurance:
Tesla has offered its own vehicle insurance in the United States since 2017 and has been acting as an independent insurance producer since 2021 as Tesla Insurance Services, Inc. It was introduced after the American Automobile Association (AAA), a major insurance carrier, raised rates for Tesla owners in June 2017 after a report concluded that the automakers vehicles crashed more often and were more expensive to repair than comparable vehicles. A second study by the Insurance Institute for Highway Safety confirmed the findings.
The company says that it uniquely understands its vehicles, technology and repair costs, and can eliminate traditional insurance carriers' additional charges. In states where allowed, the company uses individual vehicle data to offer personalized pricing that can increase or decrease in cost based on the prior month's driving safety score. As of 2023, insurance was available in 12 states.
As of January 2023, Tesla offers insurance in the U.S. states of:
The company also offers insurance for Tesla vehicle owners with non-Tesla vehicles.
Energy products:
Main article: Tesla Energy
Tesla subsidiary Tesla Energy develops, builds, sells and installs solar energy generation systems and battery energy storage products (as well as related products and services) to residential, commercial and industrial customers. The subsidiary was created by the merger of Tesla's existing battery energy storage products division with SolarCity, a solar energy company that Tesla acquired in 2016.
In 2022, the company deployed solar energy systems capable of generating 348 megawatts, an increase of 3 megawatts over 2021, and deployed 6.5 gigawatt-hours of battery energy storage products, an increase of 64% over 2021.
Tesla Energy products include solar panels (built by other companies for Tesla), the Tesla Solar Roof (a solar shingle system) and the Tesla Solar Inverter. Storage products include the Powerwall (a home energy storage device) and the Megapack (a large-scale energy storage system).
For large-scale customers, Tesla Energy operates an online platform which allows for automated, real-time power trading, demand forecasting and product control. In March 2021, the company said its online products were managing over 1.2 GWh of storage. For home customers, the company operates a virtual power company in Texas called Tesla Electric, which utilizes the company's online platforms to manage customers Powerwall devices, discharging them into the grid to sell power when prices are high, earning money for customers.
Business strategy
At the time of Tesla's founding in 2003, electric vehicles were very expensive. In 2006, Elon Musk stated that Tesla's strategy was to first produce high-price, low-volume vehicles, such as sports cars, for which customers are less sensitive to price. This would allow them to progressively bring down the cost of batteries, which in turn would allow them to offer cheaper and higher volume cars:
Tesla continuously updates the hardware of its cars rather than waiting for a new model year, as opposed to nearly every other car manufacturer.
Unlike other automakers, Tesla does not rely on franchised dealerships to sell vehicles. Instead, the company directly sells vehicles through its website and a network of company-owned stores.
The company is the first automaker in the United States to sell cars directly to consumers. Some jurisdictions, particularly in the United States, prohibit auto manufacturers from directly selling vehicles to consumers. In these areas, Tesla has locations that it calls galleries that the company says "educate and inform customers about our products, but such locations do not actually transact in the sale of vehicles."
In total, Tesla operates nearly 400 stores and galleries in more than 35 countries. These locations are typically located in retail shopping districts, inside shopping malls, or other high-traffic areas, instead of near other auto dealerships.
Analysts describe Tesla as vertically integrated given how it develops many components in-house, such as batteries, motors, and software. The practice of vertical integration is rare in the automotive industry, where companies typically outsource 80% of components to suppliers and focus on engine manufacturing and final assembly.
Tesla generally allows its competitors to license its technology, stating that it wants to help its competitors accelerate the world's use of sustainable energy. Licensing agreements include provisions whereby the recipient agrees not to file patent suits against Tesla, or to copy its designs directly. Tesla retains control of its other intellectual property, such as trademarks and trade secrets to prevent direct copying of its technology.
Technology:
Tesla is highly vertically integrated and develops many components in-house, such as batteries, motors, and software.
Batteries
As of 2023, Tesla uses four different battery cell form factors:
Tesla purchases these batteries from three suppliers, CATL, LG Energy Solution, and Panasonic, the latter of which has co-located some of its battery production inside Tesla's Gigafactory Nevada. Tesla is also currently building out the capacity to produce its own batteries.
Tesla batteries sit under the vehicle floor to save interior space. Tesla uses a multi-part aluminum and titanium protection system to protect the battery from road debris and/or vehicle crashes.
Business analysis company BloombergNEF estimated Tesla's battery pack cost in 2021 at $112 per kilowatt-hour (kWh), versus an industry average of $132 per kWh.
18650:
Tesla was the first automaker to use cylindrical, lithium-ion battery cells. When it built the first generation Roadster, it used off-the-shelf 18650-type (18 mm diameter, 65 mm height) cylindrical batteries that were already used for other consumer electronics. The cells provided an engineering challenge because each has a relatively low capacity, so thousands needed to be bundled together in a battery pack.
Electrical and thermal management also proved to be a challenge, requiring liquid cooling and an intumescent fire prevention chemical. However, the decision proved to be pragmatic because there was already a mature manufacturing process that could produce a high volume of the cells at a consistent quality.
Although the 18650-type cells are the oldest technology, they are used in the Model S and X vehicles. Tesla sources these batteries with a nickel-cobalt-aluminum (NCA) cathode chemistry from Panasonic's factories in Japan.
2170:
The next battery type to be used was 2170-type (21 mm diameter, 70 mm height) cylindrical cell. The larger size was optimized for electric cars, allowing for a higher capacity per cell and a lower number of cells per battery pack. The 2170 was introduced for the Model 3 and Y vehicles.
For vehicles built at the Tesla Fremont Factory, the company sources 2170-type batteries with a nickel-cobalt-aluminum cathode chemistry from Panasonic's production line at Gigafactory Nevada. In January 2021, Panasonic had the capacity to produce 39 GWh per year of battery cells there. Tesla Energy also uses 2170 cells in its Powerwall home energy storage product.
For vehicles made at Gigafactory Shanghai and Gigafactory Berlin-Brandenburg batteries with a nickel-cobalt-manganese (NMC) cathode chemistry are sourced from LG Energy Solution's factories in China.
4680:
Tesla's latest cylindrical cell design is the 4680-type (46 mm diameter, 80 mm height) introduced in 2021. The battery was developed in-house by Tesla and is physically 5-times bigger than the 2170-type, again allowing for a higher capacity per cell and a lower number of cells per battery pack.
Currently, Tesla builds the 4680 cells itself and has not disclosed the cathode chemistry. The company has already opened production lines in Fremont, California and plans to open lines inside Gigafactory Nevada and Gigafactory Texas. The 4680 cells are used in the Model Y and Cybertruck built at Gigafactory Texas.
Prismatic:
Tesla also uses prismatic (rectangular) cells in many entry-level Model 3 and Model Y vehicles. The prismatic cells are a lithium iron phosphate battery (LFP or LiFePO
4) which is a less energy-dense type, but do not contain any nickel or cobalt, which makes it less expensive to produce. Tesla sources these batteries from CATL's factories in China. As of April 2022, nearly half of Tesla's vehicle production used prismatic cells. Tesla Energy also uses prismatic cells in its Megapack grid-scale energy storage product.
Research:
Tesla invests in lithium-ion battery research. In 2016, the company established a 5-year battery research and development partnership at Dalhousie University in Nova Scotia, Canada, with lead researcher Jeff Dahn. Tesla acquired Maxwell Technologies for over $200 million – and sold in 2021. It also acquired Hibar Systems. Tesla purchased several battery manufacturing patent applications from Springpower International, a small Canadian battery company.
Motors:
Tesla makes two kinds of electric motors. Its oldest design in production is a three-phase four-pole alternating current induction motor with a copper rotor (which inspired the Tesla logo), which is used as the rear motor in the Model S and Model X. Newer, higher-efficiency permanent magnet motors are used in the Model 3, Model Y, the front motor of 2019-onward versions of the Model S and X, and are expected to be used in the Tesla Semi. The permanent magnet motors are more efficient, especially in stop-start driving.
Autopilot:
Main article: Tesla Autopilot
Autopilot is an advanced driver-assistance system developed by Tesla. The system requires active driver supervision at all times.
Since September 2014, all Tesla cars are shipped with sensors (initially hardware version 1 or "HW1") and software to support Autopilot.
Tesla upgraded its sensors and software in October 2016 ("HW2") to support full self-driving in the future:
In April 2019, Tesla announced that all of its cars will include Autopilot software (defined as just Traffic-Aware Cruise Control and Autosteer (Beta)) as a standard feature moving forward. Full self-driving software:
In 2020, Tesla released software updates where its cars recognize and automatically stop at stop signs and traffic lights.
In May 2021, Tesla removed the radar sensor and radar features from its Model 3 and Model Y vehicles, opting instead to rely on camera vision alone.
The New York Times reported in December 2021 that Musk "repeatedly told members of the Autopilot team that humans could drive with only two eyes and that this meant cars should be able to drive with cameras alone," an analogy some experts and former Tesla engineers described as "deeply flawed."
Similarly, a statistical analysis conducted in A Methodology for Normalizing Safety Statistics of Partially Automated Vehicles debunked a common Tesla claim that Autopilot reduced crash rates by 40 percent by accounting for the relative safety of the given operating domain when using active safety measures.
Full Self-Driving:
Main article: Tesla Autopilot § Full Self-Driving
Full Self-Driving (FSD) is an optional extension of Autopilot promoted as eventually being able to perform fully autonomous driving. At the end of 2016, Tesla expected to demonstrate full autonomy by the end of 2017, which as of July 2022 has not occurred.
The first beta version of the software was released on October 22, 2020, to a small group of testers. The release of the beta has renewed concern regarding whether the technology is ready for testing on public roads. The National Transportation Safety Board (NTSB) has called for "tougher requirements" for any testing of Autopilot on public roads.
Tesla's approach to achieve full autonomy is different from that of other companies. Whereas Waymo, Cruise, and other companies are relying on highly detailed (centimeter-scale) three-dimensional maps, lidar, and cameras, as well as radar and ultrasonic sensors in their autonomous vehicles, Tesla's approach is to use coarse-grained two-dimensional maps and cameras (no lidar) as well as radar and ultrasonic sensors.
Tesla claims that although its approach is much more difficult, it will ultimately be more useful, because its vehicles will be able to self-drive without geofencing concerns.
Tesla's self-driving software has been trained on over 20 billion miles driven by Tesla vehicles as of January 2021. Tesla also designed a self-driving computer chip that has been installed in its cars since March 2019.
Most experts believe that Tesla's approach of trying to achieve full self-driving by eschewing lidar and high-definition maps is not feasible.
In March 2021, according to a letter that Tesla sent to the California Department of Motor Vehicles about FSD's capability – acquired by PlainSite via a public records request – Tesla stated that FSD is not capable of autonomous driving and is only at Society of Automotive Engineers Level 2 automation.
In a May 2021 study by Guidehouse Insights, Tesla was ranked last for both strategy and execution in the autonomous driving sector. In October 2021, the National Transportation Safety Board (NTSB) called on Tesla to change the design of its Autopilot to ensure it cannot be misused by drivers, according to a letter sent to Musk.
Robotics:
Ahead of the start of production of the Model 3, Tesla invested heavily in robotics and automation to assemble vehicles. To that end, between 2015 and 2017, the company purchased several companies involved in automation and robotics including:
Elon Musk later admitted that the robotics actually slowed the production of the vehicles.
Tesla uses massive casting machines (Giga Press), to make large single pieces of vehicle underbodies and to streamline production.
In September 2022, Tesla revealed prototypes of a humanoid robot named Optimus, which Musk has stated uses the same core software as FSD. During the presentations at Tesla's AI Day 2022, Musk suggested that, among other use cases, the finalized version of Optimus could be used in Tesla's car factories to help with repetitive tasks and relieve labor shortages.
In July 2023, Tesla acquired Wiferion, a Germany-based developer of wireless charging systems for industrial vehicles and autonomous robots, which has since been operating as Tesla Engineering Germany GmbH.
Glass:
In November 2016, the company announced the Tesla Glass technology group. The group produced the roof glass for the Tesla Model 3. It also produces the glass used in the Tesla Solar Roof's solar shingles.
Facilities:
See also: List of Tesla factories
The company operates seven large factories and about a dozen smaller factories around the world. As of 2023, the company also operates more than 1,000 retail stores, galleries, service, delivery and body shop locations globally:
Tesla, Inc. is an American multinational automotive and clean energy company headquartered in Austin, Texas.
Tesla designs and manufactures:
- electric vehicles (cars and trucks),
- stationary battery energy storage devices from home to grid-scale,
- solar panels and solar shingles,
- and related products and services.
Its subsidiary Tesla Energy develops and is a major installer of photovoltaic systems in the United States and is one of the largest global suppliers of battery energy storage systems with 6.5 gigawatt-hours (GWh) installed in 2022.
Tesla is one of the world's most valuable companies and, as of 2023, is the world's most valuable automaker. In 2022, the company led the battery electric vehicle market, with 18% share.
Tesla was incorporated in July 2003 by Martin Eberhard and Marc Tarpenning as Tesla Motors. The company's name is a tribute to inventor and electrical engineer Nikola Tesla.
In February 2004, via a $6.5 million investment, Elon Musk became the company's largest shareholder. He became CEO in 2008. Tesla's announced mission is to create products which help "accelerate the world’s transition to sustainable energy."
Tesla began production of its first car model, the Roadster sports car, in 2008. This was followed by:
- the Model S sedan in 2012,
- the Model X SUV in 2015,
- the Model 3 sedan in 2017,
- the Model Y crossover in 2020,
- and the Tesla Semi truck in 2022.
The company plans production of the Cybertruck light-duty pickup truck in 2023. The Model 3 is the all-time bestselling plug-in electric car worldwide, and in June 2021 became the first electric car to sell 1 million units globally.
Tesla's 2022 deliveries were around 1.31 million vehicles, a 40% increase over the previous year, and cumulative sales totaled 4 million cars as of April 2023. In October 2021, Tesla's market capitalization temporarily reached $1 trillion, the sixth company to do so in U.S. history.
Tesla has been the subject of lawsuits, government scrutiny, and journalistic criticism, stemming from allegations of whistleblower retaliation, worker rights violations, product defects, and Musk's many controversial statements.
History:
Main article: History of Tesla, Inc.
Founding (2003–2004):
The company was incorporated as Tesla Motors, Inc. on July 1, 2003, by Martin Eberhard and Marc Tarpenning. Eberhard and Tarpenning served as CEO and CFO, respectively. Eberhard said he wanted to build "a car manufacturer that is also a technology company", with its core technologies as "the battery, the computer software, and the proprietary motor".
Ian Wright was Tesla's third employee, joining a few months later.
In February 2004, the company raised US$7.5 million (equivalent to $12 million in 2022) in series A funding, including $6.5 million (equivalent to $10 million in 2022) from Elon Musk, who had received $100 million from the sale of his interest in PayPal two years earlier.
Musk became the chairman of the board of directors and the largest shareholder of Tesla. J. B. Straubel joined Tesla in May 2004 as chief technical officer.
A lawsuit settlement agreed to by Eberhard and Tesla in September 2009 allows all five – Eberhard, Tarpenning, Wright, Musk, and Straubel – to call themselves co-founders.
Roadster (2005–2009):
Main article: Tesla Roadster (first generation)
Elon Musk took an active role within the company and oversaw Roadster product design at a detailed level, but was not deeply involved in day-to-day business operations. The company's strategy was to start with a premium sports car aimed at early adopters and then move into more mainstream vehicles, including sedans and affordable compacts.
In February 2006, Musk led Tesla's Series B venture capital funding round of $13 million, which added Valor Equity Partners to the funding team.
Musk co-led the third, $40 million round in May 2006 which saw investment from prominent entrepreneurs including Google co-founders Sergey Brin and Larry Page, and former eBay President Jeff Skoll.
A fourth round worth $45 million in May 2007 brought the total private financing investment to over $105 million.
Tesla's first car, the Roadster, was officially revealed to the public on July 19, 2006, in Santa Monica, California, at a 350-person invitation-only event held in Barker Hangar at Santa Monica Airport.
In August 2007, Eberhard was asked by the board, led by Elon Musk, to step down as CEO.
Eberhard then took the title of "President of Technology" before ultimately leaving the company in January 2008.
Co-founder Marc Tarpenning, who served as the Vice President of Electrical Engineering of the company, also left the company in January 2008.
In August 2007, Michael Marks was brought in as interim CEO, and in December 2007, Ze'ev Drori became CEO and President. Musk succeeded Drori as CEO in October 2008.
In June 2009, Eberhard filed a lawsuit against Musk for allegedly forcing him out.
Tesla began production of the Roadster in 2008 inside the service bays of a former Chevrolet dealership in Menlo Park. By January 2009, Tesla had raised $187 million and delivered 147 cars. Musk had contributed $70 million of his own money to the company.
In June 2009, Tesla was approved to receive $465 million in interest-bearing loans from the United States Department of Energy. The funding, part of the $8 billion Advanced Technology Vehicles Manufacturing Loan Program, supported the engineering and production of the Model S sedan, as well as the development of commercial powertrain technology. Tesla repaid the loan in May 2013, with $12 million in interest.
IPO, Model S, and Model X (2010–2015):
In May 2010, Tesla purchased what would later become the Tesla Factory in Fremont, California, from Toyota for $42 million, and opened the facility in October 2010 to start production of the Model S.
On June 29, 2010, the company became a public company via an initial public offering (IPO) on NASDAQ, the first American car company to do so since the Ford Motor Company had its IPO in 1956. The company issued 13.3 million shares of common stock at a price of $17 per share, raising $226 million.
In January 2012, Tesla ceased production of the Roadster, and in June the company launched its second car, the Model S luxury sedan. The Model S won several automotive awards during 2012 and 2013, including the 2013 Motor Trend Car of the Year, and became the first electric car to top the monthly sales ranking of a country, when it achieved first place in the Norwegian new car sales list in September 2013. The Model S was also the bestselling plug-in electric car worldwide for the years 2015 and 2016.
Tesla announced the Tesla Autopilot, a driver-assistance system, in 2014. In September that year, all Tesla cars started shipping with sensors and software to support the feature, with what would later be called "hardware version 1".
Tesla entered the energy storage market, unveiling its Tesla Powerwall (home) and Tesla Powerpack (business) battery packs in April 2015. The company received orders valued at $800 million within a week of the unveiling.
Tesla began shipping its third vehicle, the luxury SUV Tesla Model X, in September 2015, at which time it had 25,000 pre-orders.
SolarCity and Model 3 (2016–2018):
Tesla entered the solar installation business in November 2016 with the purchase of SolarCity, in an all-stock $2.6 billion deal. The business was merged with Tesla's existing battery energy storage products division to form the Tesla Energy subsidiary.
The deal was controversial because at the time of the acquisition, SolarCity was facing liquidity issues of which Tesla's shareholders were not informed. In February 2017, Tesla Motors changed its name to Tesla, Inc. to better reflect the scope of its expanded business.
Tesla unveiled its first mass market vehicle in April 2016, the Model 3 sedan. Compared Tesla's previous luxury vehicles, the Model 3 was less expensive and within a week the company received over 325,000 paid reservations.
In an effort to speed up production and control costs, Tesla invested heavily in robotics and automation to assemble the Model 3. Instead, the robotics actually slowed the production of the vehicles, leading to significant delays and production problems, a period which the company would later come to describe as "production hell."
By the end of 2018, the production problems had been overcome, and the Model 3 would become the world's bestselling electric car from 2018 to 2021. This period of production hell put significant financial pressure on Tesla, and during this time it became one of the most shorted companies in the market.
On August 8, 2018, amid the financial issues, Musk posted on social media that he was considering taking Tesla private. The plan did not materialize and gave rise to much controversy and many lawsuits including a securities fraud charge from the SEC, which would force Musk to step down as the company's chairman, although he was allowed to remain CEO.
Global expansion and Model Y (2019–present):
From July 2019 to June 2020, Tesla reported four consecutive profitable quarters for the first time, which made it eligible for inclusion in the S&P 500.
Tesla was added to the index on December 21, 2020. It was the most valuable company ever added, already the sixth-largest member. During 2020, the share price increased 740%, and on January 26, 2021, its market capitalization reached $848 billion, more than the next nine largest automakers combined and becoming the US' 5th most valuable company.
In July 2020, Tesla reached a valuation of $206 billion, surpassing Toyota to become the world's most valuable automaker. On August 31, 2020, Tesla completed a 5-for-1 stock split.
Tesla introduced its second mass-market vehicle in March 2019, the Model Y mid-size crossover SUV, based on the Model 3. Deliveries started in March 2020.
During this period, Tesla invested heavily in expanding its production capacity, opening three new Gigafactories in quick succession. Construction of Gigafactory Shanghai started in January 2019, as the first automobile factory in China fully owned by a foreign company (not a joint venture).
The first production vehicle, a Model 3, rolled out of the factory in December, less than one year after groundbreaking.
Gigafactory Berlin-Brandenburg broke ground in February 2020, and production of the Model Y began in March 2022.
Gigafactory Texas broke ground in June 2020, and production of the Model Y began in April 2022. Tesla has also announced plans for a Gigafactory Mexico to open in 2025.
The COVID-19 pandemic had a significant impact on the entire automotive industry, and Tesla was no exception. Government officials in China closed Gigafactory Shanghai and lawmakers in California shut down production at the Tesla Fremont Factory.
While China allowed Tesla to resume production a few weeks later, California did not. Tesla would ultimately defy state orders, and restart production on May 11, 2020.
After the dispute with California officials, on December 1, 2021, Tesla moved its legal headquarters to Gigafactory Texas. However, Tesla continued to use its former headquarters building in Palo Alto, and over the next two years significantly expanded its footprint in California.
The company opened its Megafactory to build Megapack batteries in Lathrop, California in 2022, and announced in February 2023 that it would establish a large global engineering headquarters in Palo Alto, moving into a corporate campus once owned by Hewlett Packard.
Tesla became a major investor in bitcoin, acquiring $1.5 billion of the cryptocurrency, and on March 24, 2021, the company started accepting bitcoin as a form of payment for US vehicle purchases.
However, after 49 days, the company ended bitcoin payments over concerns that the production of bitcoin was contributing to the consumption of fossil fuels, against the company's mission of encouraging the transition to sustainable energy. After the announcement, the price of bitcoin dropped around 12%. In July 2022 it was reported that Tesla had sold about 75% of its bitcoin holdings at a loss, citing that the cryptocurrency was hurting the company's profitability.
Automotive products and services:
"Tesla electric car" redirects here. Not to be confused with Nikola Tesla electric car hoax.
As of December 2022, Tesla offers five vehicle models: Model S, Model X, Model 3, Model Y, and the Tesla Semi. Tesla's first vehicle, the first-generation Tesla Roadster, is no longer sold. Tesla has plans for a second-generation Roadster and a pickup called the Cybertruck.
Available
Model S
Main article: Tesla Model S
The Model S is a full-size luxury car with a liftback body style and a dual motor, all-wheel drive layout. Development of the Model S began prior to 2007 and deliveries started in June 2012. The Model S has seen two major design refreshes, first in April 2016 which introduced a new front-end design and again in June 2021 which revised the interior. The Model S was the top-selling plug-in electric car worldwide in 2015 and 2016. Since its introduction, more than 250,000 vehicles have been sold.
Model X
Main article: Tesla Model X
The Model X is a mid-size luxury crossover SUV offered in 5-, 6- and 7-passenger configurations with either a dual- or tri-motor, all-wheel drive layout. The rear passenger doors open vertically with an articulating "falcon-wing" design. A prototype Model X was first shown in February 2012 and deliveries started in September 2015. The Model X shares around 30 percent of its content with the Model S. The vehicle has seen one major design refresh in June 2021 which revised the interior.
Model 3
Main article: Tesla Model 3
The Model 3 is a mid-size car with a fastback body style and either a dual-motor, all-wheel drive layout or a rear-motor, rear-wheel drive layout. The vehicle was designed to be more affordable than the luxury Model S sedan. A prototype Model 3 was first shown in 2016 and within a week the company received over 325,000 paid reservations. Deliveries started in July 2017. The Model 3 ranked as the world's bestselling electric car from 2018 to 2021, and cumulative sales passed 1 million in June 2021. The vehicle has seen one major design refresh in September 2023 which revised the exterior and interior.
Model Y
Main article: Tesla Model Y
The Model Y is a mid-size crossover SUV offered in 5- and 7-passenger configurations with a dual-motor, all-wheel drive layout. The vehicle was designed to be more affordable than the luxury Model X SUV. A prototype Model Y was first shown in March 2019, and deliveries started in March 2020. The Model Y shared around 75 percent of its content with the Model 3. In the first quarter of 2023, the Model Y outsold the Toyota Corolla to become the world's best-selling car, the first ever electric vehicle to claim the title.
Tesla Semi
Main article: Tesla Semi
The Tesla Semi Class 8 semi-truck by Tesla, Inc. with a tri-motor, rear-wheel drive layout. Tesla claims that the Semi has approximately three times the power of a typical diesel semi truck, a range of 500 miles (800 km). Two prototype trucks were first shown in November 2017 and initial deliveries were made to PepsiCo on December 1, 2022. As of July 2023, the truck remains in pilot production, and Tesla does not expect the truck to enter volume production before 2024, due to limited availability of the required 4680 battery cells.
Announced products:
Cybertruck
Main article: Tesla Cybertruck
The Cybertruck is a pickup truck unveiled on November 21, 2019. The truck's novel design made of flat sheets of unpainted stainless steel and bulletproof glass windows earned a mixed reception. As of February 2023, Musk has stated that deliveries are planned to begin by the end of Q3 2023.
Roadster (second generation)
Main article: Tesla Roadster (second generation)
On November 16, 2017, Tesla unveiled the second generation Roadster with a purported range of 620 miles (1,000 km) with a 200 kilowatt-hours (720 MJ) battery pack that would achieve 0–60 miles per hour (0–97 km/h) in 1.9 seconds; and 0–100 mph (0–161 km/h) in 4.2 seconds, and a top speed over 250 mph (400 km/h). A "SpaceX Package" would include cold-gas thrusters. The vehicle would have three electric motors, allowing all-wheel drive and torque vectoring during cornering. The base price was set at $200,000. Musk has said that the Roadster should ship in 2024.
Tesla next-generation vehicle
Main article: Tesla next-generation vehicle
The Tesla next-generation vehicle is an announced battery electric platform. It would become the third platform for the company. Vehicles based on this platform are not expected before 2025.
Discontinued
Tesla Roadster
Main article: Tesla Roadster (first generation)
The original Tesla Roadster was a two-seater sports car, evolved from the Lotus Elise chassis. It was produced from 2008 to 2012. The Roadster was the first highway-legal serial production electric car to use lithium-ion battery cells and the first production all-electric car to travel more than 200 miles (320 km) per charge.
Services:
Tesla uses over-the-air updates to deliver software and firmware updates, adding features, fixing defects, and resolving product recalls. The Tesla App can be used to enable/disable features such as enhanced connectivity, and Autopilot/Full-Self Driving. acceleration boost (for Model 3 owners), and rear-heated seats (for Model 3 owners).
Connectivity:
Tesla cars come with "Standard Connectivity", which provides navigation using a cellular connection, and the following: over Wi-Fi or Bluetooth:
- internet browsing,
- music streaming (with a paid subscription),
- and, when parked, video streaming and "caraoke".
- "Premium Connectivity" adds cellular access to those features and also provides live traffic and satellite maps for navigation.
Vehicle servicing:
Tesla service strategy is to service its vehicles first through remote diagnosis and repair. If it is not possible to resolve a problem remotely, customers are referred to a local Tesla-owned service center, or a mobile technician is dispatched. Tesla has said that it does not want to make a profit on vehicle servicing, which has traditionally been a large profit center for most auto dealerships.
In 2016, Tesla recommended having any Tesla car inspected every 12,500 miles or once a year, whichever comes first. In early 2019, the manual was changed to say: "your Tesla does not require annual maintenance and regular fluid changes," and instead it recommends periodic servicing of the brake fluid, air conditioning, tires and air filters.
Charging:
Supercharger network
Main article: Tesla Supercharger
The Supercharger network was introduced on September 24, 2012, as the Tesla Model S entered production, with six sites in California, Nevada and Arizona. As of September 2023, Tesla operates a network of 5,500 Supercharger stations with 50,000 connectors. The stations are primarily deployed in three regions: Asia Pacific (over 2,000), North America (over 2,000) and Europe (over 1,000). Superchargers supply electrical power at 72 kilowatts (kW), 100 kW, 150 kW or 250 kW, with the maximum amount increasing over the years as the company improves its technology.
Destination charging location network
In 2014, Tesla launched the Destination Charging location network that provides chargers to hotels, restaurants, shopping centers, resorts, and other locations. It offers twice the power of a typical home charging station. Destination chargers are installed free of charge. Larger locations may charge for power.
North American Charging Standard
Main article: North American Charging Standard
The North American Charging Standard (NACS) is an electric vehicle charging connector system developed and owned by Tesla. It has been used on all North American market Tesla vehicles since 2012 and was opened for use to other manufacturers in 2022. The following have announced that they intended to equip future vehicles with NACS charging inlets:
- Fisker,
- Ford,
- General Motors,
- Honda,
- Mercedes-Benz,
- Nissan,
- Polestar,
- Rivian, and
- Volvo.
Several electric vehicle charging network operators and equipment manufacturers have announced plans to add NACS connectors.
Insurance:
Tesla has offered its own vehicle insurance in the United States since 2017 and has been acting as an independent insurance producer since 2021 as Tesla Insurance Services, Inc. It was introduced after the American Automobile Association (AAA), a major insurance carrier, raised rates for Tesla owners in June 2017 after a report concluded that the automakers vehicles crashed more often and were more expensive to repair than comparable vehicles. A second study by the Insurance Institute for Highway Safety confirmed the findings.
The company says that it uniquely understands its vehicles, technology and repair costs, and can eliminate traditional insurance carriers' additional charges. In states where allowed, the company uses individual vehicle data to offer personalized pricing that can increase or decrease in cost based on the prior month's driving safety score. As of 2023, insurance was available in 12 states.
As of January 2023, Tesla offers insurance in the U.S. states of:
- Arizona,
- California,
- Colorado,
- Illinois,
- Maryland,
- Minnesota,
- Nevada,
- Ohio,
- Oregon,
- Texas,
- Utah
- and Virginia.
The company also offers insurance for Tesla vehicle owners with non-Tesla vehicles.
Energy products:
Main article: Tesla Energy
Tesla subsidiary Tesla Energy develops, builds, sells and installs solar energy generation systems and battery energy storage products (as well as related products and services) to residential, commercial and industrial customers. The subsidiary was created by the merger of Tesla's existing battery energy storage products division with SolarCity, a solar energy company that Tesla acquired in 2016.
In 2022, the company deployed solar energy systems capable of generating 348 megawatts, an increase of 3 megawatts over 2021, and deployed 6.5 gigawatt-hours of battery energy storage products, an increase of 64% over 2021.
Tesla Energy products include solar panels (built by other companies for Tesla), the Tesla Solar Roof (a solar shingle system) and the Tesla Solar Inverter. Storage products include the Powerwall (a home energy storage device) and the Megapack (a large-scale energy storage system).
For large-scale customers, Tesla Energy operates an online platform which allows for automated, real-time power trading, demand forecasting and product control. In March 2021, the company said its online products were managing over 1.2 GWh of storage. For home customers, the company operates a virtual power company in Texas called Tesla Electric, which utilizes the company's online platforms to manage customers Powerwall devices, discharging them into the grid to sell power when prices are high, earning money for customers.
Business strategy
At the time of Tesla's founding in 2003, electric vehicles were very expensive. In 2006, Elon Musk stated that Tesla's strategy was to first produce high-price, low-volume vehicles, such as sports cars, for which customers are less sensitive to price. This would allow them to progressively bring down the cost of batteries, which in turn would allow them to offer cheaper and higher volume cars:
- Tesla's first vehicle, the Roadster, was low-volume (fewer than 2,500 were produced) and priced at over $100,000.
- The next models, the Model S and Model X, are more affordable but still luxury vehicles.
- The most recent models, the Model 3 and the Model Y, are priced still lower, and aimed at a higher volume market, selling over 100,000 vehicles each quarter.
Tesla continuously updates the hardware of its cars rather than waiting for a new model year, as opposed to nearly every other car manufacturer.
Unlike other automakers, Tesla does not rely on franchised dealerships to sell vehicles. Instead, the company directly sells vehicles through its website and a network of company-owned stores.
The company is the first automaker in the United States to sell cars directly to consumers. Some jurisdictions, particularly in the United States, prohibit auto manufacturers from directly selling vehicles to consumers. In these areas, Tesla has locations that it calls galleries that the company says "educate and inform customers about our products, but such locations do not actually transact in the sale of vehicles."
In total, Tesla operates nearly 400 stores and galleries in more than 35 countries. These locations are typically located in retail shopping districts, inside shopping malls, or other high-traffic areas, instead of near other auto dealerships.
Analysts describe Tesla as vertically integrated given how it develops many components in-house, such as batteries, motors, and software. The practice of vertical integration is rare in the automotive industry, where companies typically outsource 80% of components to suppliers and focus on engine manufacturing and final assembly.
Tesla generally allows its competitors to license its technology, stating that it wants to help its competitors accelerate the world's use of sustainable energy. Licensing agreements include provisions whereby the recipient agrees not to file patent suits against Tesla, or to copy its designs directly. Tesla retains control of its other intellectual property, such as trademarks and trade secrets to prevent direct copying of its technology.
Technology:
Tesla is highly vertically integrated and develops many components in-house, such as batteries, motors, and software.
Batteries
As of 2023, Tesla uses four different battery cell form factors:
Tesla purchases these batteries from three suppliers, CATL, LG Energy Solution, and Panasonic, the latter of which has co-located some of its battery production inside Tesla's Gigafactory Nevada. Tesla is also currently building out the capacity to produce its own batteries.
Tesla batteries sit under the vehicle floor to save interior space. Tesla uses a multi-part aluminum and titanium protection system to protect the battery from road debris and/or vehicle crashes.
Business analysis company BloombergNEF estimated Tesla's battery pack cost in 2021 at $112 per kilowatt-hour (kWh), versus an industry average of $132 per kWh.
18650:
Tesla was the first automaker to use cylindrical, lithium-ion battery cells. When it built the first generation Roadster, it used off-the-shelf 18650-type (18 mm diameter, 65 mm height) cylindrical batteries that were already used for other consumer electronics. The cells provided an engineering challenge because each has a relatively low capacity, so thousands needed to be bundled together in a battery pack.
Electrical and thermal management also proved to be a challenge, requiring liquid cooling and an intumescent fire prevention chemical. However, the decision proved to be pragmatic because there was already a mature manufacturing process that could produce a high volume of the cells at a consistent quality.
Although the 18650-type cells are the oldest technology, they are used in the Model S and X vehicles. Tesla sources these batteries with a nickel-cobalt-aluminum (NCA) cathode chemistry from Panasonic's factories in Japan.
2170:
The next battery type to be used was 2170-type (21 mm diameter, 70 mm height) cylindrical cell. The larger size was optimized for electric cars, allowing for a higher capacity per cell and a lower number of cells per battery pack. The 2170 was introduced for the Model 3 and Y vehicles.
For vehicles built at the Tesla Fremont Factory, the company sources 2170-type batteries with a nickel-cobalt-aluminum cathode chemistry from Panasonic's production line at Gigafactory Nevada. In January 2021, Panasonic had the capacity to produce 39 GWh per year of battery cells there. Tesla Energy also uses 2170 cells in its Powerwall home energy storage product.
For vehicles made at Gigafactory Shanghai and Gigafactory Berlin-Brandenburg batteries with a nickel-cobalt-manganese (NMC) cathode chemistry are sourced from LG Energy Solution's factories in China.
4680:
Tesla's latest cylindrical cell design is the 4680-type (46 mm diameter, 80 mm height) introduced in 2021. The battery was developed in-house by Tesla and is physically 5-times bigger than the 2170-type, again allowing for a higher capacity per cell and a lower number of cells per battery pack.
Currently, Tesla builds the 4680 cells itself and has not disclosed the cathode chemistry. The company has already opened production lines in Fremont, California and plans to open lines inside Gigafactory Nevada and Gigafactory Texas. The 4680 cells are used in the Model Y and Cybertruck built at Gigafactory Texas.
Prismatic:
Tesla also uses prismatic (rectangular) cells in many entry-level Model 3 and Model Y vehicles. The prismatic cells are a lithium iron phosphate battery (LFP or LiFePO
4) which is a less energy-dense type, but do not contain any nickel or cobalt, which makes it less expensive to produce. Tesla sources these batteries from CATL's factories in China. As of April 2022, nearly half of Tesla's vehicle production used prismatic cells. Tesla Energy also uses prismatic cells in its Megapack grid-scale energy storage product.
Research:
Tesla invests in lithium-ion battery research. In 2016, the company established a 5-year battery research and development partnership at Dalhousie University in Nova Scotia, Canada, with lead researcher Jeff Dahn. Tesla acquired Maxwell Technologies for over $200 million – and sold in 2021. It also acquired Hibar Systems. Tesla purchased several battery manufacturing patent applications from Springpower International, a small Canadian battery company.
Motors:
Tesla makes two kinds of electric motors. Its oldest design in production is a three-phase four-pole alternating current induction motor with a copper rotor (which inspired the Tesla logo), which is used as the rear motor in the Model S and Model X. Newer, higher-efficiency permanent magnet motors are used in the Model 3, Model Y, the front motor of 2019-onward versions of the Model S and X, and are expected to be used in the Tesla Semi. The permanent magnet motors are more efficient, especially in stop-start driving.
Autopilot:
Main article: Tesla Autopilot
Autopilot is an advanced driver-assistance system developed by Tesla. The system requires active driver supervision at all times.
Since September 2014, all Tesla cars are shipped with sensors (initially hardware version 1 or "HW1") and software to support Autopilot.
Tesla upgraded its sensors and software in October 2016 ("HW2") to support full self-driving in the future:
- HW2 includes eight cameras, twelve ultrasonic sensors, and forward-facing radar.
- HW2.5 was released in mid-2017, and it upgraded HW2 with a second graphics processing unit (GPU) and, for the Model 3 only, a driver-facing camera.
- HW3 was released in early 2019 with an updated and more powerful computer, employing a custom Tesla-designed system on a chip.
In April 2019, Tesla announced that all of its cars will include Autopilot software (defined as just Traffic-Aware Cruise Control and Autosteer (Beta)) as a standard feature moving forward. Full self-driving software:
- Autopark,
- Navigate on Autopilot (Beta),
- Auto Lane Change (Beta),
- Summon (Beta),
- Smart Summon (Beta)
- and future abilities
In 2020, Tesla released software updates where its cars recognize and automatically stop at stop signs and traffic lights.
In May 2021, Tesla removed the radar sensor and radar features from its Model 3 and Model Y vehicles, opting instead to rely on camera vision alone.
The New York Times reported in December 2021 that Musk "repeatedly told members of the Autopilot team that humans could drive with only two eyes and that this meant cars should be able to drive with cameras alone," an analogy some experts and former Tesla engineers described as "deeply flawed."
Similarly, a statistical analysis conducted in A Methodology for Normalizing Safety Statistics of Partially Automated Vehicles debunked a common Tesla claim that Autopilot reduced crash rates by 40 percent by accounting for the relative safety of the given operating domain when using active safety measures.
Full Self-Driving:
Main article: Tesla Autopilot § Full Self-Driving
Full Self-Driving (FSD) is an optional extension of Autopilot promoted as eventually being able to perform fully autonomous driving. At the end of 2016, Tesla expected to demonstrate full autonomy by the end of 2017, which as of July 2022 has not occurred.
The first beta version of the software was released on October 22, 2020, to a small group of testers. The release of the beta has renewed concern regarding whether the technology is ready for testing on public roads. The National Transportation Safety Board (NTSB) has called for "tougher requirements" for any testing of Autopilot on public roads.
Tesla's approach to achieve full autonomy is different from that of other companies. Whereas Waymo, Cruise, and other companies are relying on highly detailed (centimeter-scale) three-dimensional maps, lidar, and cameras, as well as radar and ultrasonic sensors in their autonomous vehicles, Tesla's approach is to use coarse-grained two-dimensional maps and cameras (no lidar) as well as radar and ultrasonic sensors.
Tesla claims that although its approach is much more difficult, it will ultimately be more useful, because its vehicles will be able to self-drive without geofencing concerns.
Tesla's self-driving software has been trained on over 20 billion miles driven by Tesla vehicles as of January 2021. Tesla also designed a self-driving computer chip that has been installed in its cars since March 2019.
Most experts believe that Tesla's approach of trying to achieve full self-driving by eschewing lidar and high-definition maps is not feasible.
In March 2021, according to a letter that Tesla sent to the California Department of Motor Vehicles about FSD's capability – acquired by PlainSite via a public records request – Tesla stated that FSD is not capable of autonomous driving and is only at Society of Automotive Engineers Level 2 automation.
In a May 2021 study by Guidehouse Insights, Tesla was ranked last for both strategy and execution in the autonomous driving sector. In October 2021, the National Transportation Safety Board (NTSB) called on Tesla to change the design of its Autopilot to ensure it cannot be misused by drivers, according to a letter sent to Musk.
Robotics:
Ahead of the start of production of the Model 3, Tesla invested heavily in robotics and automation to assemble vehicles. To that end, between 2015 and 2017, the company purchased several companies involved in automation and robotics including:
- Compass Automation,
- Grohmann Automation,
- Perbix Machine Company,
- and Riviera Tool and Die.
Elon Musk later admitted that the robotics actually slowed the production of the vehicles.
Tesla uses massive casting machines (Giga Press), to make large single pieces of vehicle underbodies and to streamline production.
In September 2022, Tesla revealed prototypes of a humanoid robot named Optimus, which Musk has stated uses the same core software as FSD. During the presentations at Tesla's AI Day 2022, Musk suggested that, among other use cases, the finalized version of Optimus could be used in Tesla's car factories to help with repetitive tasks and relieve labor shortages.
In July 2023, Tesla acquired Wiferion, a Germany-based developer of wireless charging systems for industrial vehicles and autonomous robots, which has since been operating as Tesla Engineering Germany GmbH.
Glass:
In November 2016, the company announced the Tesla Glass technology group. The group produced the roof glass for the Tesla Model 3. It also produces the glass used in the Tesla Solar Roof's solar shingles.
Facilities:
See also: List of Tesla factories
The company operates seven large factories and about a dozen smaller factories around the world. As of 2023, the company also operates more than 1,000 retail stores, galleries, service, delivery and body shop locations globally:
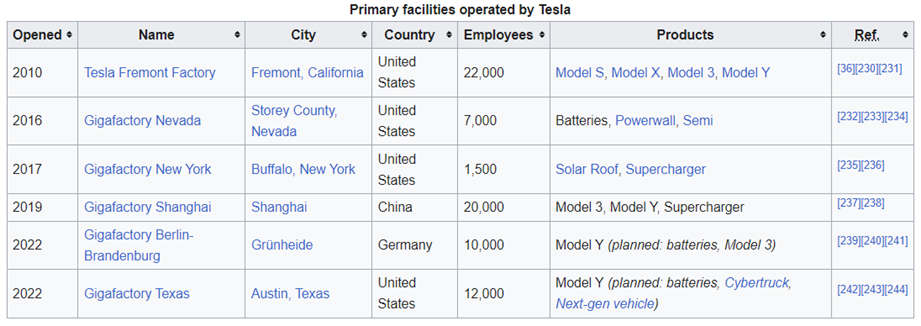
North America:
Tesla was founded in San Carlos, California. In 2010, Tesla moved its corporate headquarters and opened a powertrain development facility in Palo Alto. Tesla's first retail store was opened in 2008 in Los Angeles.
Tesla's first assembly plant occupies the former NUMMI plant in Fremont, California, known as the Tesla Fremont Factory. The factory was originally opened by General Motors in 1962, and then operated by NUMMI, a joint venture of GM and Toyota from 1984. The joint venture ended when GM entered bankruptcy in 2009. In 2010, Toyota agreed to sell the plant to Tesla at a significant discount.
Tesla's first purpose-built facility was opened in Nevada in 2016. Gigafactory Nevada produces:
The factory received substantial subsidies (abatements and credits) from the local and state government, that, in exchange for opening in their jurisdiction, allowed Tesla to operate essentially tax free for 10 years.
As part of the acquisition of SolarCity in 2016, Tesla gained control of Gigafactory New York in Buffalo on the site of a former Republic Steel plant. The state of New York spent cash to build and equip the factory through the Buffalo Billion program. In 2017, the factory started production of the Tesla Solar Roof, but faced multiple production challenges. Since 2020, Tesla has also assembled Superchargers in New York. The plant has been criticized for offering little economic benefit for the state funding.
On July 23, 2020, Tesla picked Austin, Texas, as the site of its fifth Gigafactory, since then known as Gigafactory Texas Giga Texas is planned to be the main factory for the Tesla Cybertruck and the Tesla Semi; it will also produce Model 3 and Model Y cars for the Eastern United States. On April 7, 2022, Tesla celebrated the opening of the facility in a public event.
On December 1, 2021, Tesla relocated its legal headquarters from Palo Alto, California to the Gigafactory site in Austin, Texas.
Tesla acquired a former JC Penney distribution center near Lathrop, California, in 2021 to build the "Megafactory" to manufacture the Megapack, the company's large scale energy storage product. The location opened in 2022.
Tesla announced in February it would open a new global engineering headquarters in Palo Alto, moving into a corporate campus once owned by Hewlett Packard, located a couple of miles from Tesla's former headquarters.
Tesla plans to open Gigafactory Mexico, the company's sixth Gigafactory near Monterrey, Mexico in 2025.
Europe:
Main articles:
Tesla opened its first European store in June 2009 in London. Tesla's European headquarters are in the Netherlands, part of a group of Tesla facilities in Tilburg, including the company's European Distribution Centre.
In late 2016, Tesla acquired German engineering firm Grohmann Engineering as a new division dedicated to helping Tesla increase the automation and effectiveness of its manufacturing process. After winding down existing contracts with other manufacturers, the renamed Tesla Automation now works exclusively on Tesla projects.
Tesla announced its plans to build a car and battery factory in Europe in 2016. Several countries campaigned to be the host, and eventually Germany was chosen in November 2019. On March 22, 2022, Tesla's first European Gigafactory named Gigafactory Berlin-Brandenburg opened with planned capacity to produce 500,000 electric vehicles annually as well as batteries for the cars.
Asia:
Main article: Gigafactory Shanghai
Tesla opened its first showroom in Asia in Tokyo, Japan, in October 2010.
In July 2018, Tesla signed an agreement with Chinese authorities to build a factory in Shanghai, China, which was Tesla's first Gigafactory outside of the United States. The factory building was finished in August 2019, and the initial Tesla Model 3s were in production from Gigafactory Shanghai in October 2019. In 2021, China accounted for 26% of Tesla sales revenue, and was the second largest market for Tesla after the United States, which accounted for 45% of its sales.
Tesla has expressed interest in expanding to India and perhaps building a future Gigafactory in the country. The company established a legal presence in the nation in 2021 and plans to open an office in Pune starting in October 2023.
Partners:
Panasonic
In January 2010, Tesla and battery cell maker Panasonic announced that they would together develop nickel-based lithium-ion battery cells for electric vehicles. The partnership was part of Panasonic's $1 billion investment over three years in facilities for lithium-ion cell research, development and production.
Beginning in 2010, Panasonic invested $30 million for a multi-year collaboration on new battery cells designed specifically for electric vehicles.
In July 2014, Panasonic reached a basic agreement with Tesla to participate in battery production at Giga Nevada.
Tesla and Panasonic also collaborated on the manufacturing and production of photovoltaic (PV) cells and modules at the Giga New York factory in Buffalo, New York. The partnership started in mid-2017 and ended in early 2020, before Panasonic exited the solar business entirely in January 2021.
In March 2021, the outgoing CEO of Panasonic stated that the company plans to reduce its reliance on Tesla as their battery partnership evolves.
Other current partners:
Tesla has long-term contracts in place for lithium supply. In September 2020, Tesla signed a sales agreement with Piedmont Lithium to buy high-purity lithium ore for up to ten years, specifically to supply "spodumene concentrate from Piedmont's North Carolina mineral deposit". In 2022, Tesla contracted for 110,000 tonnes of spodumene concentrate over four years from the Core Lithium's lithium mine in the Northern Territory of Australia.
Tesla also has a range of minor partnerships, for instance working with Airbnb and hotel chains to install destination chargers at selected locations.
Former partners:
Daimler:
Daimler and Tesla began working together in late 2007. On May 19, 2009, Daimler bought a stake of less than 10% in Tesla for a reported $50 million.
As part of the collaboration, Herbert Kohler, vice-president of E-Drive and Future Mobility at Daimler, took a Tesla board seat. On July 13, 2009, Daimler sold 40% of its acquisition to Aabar, an investment company controlled by the International Petroleum Investment Company owned by the government of Abu Dhabi.
In October 2014, Daimler sold its remaining holdings for a reported $780 million.
Tesla supplied battery packs for Freightliner Trucks in 2010. The company also built electric-powertrain components for the Mercedes-Benz A-Class E-Cell, with 500 cars planned to be built for trial in Europe beginning in September 2011. Tesla produced and co-developed the Mercedes-Benz B250e's powertrain, which ended production in 2017.
The electric motor was rated 134 hp (100 kW) and 230 pound force-feet (310 N⋅m), with a 36 kWh (130 MJ) battery. The vehicle had a driving range of 200 km (124 mi) with a top speed of 150 km/h (93 mph). Daimler division Smart produced the Smart ED2 cars from 2009 to 2012 which had a 14-kilowatt-hour (50 MJ) lithium-ion battery from Tesla.
Toyota:
In May 2010, Tesla and Toyota announced a deal in which Tesla purchased the former NUMMI factory from Toyota for $42 million, Toyota purchased $50 million in Tesla stock, and the two companies collaborated on an electric vehicle.
In July 2010, the companies announced they would work together on a second generation Toyota RAV4 EV. The vehicle was unveiled at the October 2010 Los Angeles Auto Show and 35 pilot vehicles were built for a demonstration and evaluation program that ran through 2011. Tesla supplied the lithium metal-oxide battery and other powertrain components based on components from the Roadster.
The production version was unveiled in August 2012, using battery pack, electronics and powertrain components from the Tesla Model S sedan (also launched in 2012). The RAV4 EV had a limited production run which resulted in just under 3,000 vehicles being produced, before it was discontinued in 2014.
According to Bloomberg News, the partnership between Tesla and Toyota was "marred by clashes between engineers". Toyota engineers rejected designs that Tesla had proposed for an enclosure to protect the RAV4 EV's battery pack. Toyota took over responsibility for the enclosure's design and strengthened it.
In 2014, Tesla ended up adding a titanium plate to protect the Model S sedan's battery after some debris-related crashes lead to cars catching fire. On June 5, 2017, Toyota announced that it had sold all of its shares in Tesla and halted the partnership.
Mobileye:
Initial versions of Autopilot were developed in partnership with Mobileye beginning in 2014. Mobileye ended the partnership on July 26, 2016, citing "disagreements about how the technology was deployed."
Lawsuits and controversies:
Main articles: List of lawsuits involving Tesla, Inc. and Criticism of Tesla, Inc.
Sexual harassment
In 2021, seven women came forward with claims of having faced sexual harassment and discrimination while working at Tesla's Fremont factory. They accused the company of facilitating a culture of rampant sexual harassment. The women said they were consistently subjected to catcalling, unwanted advances, unwanted touching, and discrimination while at work. "I was so tired of the unwanted attention and the males gawking at me I proceeded to create barriers around me just so I could get some relief," Brooks told The Washington Post. "That was something I felt necessary just so I can do my job." Stories range from intimate groping to being called out to the parking lot for sex.
Women feared calling Human Resources for help as their supervisors were often participants. Musk himself is not indicted, but most of the women pressing charges believe their abuse is connected to the behavior of CEO Elon Musk. They cite his crude remarks about women's bodies, wisecracks about starting a university that abbreviated to "T.IT.S", and his generally dismissive attitude towards reporting sexual harassment.
"What we're addressing for each of the lawsuits is just a shocking pattern of rampant harassment that exists at Tesla," said attorney David A. Lowe. In 2017, another woman had accused Tesla of very similar behavior and was subsequently fired. In a statement to the Guardian, Tesla confirmed the company had fired her, saying it had thoroughly investigated the employee's allegations with the help of "a neutral, third-party expert" and concluded her complaints were unmerited.
In May 2022, a California judge ruled that the sexual harassment lawsuit could move to court, rejecting Tesla's request for closed-door arbitration.
Labor disputes:
See also: Tesla and unions
In June 2016, the National Highway Traffic Safety Administration (NHTSA) took issue with Tesla's use of nondisclosure agreements (NDAs) regarding customer repairs and, in October 2021, the NHTSA formally asked Tesla to explain its NDA policy regarding customers invited into the FSD Beta. Tesla has used NDAs on multiple occasions with both employees and customers to allegedly prevent possible negative coverage.
From 2014 to 2018, Tesla's Fremont Factory had three times as many Occupational Safety and Health Administration (OSHA) violations as the ten largest U.S. auto plants combined. An investigation by the Reveal podcast alleged that Tesla "failed to report some of its serious injuries on legally mandated reports" to downplay the extent of injuries.
In January 2019, former Tesla security manager Sean Gouthro filed a whistleblower complaint alleging that the company had hacked employees' phones and spied on them, while also failing to report illegal activities to the authorities and shareholders.
Several legal cases have revolved around alleged whistleblower retaliation by Tesla. These include the dismissal of Tesla safety official Carlos Ramirez and Tesla security employee Karl Hansen. In 2020, the court ordered Hansen's case to arbitration. In June 2022, the arbitrator filed an unopposed motion with the court stating Hansen "has failed to establish the claims...Accordingly his claims are denied, and he shall take nothing".
In September 2019, a California judge ruled that 12 actions in 2017 and 2018 by Musk and other Tesla executives violated labor laws because they sabotaged employee attempts to unionize.
In March 2021, the US National Labor Relations Board ordered Musk to remove a tweet and reinstate a fired employee over union organization activities. Later, after appealing, a federal appeals court upheld the decision.
The California Civil Rights Department filed a suit in 2022 alleging "a pattern of racial harassment and bias" at the Tesla Fremont factory. As of April 2023, the department is also conducting a probe of the factory based on a 2021 complaint and claims that Tesla has been obstructing the investigation.
Fraud:
There have been numerous concerns about Tesla's financial reporting. In 2013, Bloomberg News questioned whether Tesla's financial reporting violated Generally Accepted Accounting Principles (GAAP) reporting standards. Fortune accused Tesla in 2016 of using creative accounting to show positive cash flow and quarterly profits.
In 2018, analysts expressed concerns over Tesla's accounts receivable balance. In September 2019, the SEC questioned Tesla CFO Zach Kirkhorn about Tesla's warranty reserves and lease accounting. Hedge fund manager David Einhorn accused Elon Musk in November 2019 of "significant fraud", and publicly questioned Tesla's accounting practices, telling Musk that he was "beginning to wonder whether your accounts receivable exist."
From 2012 to 2014, Tesla earned more than $295 million in Zero Emission Vehicle credits for a battery-swapping technology that was never made available to customers. Staff at California Air Resources Board were concerned that Tesla was "gaming" the battery swap subsidies and in 2013 recommended eliminating the credits.
A consolidated shareholders lawsuit alleges that Musk knew SolarCity was going broke before the acquisition, that he and the Tesla board overpaid for SolarCity, ignored their conflicts of interest and breached their fiduciary duties in connection with the deal, and failed to disclose "troubling facts" essential to an analysis of the proposed acquisition.
The members of the board settled in 2020, leaving Musk as the only defendant. In April 2022, the Delaware Court of Chancery ruled in favor of Musk, and its ruling was upheld by the Delaware Supreme Court in June 2023.
In August 2018, Elon Musk tweeted, "Am considering taking Tesla private at $420. Funding secured." The tweet caused the stock to initially rise but then drop when it was revealed to be false. Musk settled fraud charges with the U.S. Securities and Exchange Commission (SEC) over his false statements in September 2018.
According to the terms of the settlement, Musk agreed to have his tweets reviewed by Tesla's in-house counsel, he was removed from his chairman role at Tesla temporarily, and two new independent directors were appointed to the company's board. Tesla and Musk also paid civil penalties of $20 million each.
A civil class-action shareholder lawsuit over Musk's statements and other derivative lawsuits were also filed against Musk and the members of Tesla's board of directors, as then constituted, in regard to claims and actions made that were associated with potentially going private. In February 2023, a California jury unanimously found Musk and Tesla not liable in the class-action lawsuit.
In September 2018, Tesla disclosed that it was under investigation by the U.S. Federal Bureau of Investigation (FBI) regarding its Model 3 production figures. Authorities were investigating whether the company misled investors and made projections about its Model 3 production that it knew would be impossible to meet. A stockholder class action lawsuit against Tesla related to Model 3 production numbers (unrelated to the FBI investigation) was dismissed in March 2019.
Tesla US dealership disputes:
See also: Tesla US dealership disputes
Unlike other automakers, Tesla does not rely on franchised auto dealerships to sell vehicles and instead directly sells vehicles through its website and a network of company-owned stores.
In some areas, Tesla operates locations called "galleries" which "educate and inform customers about our products, but such locations do not actually transact in the sale of vehicles." This is because some jurisdictions, particularly in the United States, prohibit auto manufacturers from directly selling vehicles to consumers.
Dealership associations have filed lawsuits to prevent direct sales. These associations argued that the franchise system protects consumers by encouraging dealers to compete with each other, lowering the price a customer pays. They also claimed that direct sales would allow manufacturers to undersell their own dealers.
The United States Federal Trade Commission ultimately disproved the associations' claims and recommended allowing direct manufacturer sale, which they concluded would save consumers 8% in average vehicle price.
Tesla has also lobbied state governments for the right to directly sell cars. The company has argued that directly operating stores improves consumer education about electric vehicles, because dealerships would sell both Tesla and gas-powered vehicles. Doing this, according to the company, would then set up a conflict of interest for the dealers since properly advertising the benefits of an electric car would disparage the gas-powered vehicles, creating a disincentive to dealership EV sales.
Musk himself further contended that dealers would have a disincentive to sell electric vehicles because they require less maintenance and therefore would reduce after-sales service revenue, a large profit center for most dealerships.
Intellectual property:
In January 2021, Tesla filed a lawsuit against Alex Khatilov alleging that the former employee stole company information by downloading files related to its Warp Drive software to his personal Dropbox account. Khatilov denies the allegation that he was acting as a "willful and malicious thief" and attributes his actions to an accidental data transfer. The case was settled in August 2021 through mediation.
Tesla has sued former employees in the past for similar actions; for example, Guangzhi Cao, a Tesla engineer, was accused of uploading Tesla Autopilot source code to his iCloud account; Tesla and Cao settled in April 2021.
Misappropriation:
In 2018, a class action was filed against Musk and the members of Tesla's board alleging they breached their fiduciary duties by approving Musk's stock-based compensation plan. Musk received the first portion of his stock options payout, worth more than $700 million in May 2020.
In July 2023, Tesla board members returned $735 million to the company to settle a claim from a 2020 lawsuit alleging misappropriation of 11 million stock options granted to Elon Musk, Kimbal Musk, Larry Ellison, and others from 2017 to 2020.
Environmental violations:
In 2019, The United States Environmental Protection Agency fined Tesla for hazardous waste violations that occurred in 2017.
In June 2019, Tesla began negotiating penalties for 19 environmental violations from the Bay Area Air Quality Management District; the violations took place around Tesla Fremont's paint shop, where there had been at least four fires between 2014 and 2019.
Environmental violations and permit deviations at Tesla's Fremont Factory increased from 2018 to 2019 with the production ramp of the Model 3.
In June 2018, Tesla employee Martin Tripp leaked information that Tesla was scrapping or reworking up to 40% of its raw materials at the Nevada Gigafactory. After Tesla fired him for the leak, Tripp filed a lawsuit and claimed Tesla's security team gave police a false tip that he was planning a mass shooting at the Nevada factory. The court ruled in Tesla's favor on September 17, 2020.
Property damage:
In August 2019, Walmart filed a multi-million-dollar lawsuit against Tesla, claiming that Tesla's "negligent installation and maintenance" of solar panels caused roof fires at seven Walmart stores dating back to 2012. Walmart reached a settlement with Tesla in November 2019; the terms of the settlement were not disclosed.
In May 2021, a Norwegian judge found Tesla guilty of throttling charging speed through a 2019 over-the-air software update, awarding each of the 30 customers who were part of the lawsuit 136,000 Norwegian kroner ($16,000). Approximately 10,000 other Norwegian Tesla owners may be granted a similar award.
Racism:
Tesla has faced numerous complaints regarding workplace harassment and racial discrimination, with one former Tesla worker who attempted to sue the employer describing it as "a hotbed of racist behavior". As of December 2021, three percent of leadership at the company are African American. A former black worker described the work environment at Tesla's Buffalo plant as a "very racist place".
Tesla and SpaceX's treatment of Juneteenth in 2020 also came under fire. Approximately 100 former employees have submitted signed statements alleging that Tesla discriminates specifically against African Americans and "allows a racist environment in its factories."
According to the state's Department of Fair Employment and Housing, the Fremont factory is a racially segregated place where Black employees claim they are given the most menial and physically demanding work. The accusations of racism culminated in February 2022 with the California Department of Fair Employment and Housing suing Tesla for "discriminating against its Black workers."
In July 2021, former employee Melvin Berry received $1 million in his discrimination case in arbitration against Tesla after he claimed he was referred to by the n-word and forced to work longer hours at the Fremont plant.
In October 2021, a jury verdict in the Owen Diaz vs. Tesla trial awarded the plaintiff $137 million in damages after he had faced racial harassment at Tesla's Fremont facility during 2015–2016. In a blog, Tesla stressed that Diaz was never "really" a Tesla worker, and that most utterings of the n-word were expressed in a friendly manner.
In April 2022, federal judge William Orrick upheld the jury finding of Tesla's liability but reduced the total damage down to $15 million. Diaz was given a two-week deadline to decide if he would collect the damages. In June 2022, Diaz announced that he would be rejecting the $15 million award, opening the door for a new trial. In April 2023, Diaz was awarded $3.2 million in the new trial.
Few of these cases against Tesla ever make it to trial as most employees are made to sign arbitration agreements. Employees are afterwards required to resolve such disputes out of court, and behind closed doors.
COVID-19 pandemic:
Tesla's initial response to the COVID-19 pandemic in the United States has been the subject of considerable criticism. Musk had sought to exempt the Tesla Fremont factory in Alameda County, California from the government's stay-at-home orders.
In an earnings call in April, he was heard calling the public health orders "fascist". He had also called the public's response to the pandemic "dumb" and had said online that there would be zero cases by April. In May 2020, while Alameda County officials were negotiating with the company to reopen the Fremont Factory on the 18th, Musk defied local government orders by restarting production on the 11th.
Tesla also sued Alameda County, questioning the legality of the orders, but backed down after the Fremont Factory was given approval to reopen. In June 2020, Tesla published a detailed plan for bringing employees back to work and keeping them safe, however some employees still expressed concern for their health.
In May 2020, Musk told workers that they could stay home if they felt uncomfortable coming back to work. But in June, Tesla fired an employee who criticized the company for taking inadequate safety measures to protect workers from the coronavirus at the Fremont Factory.
Three more employees at Tesla's Fremont Factory claimed they were fired for staying home out of fear of catching COVID-19. This was subsequently denied by Tesla, which even stated that the employees were still on the payroll. COVID-19 cases at the factory grew from 10 in May 2020 to 125 in December 2020, with about 450 total cases in that time period out of the approximately 10,000 workers at the plant (4.5%).
In China, Tesla had what one executive described as "not a green light from the government to get back to work – but a flashing-sirens police escort." Tesla enjoyed special treatment and strong government support in China, including tax breaks, cheap financing, and assistance in building its Giga Shanghai factory at breakneck speeds.
Musk has praised China's way of doing things, a controversial stance due to deteriorating U.S.–Chinese relations, China's ongoing persecution of Uyghurs, and alleged human rights abuses in Hong Kong.
Criticism:
Main article: Criticism of Tesla, Inc.
Data privacy
Tesla was only the second product ever reviewed by Mozilla foundation which ticked all of their privacy concerns.
Short sellers:
TSLAQ is a collective of Tesla critics and short sellers who aim to "shape [the] perception [of Tesla] and move its stock." In January 2020, 20% of Tesla stock was shorted, the highest at that time of any stock in the U.S. equity markets.
By early 2021, according to CNN, short sellers had lost $40 billion during 2020 as the stock price climbed much higher. Michael Burry, a short seller portrayed in The Big Short, had shorted Tesla previously via his firm Scion Asset Management, but removed his position in October 2021.
Tesla's mission:
According to automotive journalist Jamie Kitman, when multiple CEOs of major automotive manufacturers approached Tesla for EV technology that Musk had claimed the company was willing to share, they instead were offered the opportunity to buy regulatory credits from Tesla. This suggested, according to Kitman, that "the company may not be as eager for the electric revolution to occur as it claims."
Giga New York audit:
In 2020, the New York State Comptroller released an audit of the Giga New York factory project, concluding that it presented many red flags, including lack of basic due diligence and that the factory itself produced only $0.54 in economic benefits for every $1 spent by the state.
Delays:
Musk has been criticized for repeated pushing out both production and release dates of products. By one count in 2016, Musk had missed 20 projections:
Musk responded in late 2018: "punctuality is not my strong suit...I never made a mass-produced car. How am I supposed to know with precision when it's gonna get done?"
Vehicle product issues
Recalls:
On April 20, 2017, Tesla issued a worldwide recall of 53,000 (~70%) of the 76,000 vehicles it sold in 2016 due to faulty parking brakes which could become stuck and "prevent the vehicles from moving".
On March 29, 2018, Tesla issued a worldwide recall of 123,000 Model S cars built before April 2016 due to corrosion-susceptible power steering bolts, which could fail and require the driver to use "increased force" to control the vehicle.
In October 2020, Tesla initiated a recall of nearly 50,000 Model X and Y vehicles throughout China for suspension issues.
Soon after in November, the NHTSA announced it had opened its own investigation into 115,000 Tesla cars regarding "front suspension safety issues", citing specifically 2015–2017 Model S and 2016–2017 Model X years. Cases of the "whompy wheel" phenomenon, which also included Model X and the occasional Model 3 cars, have been documented through 2020.
In February 2021, Tesla was required by the NHTSA to recall 135,000 Model S and Model X vehicles built from 2012 to 2018 due to using a flash memory device that was rated to last only 5 to 6 years. The problem was related to touchscreen failures that could possibly affect the rear-view camera, safety systems, Autopilot and other features. The underlying technical reason is that the car writes a large amount of syslog content to the device, wearing it out prematurely.
Also in February 2021, the German Federal Motor Transport Authority (KBA) ordered Tesla to recall 12,300 Model X cars because of "body mouldings problems".
In June 2021, Tesla recalled 5,974 electric vehicles due to worries that brake caliper bolts might become loose, which could lead to loss of tire pressure, potentially increasing the chance of a crash.
On December 30, 2021, Tesla announced that they are recalling more than 475,000 US model vehicles:
The Model S recall includes vehicles manufactured between 2014 and 2021. Around 1% of recalled Model 3s may have a defective rear-view camera, and around 14% of recalled model S' may have the defect. The recall was not linked to a contemporaneous issue regarding the Passenger Play feature, which allowed games to be played on the touchscreen while the car is in motion.
After an investigation was launched by the NHTSA covering 585,000 vehicles, Tesla agreed to make changes where the feature would be locked and unusable while the car is moving.
In September 2022, Tesla announced that they are recalling almost 1.1 million US model vehicles because the automatic window reversal system might not react correctly after detecting an obstruction, increasing the risk of injury. In response, Tesla announced an over-the-air software fix.
In February 2023, Tesla recalled its FSD software following a recommendation from NHTSA; the recall applied to approximately 360,000 cars. NHTSA found that FSD caused "unreasonable risk" when used on city streets.
In March 2023, about 3,500 Model Y Teslas were recalled for a bolting issue concerning the cars' second-row seats.
Fires:
See also: Plug-in electric vehicle fire incidents § Tesla
Tesla customers have reported the company as being "slow" to address how their cars can ignite. In 2013, a Model S caught fire after the vehicle hit metal debris on a highway in Kent, Washington. Tesla confirmed the fire began in the battery pack and was caused by the impact of an object.
As a result of this and other incidents, Tesla announced its decision to extend its current vehicle warranty to cover fire damage. In March 2014, the NHTSA announced that it had closed the investigation into whether the Model S was prone to catch fire, after Tesla said it would provide more protection to its battery packs. All Model S cars manufactured after March 6, 2014, have had the 0.25-inch (6.4 mm) aluminum shield over the battery pack replaced with a new three-layer shield.
In October 2019, the NHTSA opened an investigation into possible battery defects in Tesla's Model S and X vehicles from 2012 to 2019 that could cause "non-crash" fires.
Autopilot crashes:
See also: Tesla Autopilot § Fatal crashes
A Model S driver died in a collision with a tractor-trailer in 2016, while the vehicle was in Autopilot mode; the driver is believed to be the first person to have died in a Tesla vehicle in Autopilot.
The NHTSA investigated the accident but found no safety-related defect trend. In March 2018, a driver of a Tesla Model X was killed in a crash. Investigators say that the driver of the vehicle had his car in 'self-driving' mode and was using his phone to play games when the vehicle collided with the barrier in the middle of the freeway. Through investigation, the NTSB found that the Tesla malfunctioned due to the system being confused by an exit on the freeway.
According to a document released in June 2021, the NHTSA has initiated at least 30 investigations into Tesla crashes that were believed to involve the use of Autopilot, with some involving fatalities. In early September 2021, the NHTSA updated the list with an additional fatality incident and ordered Tesla to hand over all extensive data pertaining to US cars with Autopilot to determine if there is a safety defect that leads Tesla cars to collide with first-responder vehicles.
In late September 2021, Tesla released an over-the-air software update to detect emergency lights at night. In October 2021, the NHTSA asked Tesla why it did not issue a recall when it sent out that update.
In June 2022, the NHTSA said it would expand its probe, extending it to 830,000 cars from all current Tesla models. The probe will be moved up from the Preliminary Evaluation level to the Engineering Analysis one. The regulator cited the reason for the expansion as the need to "explore the degree to which Autopilot and associated Tesla systems may exacerbate human factors or behavioral safety risks by undermining the effectiveness of the driver's supervision."
A safety test conducted by the Dawn Project in August 2022 demonstrated that a test driver using the beta version of Full Self-Driving repeatedly hit a child-sized mannequin in its path, but there has been controversy over its conclusions. Several Tesla fans responded by conducting their own, independent tests using children; NHTSA released a statement warning against the practice.
Software hacking:
In August 2015, two researchers said they were able to take control of a Tesla Model S by hacking into the car's entertainment system. The hack required the researchers to physically access the car. Tesla issued a security update for the Model S the day after the exploit was announced.
In September 2016, researchers at Tencent's Keen Security Lab demonstrated a remote attack on a Tesla Model S and controlled the vehicle in both Parking and Driving Mode without physical access. They were able to compromise the automotive networking bus (CAN bus) when the vehicle's web browser was used while the vehicle was connected to a malicious Wi-Fi hotspot.
This was the first case of a remote control exploit demonstrated on a Tesla. The vulnerability was disclosed to Tesla under their bug bounty program and patched within 10 days, before the exploit was made public. Tencent also hacked the doors of a Model X in 2017.
In January 2018, security researchers informed Tesla that an Amazon Web Services account of theirs could be accessed directly from the Internet and that the account had been exploited for cryptocurrency mining. Tesla responded by securing the compromised system, rewarding the security researchers financially via their bug bounty program, and stating that the compromise did not violate customer privacy, nor vehicle safety or security.
Later in 2019, Tesla awarded a car plus $375,000 to ethical hackers during a Pwn2Own Model 3 hacking event.
In June 2022, Martin Herfurt, a security researcher in Austria, discovered that changes made to make Tesla vehicles easier to start with NFC cards also allowed for pairing new keys to the vehicle, allowing an attacker to enroll their own keys to a vehicle.
Phantom braking:
In February 2022, Tesla drivers have reported a surge in "phantom braking" events when using Tesla Autopilot which coincides with the automaker's removal of radar as a supplemental sensor in May 2021. In response, NHTSA has opened an investigation.
In May 2023, German business newspaper Handelsblatt published a series of articles based on a trove of internal Tesla data submitted to them from informants. The 100 gigabytes of data "contain[ed] over 1,000 accident reports involving phantom braking or unintended acceleration" as well as complaints about Tesla Autopilot.
Dutch authorities responded by saying they were investigating the company for possible data privacy violations.
Driving range performance:
Tesla has received thousands of complaints from owners that the driving ranges of their vehicles did not meet the ranges advertised by Tesla or the projections of in-dash range meters. When service centers were overwhelmed with appointments to take care of these issues, Tesla established a diversion team to cancel as many appointments as possible: Customers were told that remote diagnostics had determined there was no problem and their appointments were canceled. The company has been fined by South Korean regulators for its exaggerated range estimates.
Vehicle sales:
In 2022, Tesla ranked as the world's bestselling battery electric passenger car manufacturer, with a market share of 18%. Tesla reported 2022 vehicle deliveries of 1,313,851 units, up 40% from 2021. In March 2023, Tesla produced its 4 millionth car.
Production and sales by quarter
See also: History of Tesla, Inc. § Timeline of production and sales:
- Main articles below:
- Tesla Fremont Factory,
- Gigafactory Nevada,
- Gigafactory New York,
- Gigafactory Texas,
- and Gigafactory Mexico
Tesla was founded in San Carlos, California. In 2010, Tesla moved its corporate headquarters and opened a powertrain development facility in Palo Alto. Tesla's first retail store was opened in 2008 in Los Angeles.
Tesla's first assembly plant occupies the former NUMMI plant in Fremont, California, known as the Tesla Fremont Factory. The factory was originally opened by General Motors in 1962, and then operated by NUMMI, a joint venture of GM and Toyota from 1984. The joint venture ended when GM entered bankruptcy in 2009. In 2010, Toyota agreed to sell the plant to Tesla at a significant discount.
Tesla's first purpose-built facility was opened in Nevada in 2016. Gigafactory Nevada produces:
- Powerwalls,
- Powerpacks and Megapacks;
- battery cells in partnership with Panasonic;
- and Model 3 drivetrains.
The factory received substantial subsidies (abatements and credits) from the local and state government, that, in exchange for opening in their jurisdiction, allowed Tesla to operate essentially tax free for 10 years.
As part of the acquisition of SolarCity in 2016, Tesla gained control of Gigafactory New York in Buffalo on the site of a former Republic Steel plant. The state of New York spent cash to build and equip the factory through the Buffalo Billion program. In 2017, the factory started production of the Tesla Solar Roof, but faced multiple production challenges. Since 2020, Tesla has also assembled Superchargers in New York. The plant has been criticized for offering little economic benefit for the state funding.
On July 23, 2020, Tesla picked Austin, Texas, as the site of its fifth Gigafactory, since then known as Gigafactory Texas Giga Texas is planned to be the main factory for the Tesla Cybertruck and the Tesla Semi; it will also produce Model 3 and Model Y cars for the Eastern United States. On April 7, 2022, Tesla celebrated the opening of the facility in a public event.
On December 1, 2021, Tesla relocated its legal headquarters from Palo Alto, California to the Gigafactory site in Austin, Texas.
Tesla acquired a former JC Penney distribution center near Lathrop, California, in 2021 to build the "Megafactory" to manufacture the Megapack, the company's large scale energy storage product. The location opened in 2022.
Tesla announced in February it would open a new global engineering headquarters in Palo Alto, moving into a corporate campus once owned by Hewlett Packard, located a couple of miles from Tesla's former headquarters.
Tesla plans to open Gigafactory Mexico, the company's sixth Gigafactory near Monterrey, Mexico in 2025.
Europe:
Main articles:
Tesla opened its first European store in June 2009 in London. Tesla's European headquarters are in the Netherlands, part of a group of Tesla facilities in Tilburg, including the company's European Distribution Centre.
In late 2016, Tesla acquired German engineering firm Grohmann Engineering as a new division dedicated to helping Tesla increase the automation and effectiveness of its manufacturing process. After winding down existing contracts with other manufacturers, the renamed Tesla Automation now works exclusively on Tesla projects.
Tesla announced its plans to build a car and battery factory in Europe in 2016. Several countries campaigned to be the host, and eventually Germany was chosen in November 2019. On March 22, 2022, Tesla's first European Gigafactory named Gigafactory Berlin-Brandenburg opened with planned capacity to produce 500,000 electric vehicles annually as well as batteries for the cars.
Asia:
Main article: Gigafactory Shanghai
Tesla opened its first showroom in Asia in Tokyo, Japan, in October 2010.
In July 2018, Tesla signed an agreement with Chinese authorities to build a factory in Shanghai, China, which was Tesla's first Gigafactory outside of the United States. The factory building was finished in August 2019, and the initial Tesla Model 3s were in production from Gigafactory Shanghai in October 2019. In 2021, China accounted for 26% of Tesla sales revenue, and was the second largest market for Tesla after the United States, which accounted for 45% of its sales.
Tesla has expressed interest in expanding to India and perhaps building a future Gigafactory in the country. The company established a legal presence in the nation in 2021 and plans to open an office in Pune starting in October 2023.
Partners:
Panasonic
In January 2010, Tesla and battery cell maker Panasonic announced that they would together develop nickel-based lithium-ion battery cells for electric vehicles. The partnership was part of Panasonic's $1 billion investment over three years in facilities for lithium-ion cell research, development and production.
Beginning in 2010, Panasonic invested $30 million for a multi-year collaboration on new battery cells designed specifically for electric vehicles.
In July 2014, Panasonic reached a basic agreement with Tesla to participate in battery production at Giga Nevada.
Tesla and Panasonic also collaborated on the manufacturing and production of photovoltaic (PV) cells and modules at the Giga New York factory in Buffalo, New York. The partnership started in mid-2017 and ended in early 2020, before Panasonic exited the solar business entirely in January 2021.
In March 2021, the outgoing CEO of Panasonic stated that the company plans to reduce its reliance on Tesla as their battery partnership evolves.
Other current partners:
Tesla has long-term contracts in place for lithium supply. In September 2020, Tesla signed a sales agreement with Piedmont Lithium to buy high-purity lithium ore for up to ten years, specifically to supply "spodumene concentrate from Piedmont's North Carolina mineral deposit". In 2022, Tesla contracted for 110,000 tonnes of spodumene concentrate over four years from the Core Lithium's lithium mine in the Northern Territory of Australia.
Tesla also has a range of minor partnerships, for instance working with Airbnb and hotel chains to install destination chargers at selected locations.
Former partners:
Daimler:
Daimler and Tesla began working together in late 2007. On May 19, 2009, Daimler bought a stake of less than 10% in Tesla for a reported $50 million.
As part of the collaboration, Herbert Kohler, vice-president of E-Drive and Future Mobility at Daimler, took a Tesla board seat. On July 13, 2009, Daimler sold 40% of its acquisition to Aabar, an investment company controlled by the International Petroleum Investment Company owned by the government of Abu Dhabi.
In October 2014, Daimler sold its remaining holdings for a reported $780 million.
Tesla supplied battery packs for Freightliner Trucks in 2010. The company also built electric-powertrain components for the Mercedes-Benz A-Class E-Cell, with 500 cars planned to be built for trial in Europe beginning in September 2011. Tesla produced and co-developed the Mercedes-Benz B250e's powertrain, which ended production in 2017.
The electric motor was rated 134 hp (100 kW) and 230 pound force-feet (310 N⋅m), with a 36 kWh (130 MJ) battery. The vehicle had a driving range of 200 km (124 mi) with a top speed of 150 km/h (93 mph). Daimler division Smart produced the Smart ED2 cars from 2009 to 2012 which had a 14-kilowatt-hour (50 MJ) lithium-ion battery from Tesla.
Toyota:
In May 2010, Tesla and Toyota announced a deal in which Tesla purchased the former NUMMI factory from Toyota for $42 million, Toyota purchased $50 million in Tesla stock, and the two companies collaborated on an electric vehicle.
In July 2010, the companies announced they would work together on a second generation Toyota RAV4 EV. The vehicle was unveiled at the October 2010 Los Angeles Auto Show and 35 pilot vehicles were built for a demonstration and evaluation program that ran through 2011. Tesla supplied the lithium metal-oxide battery and other powertrain components based on components from the Roadster.
The production version was unveiled in August 2012, using battery pack, electronics and powertrain components from the Tesla Model S sedan (also launched in 2012). The RAV4 EV had a limited production run which resulted in just under 3,000 vehicles being produced, before it was discontinued in 2014.
According to Bloomberg News, the partnership between Tesla and Toyota was "marred by clashes between engineers". Toyota engineers rejected designs that Tesla had proposed for an enclosure to protect the RAV4 EV's battery pack. Toyota took over responsibility for the enclosure's design and strengthened it.
In 2014, Tesla ended up adding a titanium plate to protect the Model S sedan's battery after some debris-related crashes lead to cars catching fire. On June 5, 2017, Toyota announced that it had sold all of its shares in Tesla and halted the partnership.
Mobileye:
Initial versions of Autopilot were developed in partnership with Mobileye beginning in 2014. Mobileye ended the partnership on July 26, 2016, citing "disagreements about how the technology was deployed."
Lawsuits and controversies:
Main articles: List of lawsuits involving Tesla, Inc. and Criticism of Tesla, Inc.
Sexual harassment
In 2021, seven women came forward with claims of having faced sexual harassment and discrimination while working at Tesla's Fremont factory. They accused the company of facilitating a culture of rampant sexual harassment. The women said they were consistently subjected to catcalling, unwanted advances, unwanted touching, and discrimination while at work. "I was so tired of the unwanted attention and the males gawking at me I proceeded to create barriers around me just so I could get some relief," Brooks told The Washington Post. "That was something I felt necessary just so I can do my job." Stories range from intimate groping to being called out to the parking lot for sex.
Women feared calling Human Resources for help as their supervisors were often participants. Musk himself is not indicted, but most of the women pressing charges believe their abuse is connected to the behavior of CEO Elon Musk. They cite his crude remarks about women's bodies, wisecracks about starting a university that abbreviated to "T.IT.S", and his generally dismissive attitude towards reporting sexual harassment.
"What we're addressing for each of the lawsuits is just a shocking pattern of rampant harassment that exists at Tesla," said attorney David A. Lowe. In 2017, another woman had accused Tesla of very similar behavior and was subsequently fired. In a statement to the Guardian, Tesla confirmed the company had fired her, saying it had thoroughly investigated the employee's allegations with the help of "a neutral, third-party expert" and concluded her complaints were unmerited.
In May 2022, a California judge ruled that the sexual harassment lawsuit could move to court, rejecting Tesla's request for closed-door arbitration.
Labor disputes:
See also: Tesla and unions
In June 2016, the National Highway Traffic Safety Administration (NHTSA) took issue with Tesla's use of nondisclosure agreements (NDAs) regarding customer repairs and, in October 2021, the NHTSA formally asked Tesla to explain its NDA policy regarding customers invited into the FSD Beta. Tesla has used NDAs on multiple occasions with both employees and customers to allegedly prevent possible negative coverage.
From 2014 to 2018, Tesla's Fremont Factory had three times as many Occupational Safety and Health Administration (OSHA) violations as the ten largest U.S. auto plants combined. An investigation by the Reveal podcast alleged that Tesla "failed to report some of its serious injuries on legally mandated reports" to downplay the extent of injuries.
In January 2019, former Tesla security manager Sean Gouthro filed a whistleblower complaint alleging that the company had hacked employees' phones and spied on them, while also failing to report illegal activities to the authorities and shareholders.
Several legal cases have revolved around alleged whistleblower retaliation by Tesla. These include the dismissal of Tesla safety official Carlos Ramirez and Tesla security employee Karl Hansen. In 2020, the court ordered Hansen's case to arbitration. In June 2022, the arbitrator filed an unopposed motion with the court stating Hansen "has failed to establish the claims...Accordingly his claims are denied, and he shall take nothing".
In September 2019, a California judge ruled that 12 actions in 2017 and 2018 by Musk and other Tesla executives violated labor laws because they sabotaged employee attempts to unionize.
In March 2021, the US National Labor Relations Board ordered Musk to remove a tweet and reinstate a fired employee over union organization activities. Later, after appealing, a federal appeals court upheld the decision.
The California Civil Rights Department filed a suit in 2022 alleging "a pattern of racial harassment and bias" at the Tesla Fremont factory. As of April 2023, the department is also conducting a probe of the factory based on a 2021 complaint and claims that Tesla has been obstructing the investigation.
Fraud:
There have been numerous concerns about Tesla's financial reporting. In 2013, Bloomberg News questioned whether Tesla's financial reporting violated Generally Accepted Accounting Principles (GAAP) reporting standards. Fortune accused Tesla in 2016 of using creative accounting to show positive cash flow and quarterly profits.
In 2018, analysts expressed concerns over Tesla's accounts receivable balance. In September 2019, the SEC questioned Tesla CFO Zach Kirkhorn about Tesla's warranty reserves and lease accounting. Hedge fund manager David Einhorn accused Elon Musk in November 2019 of "significant fraud", and publicly questioned Tesla's accounting practices, telling Musk that he was "beginning to wonder whether your accounts receivable exist."
From 2012 to 2014, Tesla earned more than $295 million in Zero Emission Vehicle credits for a battery-swapping technology that was never made available to customers. Staff at California Air Resources Board were concerned that Tesla was "gaming" the battery swap subsidies and in 2013 recommended eliminating the credits.
A consolidated shareholders lawsuit alleges that Musk knew SolarCity was going broke before the acquisition, that he and the Tesla board overpaid for SolarCity, ignored their conflicts of interest and breached their fiduciary duties in connection with the deal, and failed to disclose "troubling facts" essential to an analysis of the proposed acquisition.
The members of the board settled in 2020, leaving Musk as the only defendant. In April 2022, the Delaware Court of Chancery ruled in favor of Musk, and its ruling was upheld by the Delaware Supreme Court in June 2023.
In August 2018, Elon Musk tweeted, "Am considering taking Tesla private at $420. Funding secured." The tweet caused the stock to initially rise but then drop when it was revealed to be false. Musk settled fraud charges with the U.S. Securities and Exchange Commission (SEC) over his false statements in September 2018.
According to the terms of the settlement, Musk agreed to have his tweets reviewed by Tesla's in-house counsel, he was removed from his chairman role at Tesla temporarily, and two new independent directors were appointed to the company's board. Tesla and Musk also paid civil penalties of $20 million each.
A civil class-action shareholder lawsuit over Musk's statements and other derivative lawsuits were also filed against Musk and the members of Tesla's board of directors, as then constituted, in regard to claims and actions made that were associated with potentially going private. In February 2023, a California jury unanimously found Musk and Tesla not liable in the class-action lawsuit.
In September 2018, Tesla disclosed that it was under investigation by the U.S. Federal Bureau of Investigation (FBI) regarding its Model 3 production figures. Authorities were investigating whether the company misled investors and made projections about its Model 3 production that it knew would be impossible to meet. A stockholder class action lawsuit against Tesla related to Model 3 production numbers (unrelated to the FBI investigation) was dismissed in March 2019.
Tesla US dealership disputes:
See also: Tesla US dealership disputes
Unlike other automakers, Tesla does not rely on franchised auto dealerships to sell vehicles and instead directly sells vehicles through its website and a network of company-owned stores.
In some areas, Tesla operates locations called "galleries" which "educate and inform customers about our products, but such locations do not actually transact in the sale of vehicles." This is because some jurisdictions, particularly in the United States, prohibit auto manufacturers from directly selling vehicles to consumers.
Dealership associations have filed lawsuits to prevent direct sales. These associations argued that the franchise system protects consumers by encouraging dealers to compete with each other, lowering the price a customer pays. They also claimed that direct sales would allow manufacturers to undersell their own dealers.
The United States Federal Trade Commission ultimately disproved the associations' claims and recommended allowing direct manufacturer sale, which they concluded would save consumers 8% in average vehicle price.
Tesla has also lobbied state governments for the right to directly sell cars. The company has argued that directly operating stores improves consumer education about electric vehicles, because dealerships would sell both Tesla and gas-powered vehicles. Doing this, according to the company, would then set up a conflict of interest for the dealers since properly advertising the benefits of an electric car would disparage the gas-powered vehicles, creating a disincentive to dealership EV sales.
Musk himself further contended that dealers would have a disincentive to sell electric vehicles because they require less maintenance and therefore would reduce after-sales service revenue, a large profit center for most dealerships.
Intellectual property:
In January 2021, Tesla filed a lawsuit against Alex Khatilov alleging that the former employee stole company information by downloading files related to its Warp Drive software to his personal Dropbox account. Khatilov denies the allegation that he was acting as a "willful and malicious thief" and attributes his actions to an accidental data transfer. The case was settled in August 2021 through mediation.
Tesla has sued former employees in the past for similar actions; for example, Guangzhi Cao, a Tesla engineer, was accused of uploading Tesla Autopilot source code to his iCloud account; Tesla and Cao settled in April 2021.
Misappropriation:
In 2018, a class action was filed against Musk and the members of Tesla's board alleging they breached their fiduciary duties by approving Musk's stock-based compensation plan. Musk received the first portion of his stock options payout, worth more than $700 million in May 2020.
In July 2023, Tesla board members returned $735 million to the company to settle a claim from a 2020 lawsuit alleging misappropriation of 11 million stock options granted to Elon Musk, Kimbal Musk, Larry Ellison, and others from 2017 to 2020.
Environmental violations:
In 2019, The United States Environmental Protection Agency fined Tesla for hazardous waste violations that occurred in 2017.
In June 2019, Tesla began negotiating penalties for 19 environmental violations from the Bay Area Air Quality Management District; the violations took place around Tesla Fremont's paint shop, where there had been at least four fires between 2014 and 2019.
Environmental violations and permit deviations at Tesla's Fremont Factory increased from 2018 to 2019 with the production ramp of the Model 3.
In June 2018, Tesla employee Martin Tripp leaked information that Tesla was scrapping or reworking up to 40% of its raw materials at the Nevada Gigafactory. After Tesla fired him for the leak, Tripp filed a lawsuit and claimed Tesla's security team gave police a false tip that he was planning a mass shooting at the Nevada factory. The court ruled in Tesla's favor on September 17, 2020.
Property damage:
In August 2019, Walmart filed a multi-million-dollar lawsuit against Tesla, claiming that Tesla's "negligent installation and maintenance" of solar panels caused roof fires at seven Walmart stores dating back to 2012. Walmart reached a settlement with Tesla in November 2019; the terms of the settlement were not disclosed.
In May 2021, a Norwegian judge found Tesla guilty of throttling charging speed through a 2019 over-the-air software update, awarding each of the 30 customers who were part of the lawsuit 136,000 Norwegian kroner ($16,000). Approximately 10,000 other Norwegian Tesla owners may be granted a similar award.
Racism:
Tesla has faced numerous complaints regarding workplace harassment and racial discrimination, with one former Tesla worker who attempted to sue the employer describing it as "a hotbed of racist behavior". As of December 2021, three percent of leadership at the company are African American. A former black worker described the work environment at Tesla's Buffalo plant as a "very racist place".
Tesla and SpaceX's treatment of Juneteenth in 2020 also came under fire. Approximately 100 former employees have submitted signed statements alleging that Tesla discriminates specifically against African Americans and "allows a racist environment in its factories."
According to the state's Department of Fair Employment and Housing, the Fremont factory is a racially segregated place where Black employees claim they are given the most menial and physically demanding work. The accusations of racism culminated in February 2022 with the California Department of Fair Employment and Housing suing Tesla for "discriminating against its Black workers."
In July 2021, former employee Melvin Berry received $1 million in his discrimination case in arbitration against Tesla after he claimed he was referred to by the n-word and forced to work longer hours at the Fremont plant.
In October 2021, a jury verdict in the Owen Diaz vs. Tesla trial awarded the plaintiff $137 million in damages after he had faced racial harassment at Tesla's Fremont facility during 2015–2016. In a blog, Tesla stressed that Diaz was never "really" a Tesla worker, and that most utterings of the n-word were expressed in a friendly manner.
In April 2022, federal judge William Orrick upheld the jury finding of Tesla's liability but reduced the total damage down to $15 million. Diaz was given a two-week deadline to decide if he would collect the damages. In June 2022, Diaz announced that he would be rejecting the $15 million award, opening the door for a new trial. In April 2023, Diaz was awarded $3.2 million in the new trial.
Few of these cases against Tesla ever make it to trial as most employees are made to sign arbitration agreements. Employees are afterwards required to resolve such disputes out of court, and behind closed doors.
COVID-19 pandemic:
Tesla's initial response to the COVID-19 pandemic in the United States has been the subject of considerable criticism. Musk had sought to exempt the Tesla Fremont factory in Alameda County, California from the government's stay-at-home orders.
In an earnings call in April, he was heard calling the public health orders "fascist". He had also called the public's response to the pandemic "dumb" and had said online that there would be zero cases by April. In May 2020, while Alameda County officials were negotiating with the company to reopen the Fremont Factory on the 18th, Musk defied local government orders by restarting production on the 11th.
Tesla also sued Alameda County, questioning the legality of the orders, but backed down after the Fremont Factory was given approval to reopen. In June 2020, Tesla published a detailed plan for bringing employees back to work and keeping them safe, however some employees still expressed concern for their health.
In May 2020, Musk told workers that they could stay home if they felt uncomfortable coming back to work. But in June, Tesla fired an employee who criticized the company for taking inadequate safety measures to protect workers from the coronavirus at the Fremont Factory.
Three more employees at Tesla's Fremont Factory claimed they were fired for staying home out of fear of catching COVID-19. This was subsequently denied by Tesla, which even stated that the employees were still on the payroll. COVID-19 cases at the factory grew from 10 in May 2020 to 125 in December 2020, with about 450 total cases in that time period out of the approximately 10,000 workers at the plant (4.5%).
In China, Tesla had what one executive described as "not a green light from the government to get back to work – but a flashing-sirens police escort." Tesla enjoyed special treatment and strong government support in China, including tax breaks, cheap financing, and assistance in building its Giga Shanghai factory at breakneck speeds.
Musk has praised China's way of doing things, a controversial stance due to deteriorating U.S.–Chinese relations, China's ongoing persecution of Uyghurs, and alleged human rights abuses in Hong Kong.
Criticism:
Main article: Criticism of Tesla, Inc.
Data privacy
Tesla was only the second product ever reviewed by Mozilla foundation which ticked all of their privacy concerns.
Short sellers:
TSLAQ is a collective of Tesla critics and short sellers who aim to "shape [the] perception [of Tesla] and move its stock." In January 2020, 20% of Tesla stock was shorted, the highest at that time of any stock in the U.S. equity markets.
By early 2021, according to CNN, short sellers had lost $40 billion during 2020 as the stock price climbed much higher. Michael Burry, a short seller portrayed in The Big Short, had shorted Tesla previously via his firm Scion Asset Management, but removed his position in October 2021.
Tesla's mission:
According to automotive journalist Jamie Kitman, when multiple CEOs of major automotive manufacturers approached Tesla for EV technology that Musk had claimed the company was willing to share, they instead were offered the opportunity to buy regulatory credits from Tesla. This suggested, according to Kitman, that "the company may not be as eager for the electric revolution to occur as it claims."
Giga New York audit:
In 2020, the New York State Comptroller released an audit of the Giga New York factory project, concluding that it presented many red flags, including lack of basic due diligence and that the factory itself produced only $0.54 in economic benefits for every $1 spent by the state.
Delays:
Musk has been criticized for repeated pushing out both production and release dates of products. By one count in 2016, Musk had missed 20 projections:
- In October 2017, Musk predicted that Model 3 production would be 5,000 units per week by December. A month later, he revised that target to "sometime in March" 2018.
- Delivery dates for the Model 3 were delayed as well.
- Other projects like converting supercharger stations to be solar-powered have also lagged projections.
Musk responded in late 2018: "punctuality is not my strong suit...I never made a mass-produced car. How am I supposed to know with precision when it's gonna get done?"
Vehicle product issues
Recalls:
On April 20, 2017, Tesla issued a worldwide recall of 53,000 (~70%) of the 76,000 vehicles it sold in 2016 due to faulty parking brakes which could become stuck and "prevent the vehicles from moving".
On March 29, 2018, Tesla issued a worldwide recall of 123,000 Model S cars built before April 2016 due to corrosion-susceptible power steering bolts, which could fail and require the driver to use "increased force" to control the vehicle.
In October 2020, Tesla initiated a recall of nearly 50,000 Model X and Y vehicles throughout China for suspension issues.
Soon after in November, the NHTSA announced it had opened its own investigation into 115,000 Tesla cars regarding "front suspension safety issues", citing specifically 2015–2017 Model S and 2016–2017 Model X years. Cases of the "whompy wheel" phenomenon, which also included Model X and the occasional Model 3 cars, have been documented through 2020.
In February 2021, Tesla was required by the NHTSA to recall 135,000 Model S and Model X vehicles built from 2012 to 2018 due to using a flash memory device that was rated to last only 5 to 6 years. The problem was related to touchscreen failures that could possibly affect the rear-view camera, safety systems, Autopilot and other features. The underlying technical reason is that the car writes a large amount of syslog content to the device, wearing it out prematurely.
Also in February 2021, the German Federal Motor Transport Authority (KBA) ordered Tesla to recall 12,300 Model X cars because of "body mouldings problems".
In June 2021, Tesla recalled 5,974 electric vehicles due to worries that brake caliper bolts might become loose, which could lead to loss of tire pressure, potentially increasing the chance of a crash.
On December 30, 2021, Tesla announced that they are recalling more than 475,000 US model vehicles:
- This included 356,309 Model 3 Tesla vehicles from 2017 to 2020 due to rear-view camera issues
- and a further 119,009 Tesla Model S vehicles due to potential problems with the trunk or boot.
The Model S recall includes vehicles manufactured between 2014 and 2021. Around 1% of recalled Model 3s may have a defective rear-view camera, and around 14% of recalled model S' may have the defect. The recall was not linked to a contemporaneous issue regarding the Passenger Play feature, which allowed games to be played on the touchscreen while the car is in motion.
After an investigation was launched by the NHTSA covering 585,000 vehicles, Tesla agreed to make changes where the feature would be locked and unusable while the car is moving.
In September 2022, Tesla announced that they are recalling almost 1.1 million US model vehicles because the automatic window reversal system might not react correctly after detecting an obstruction, increasing the risk of injury. In response, Tesla announced an over-the-air software fix.
In February 2023, Tesla recalled its FSD software following a recommendation from NHTSA; the recall applied to approximately 360,000 cars. NHTSA found that FSD caused "unreasonable risk" when used on city streets.
In March 2023, about 3,500 Model Y Teslas were recalled for a bolting issue concerning the cars' second-row seats.
Fires:
See also: Plug-in electric vehicle fire incidents § Tesla
Tesla customers have reported the company as being "slow" to address how their cars can ignite. In 2013, a Model S caught fire after the vehicle hit metal debris on a highway in Kent, Washington. Tesla confirmed the fire began in the battery pack and was caused by the impact of an object.
As a result of this and other incidents, Tesla announced its decision to extend its current vehicle warranty to cover fire damage. In March 2014, the NHTSA announced that it had closed the investigation into whether the Model S was prone to catch fire, after Tesla said it would provide more protection to its battery packs. All Model S cars manufactured after March 6, 2014, have had the 0.25-inch (6.4 mm) aluminum shield over the battery pack replaced with a new three-layer shield.
In October 2019, the NHTSA opened an investigation into possible battery defects in Tesla's Model S and X vehicles from 2012 to 2019 that could cause "non-crash" fires.
Autopilot crashes:
See also: Tesla Autopilot § Fatal crashes
A Model S driver died in a collision with a tractor-trailer in 2016, while the vehicle was in Autopilot mode; the driver is believed to be the first person to have died in a Tesla vehicle in Autopilot.
The NHTSA investigated the accident but found no safety-related defect trend. In March 2018, a driver of a Tesla Model X was killed in a crash. Investigators say that the driver of the vehicle had his car in 'self-driving' mode and was using his phone to play games when the vehicle collided with the barrier in the middle of the freeway. Through investigation, the NTSB found that the Tesla malfunctioned due to the system being confused by an exit on the freeway.
According to a document released in June 2021, the NHTSA has initiated at least 30 investigations into Tesla crashes that were believed to involve the use of Autopilot, with some involving fatalities. In early September 2021, the NHTSA updated the list with an additional fatality incident and ordered Tesla to hand over all extensive data pertaining to US cars with Autopilot to determine if there is a safety defect that leads Tesla cars to collide with first-responder vehicles.
In late September 2021, Tesla released an over-the-air software update to detect emergency lights at night. In October 2021, the NHTSA asked Tesla why it did not issue a recall when it sent out that update.
In June 2022, the NHTSA said it would expand its probe, extending it to 830,000 cars from all current Tesla models. The probe will be moved up from the Preliminary Evaluation level to the Engineering Analysis one. The regulator cited the reason for the expansion as the need to "explore the degree to which Autopilot and associated Tesla systems may exacerbate human factors or behavioral safety risks by undermining the effectiveness of the driver's supervision."
A safety test conducted by the Dawn Project in August 2022 demonstrated that a test driver using the beta version of Full Self-Driving repeatedly hit a child-sized mannequin in its path, but there has been controversy over its conclusions. Several Tesla fans responded by conducting their own, independent tests using children; NHTSA released a statement warning against the practice.
Software hacking:
In August 2015, two researchers said they were able to take control of a Tesla Model S by hacking into the car's entertainment system. The hack required the researchers to physically access the car. Tesla issued a security update for the Model S the day after the exploit was announced.
In September 2016, researchers at Tencent's Keen Security Lab demonstrated a remote attack on a Tesla Model S and controlled the vehicle in both Parking and Driving Mode without physical access. They were able to compromise the automotive networking bus (CAN bus) when the vehicle's web browser was used while the vehicle was connected to a malicious Wi-Fi hotspot.
This was the first case of a remote control exploit demonstrated on a Tesla. The vulnerability was disclosed to Tesla under their bug bounty program and patched within 10 days, before the exploit was made public. Tencent also hacked the doors of a Model X in 2017.
In January 2018, security researchers informed Tesla that an Amazon Web Services account of theirs could be accessed directly from the Internet and that the account had been exploited for cryptocurrency mining. Tesla responded by securing the compromised system, rewarding the security researchers financially via their bug bounty program, and stating that the compromise did not violate customer privacy, nor vehicle safety or security.
Later in 2019, Tesla awarded a car plus $375,000 to ethical hackers during a Pwn2Own Model 3 hacking event.
In June 2022, Martin Herfurt, a security researcher in Austria, discovered that changes made to make Tesla vehicles easier to start with NFC cards also allowed for pairing new keys to the vehicle, allowing an attacker to enroll their own keys to a vehicle.
Phantom braking:
In February 2022, Tesla drivers have reported a surge in "phantom braking" events when using Tesla Autopilot which coincides with the automaker's removal of radar as a supplemental sensor in May 2021. In response, NHTSA has opened an investigation.
In May 2023, German business newspaper Handelsblatt published a series of articles based on a trove of internal Tesla data submitted to them from informants. The 100 gigabytes of data "contain[ed] over 1,000 accident reports involving phantom braking or unintended acceleration" as well as complaints about Tesla Autopilot.
Dutch authorities responded by saying they were investigating the company for possible data privacy violations.
Driving range performance:
Tesla has received thousands of complaints from owners that the driving ranges of their vehicles did not meet the ranges advertised by Tesla or the projections of in-dash range meters. When service centers were overwhelmed with appointments to take care of these issues, Tesla established a diversion team to cancel as many appointments as possible: Customers were told that remote diagnostics had determined there was no problem and their appointments were canceled. The company has been fined by South Korean regulators for its exaggerated range estimates.
Vehicle sales:
In 2022, Tesla ranked as the world's bestselling battery electric passenger car manufacturer, with a market share of 18%. Tesla reported 2022 vehicle deliveries of 1,313,851 units, up 40% from 2021. In March 2023, Tesla produced its 4 millionth car.
Production and sales by quarter
See also: History of Tesla, Inc. § Timeline of production and sales:
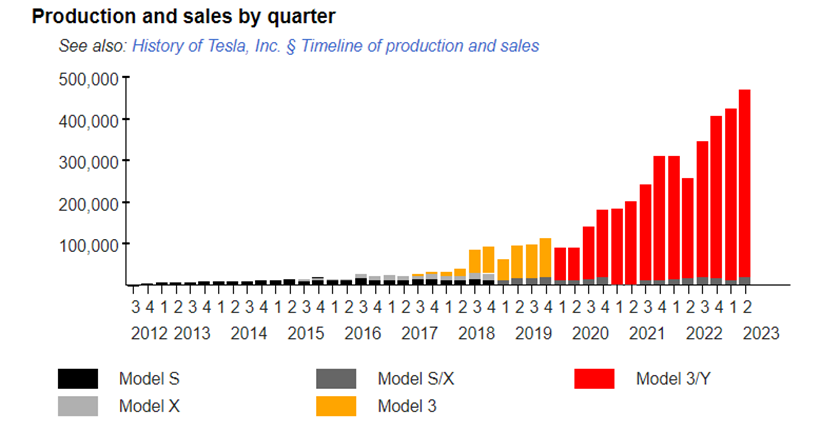
Tesla deliveries vary significantly by month due to regional issues such as availability of car carriers and registration. On March 9, 2020, the company produced its 1 millionth electric car, becoming the first auto manufacturer to achieve such a milestone. In the third quarter of 2021, Tesla sold its 2 millionth electric car, becoming the first auto manufacturer to achieve such a milestone. In the first quarter of 2023, the Model Y became the world's best-selling car, surpassing the Toyota Corolla.
Finances
For the fiscal (and calendar) year 2021, Tesla reported a net income of $5.52 billion. The annual revenue was $53.8 billion, an increase of 71% over the previous fiscal year.
Of the revenue number in 2021, $314 million came from selling regulatory credits to other automakers to meet government pollution standards. That number has been a smaller percentage of revenue for multiple quarters.
Tesla ended 2021 with $17.6 billion of cash on hand, down $1.8 billion from the end of 2020.
In February 2021, a 10-K filing revealed that Tesla had invested some $1.5 billion in the cryptocurrency Bitcoin, and the company indicated it would soon accept Bitcoin as a form of payment. Critics then pointed out how investing in cryptocurrency can run counter to Tesla's environmental goals. Tesla made more profit from the 2021 investment than the profit from selling cars in 2020, due to the Bitcoin price increase after the investment was announced.
The quarter ending June 2021 was the first time Tesla made a profit independent of Bitcoin and regulatory credits:
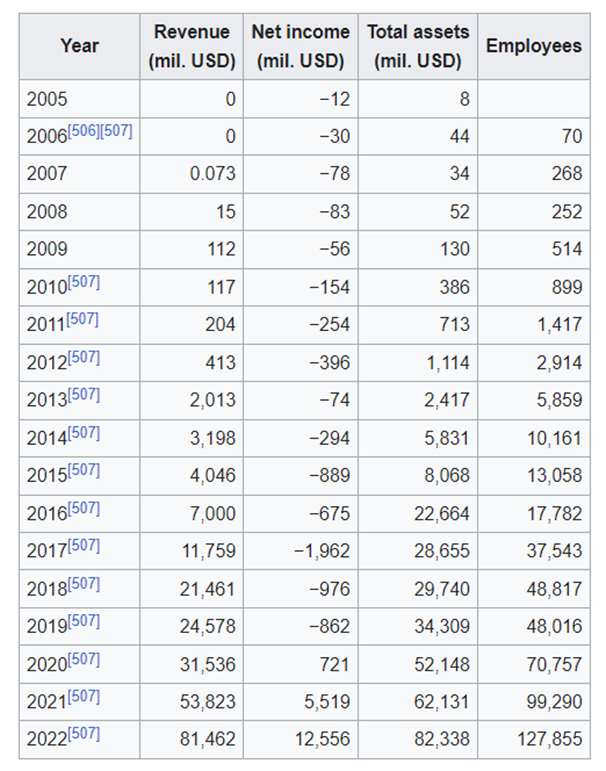
Senior leadership:
List of chief executives
- Martin Eberhard (2004–2007)
- Ze'ev Drori (2007–2008)
- Elon Musk (since October 2008)
List of board chairs
- Elon Musk (2004–2018)
- Robyn Denholm (since November 2018)
Board of directors:
Tesla has received criticism that its board lacks enough independent directors. In an April 2017 public letter, a group of influential Tesla investors, including the California State Teachers' Retirement System, asked Tesla to add two new independent directors to its board "who do not have any ties with chief executive Elon Musk".
The investors wrote that "five of six current non-executive directors have professional or personal ties to Mr. Musk that could put at risk their ability to exercise independent judgement."
Tesla's directors at the time included:
- Brad Buss, who served as chief financial officer at SolarCity;
- Steve Jurvetson, a venture capitalist who also sits on the board of SpaceX;
- Elon Musk's brother, Kimbal;
- and Ira Ehrenpreis and Antonio Gracias, both of whom also invested in SpaceX.
The letter called for a more independent board that could put a check on groupthink.
At first Musk responded on Twitter, writing that the investors "should buy Ford stock" because "their governance is amazing." Two days later, he promised he would add two independent board members; Kathleen Wilson-Thompson and Larry Ellison were added at the end of 2018.
Ellison stepped down in August 2022. Former Tesla CTO J. B. Straubel who left the company in 2019, was elected to the board in 2023.
Another criticism of the board composition is that most of the independent directors lack automotive industry experience. The exception is Robyn Denholm who served in finance and corporate reporting roles at Toyota Australia from 1989 to 1996.
Other previous board members include:
- businessman Steve Westly;
- Daimler executive Herbert Kohler;
- CEO and Chairman of Johnson Publishing Company Linda Johnson Rice;
- and United Nations Special Envoy on Innovative Finance and Sustainable Investments Hiromichi Mizuno.
As of May 2023, the board members are: